LTC/USDT – Breakout Above $135 Could Trigger Rally Toward $240Litecoin is approaching a pivotal breakout point after consolidating within a multi-year accumulation range between $60 and $140.
The recent higher-low structure and sustained strength above $100 reflect improving market sentiment and growing accumulation interest.
A decisive weekly close above $135 would confirm a breakout from this long-term base, potentially initiating a mid-term rally toward $180, followed by the major supply zone at $230–$240.
Momentum is steadily shifting in favor of buyers, supported by improving trend alignment and volume behavior.
As long as the $95–$100 support zone remains intact, the technical bias stays bullish, and the broader market structure favors continuation to the upside.
These are my observations and plans based on my chart analysis and not financial advice.
Bullishpattern


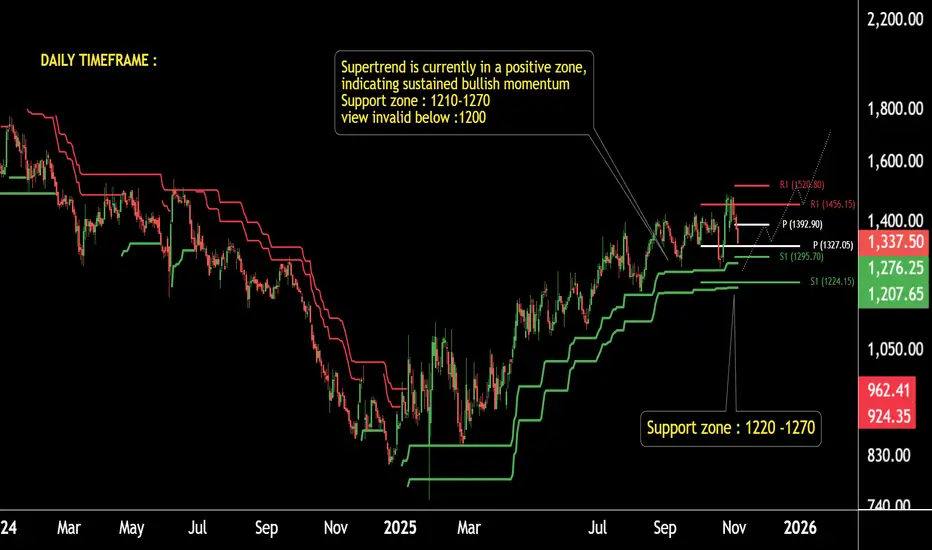
CREDITACC Heating Up… Key Levels Triggering the Next Bull Move!This is the daily timeframe chart of CREDITACC.
The stock is moving within a well-defined structure and consistently respecting the Supertrend support on every decline.
Each time it touches the Supertrend zone, the price forms a fresh higher high, maintaining a strong upward rhythm.
The current Supertrend support zones are placed near 1270 and 1220. The stock also holds a firm pivot support around 1224.
If this momentum continues and the stock keeps respecting these support levels, we may see higher prices in the coming sessions.
THANK YOU !!
ZKUSDT - A long upward journey is about to beginWe literally caught the bottom in the previous analysis — no doubt about it.
The chart looks extremely bullish and is showing massive upward momentum.
There’s a huge falling wedge pattern that has broken out and been successfully retested on the daily timeframe, with a potential target of 5x from here.
Best Regards:
Ceciliones🎯

DigitalOcean: Quiet Cloud Stock with Big PotentialIntroduction
While everyone is focused on AI giants like NVIDIA and the big cloud players, there’s a quieter cloud company quietly gaining momentum.
DigitalOcean (DOCN) may not grab headlines, but its fundamentals and technical setup make it an interesting stock for investors seeking growth in the cloud infrastructure space.
Fundamentals
DigitalOcean’s financials show strong growth:
Revenue: +12–13% year-over-year
EPS: +~80% year-over-year
The company currently has no buyback program, and there’s a slight share dilution, but the growth trajectory more than offsets this.
Key valuation metrics:
Forward P/E: 19
P/S: 4
This places the stock at roughly four times revenue, which is attractive considering its rapid earnings growth.
Overall, from a fundamental perspective, DigitalOcean is healthy — cash flows are improving, profits are up, and the business is in a solid growth phase.
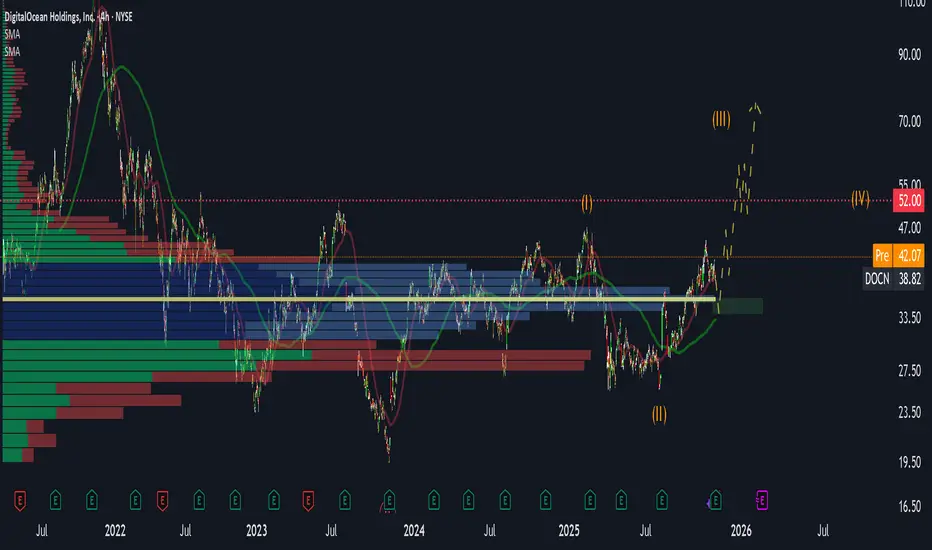
Technical Analysis
On the chart, using a Fixed Range Volume Profile, the largest volume cluster sits around $30–40, suggesting smart money accumulation.
Price has been compressing toward $52, forming a classic wave structure:
First wave, Second wave
Another first, second sequence
This coiling pattern indicates a potential breakout.
Upside target: ~$130 if the $52 resistance is broken
Possible short-term dip: ~$35 to fill an unclosed gap
The technicals suggest a bullish setup for traders looking at momentum and accumulation zones.
Conclusion
DigitalOcean is currently a long-term holding in my portfolio.
The combination of solid fundamentals and bullish technical setup makes it a stock to watch.
If growth continues at the current pace, triple-digit prices are realistic.
Traders can use this setup to watch key levels: $52 for breakout confirmation and $30–40 as a base accumulation zone.
ZK - bullish breakout! NYSE:ZK - bullish breakout above precedent high ✅📈
40 - 50% pump incoming?? 🚀🤑
Hype remain strong & uptrend clean! 📈
Prices might fly toward upper key levels:
0.100 - 0.1180 - 0.140$ - 0.1550$ (weekly).🎯

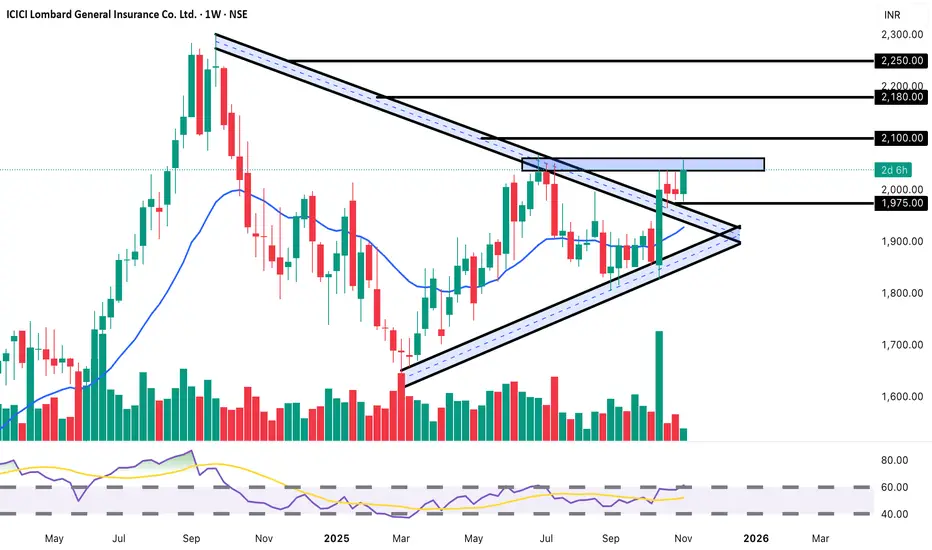
ICICIGI: Weekly Triangle Squeeze | Explosive Move Expected Soon BUY Setup 🛡️
Entry: ₹2,040-2,050 (Current Level)
Target 1: ₹2,080-2,100
Target 2: ₹2,150-2,180
Target 3: ₹2,250+ (Extended - Post Breakout)
Stop Loss: ₹1,975
Technical Rationale:
MAJOR PATTERN: Symmetrical Triangle forming on Weekly chart - apex approaching
Trading at upper boundary of triangle - breakout imminent (marked "2d 6h")
Strong +2.32% gain today showing bullish momentum
Volume at 11M - showing increased participation
Price testing critical resistance at 2,000-2,050 zone
Multiple convergence of trendlines creating decision point
RSI around 60 - neutral to bullish zone with room for upside
Trading above EMA on higher timeframes
Insurance sector showing relative strength
Triangle pattern spanning 6+ months - significant breakout potential
Support at ascending trendline around 1,975
Risk-Reward: Excellent 1:3+ ratio (much higher if triangle breaks out)
Pattern: Symmetrical Triangle on Weekly Chart - one of the most powerful continuation patterns. Breakout from 6-month consolidation could trigger massive move.
Strategy:
Conservative: Wait for weekly close above 2,060 with volume for confirmation
Aggressive: Enter now with SL below triangle support at 1,975
Book 25% at T1 (2,090), 25% at T2 (2,165), hold 50% for major breakout target 2,250-2,300
Key Levels:
CRITICAL Breakout Zone: 2,050-2,060 (triangle apex)
Strong Resistance: 2,000-2,050 (current battle zone)
Extended Targets: 2,250, 2,300+ (measured move from triangle)
Major Support: 1,975 (triangle support), 1,900
Timeframe: Weekly chart - suitable for positional/swing trading (weeks to months)
Triangle Measured Move: If breaks above 2,060, target = 2,300+ (height of triangle added to breakout point)
Volume Watch: Need strong volume on breakout for confirmation
Disclaimer: For educational purposes only. Not SEBI registered.
$SHOP: A 4-Year Pattern Breakout Before EarningsWith the AI bubble looking frothy, investors are hunting for the next big rotation. The consumer holiday play looks like the perfect switch, and all eyes are on $SHOP.
This is looking like a clean breakout from a massive 4-year rounding bottom—a pattern this big is a major deal.
The setup couldn't be more critical:
• Catalyst: Earnings are tomorrow (Nov 4) pre-market.
• Sector: AMZN just hit a record high. The e-commerce holiday season is the clear narrative right now.
• History: SHOP has a strong track record of beating revenue estimates for the last two years.
• Momentum: The stock is already up over 60% YTD and the RSI is high, showing strong buying interest.
• High Beta: The stock's beta is over 3.5. This thing is built to move on a catalyst.
You have a long-term technical break, a major sector rotation, and a huge earnings catalyst all hitting at the same time. This is a powerful combination. Watching this one very, very closely today.

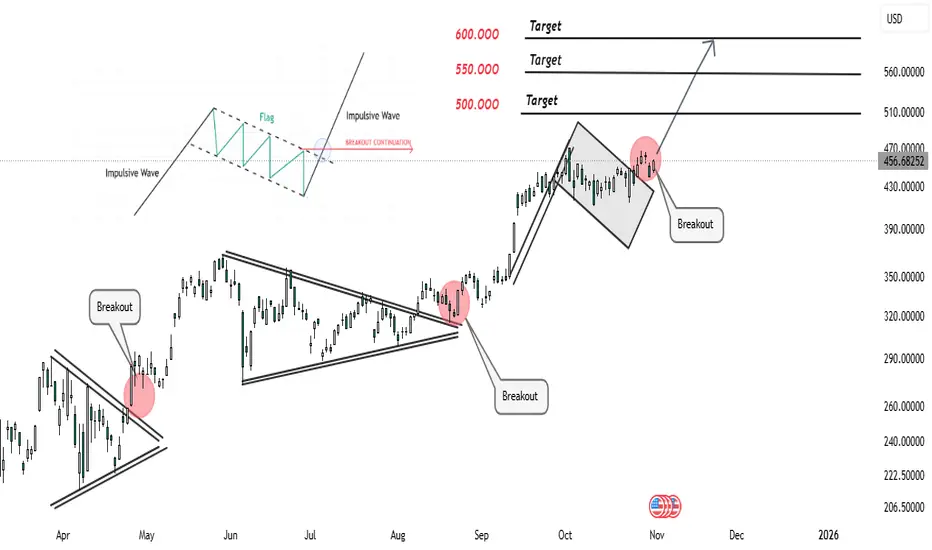
TSLA-Bullish Flag Breakout Signaling Next Impulsive Wave TowardTesla (TSLA) continues to follow a classic impulsive–corrective wave structure, showing clear signs of bullish continuation.
After each impulsive leg, price forms a consolidation pattern — such as a triangle or flag — allowing the market to gather liquidity before the next breakout.
The recent flag formation represents healthy price compression within a bullish trend, suggesting buyers are still in control.
A confirmed breakout above the flag’s resistance line indicates renewed momentum and potential for another impulsive wave targeting the 500–600 USD range.
From a technical perspective, this structure reflects:
Impulse → Correction → Impulse market rhythm.
Breakouts aligning with volume expansion and momentum continuation.
Higher highs and higher lows, confirming trend strength.
Traders can watch for price stability above the breakout level to confirm continuation. However, failure to hold above that zone may trigger a short-term pullback before the next move up.
🟢 Trend Bias: Bullish continuation
📈 Market Structure: Impulsive–Corrective wave pattern
🎯 Targets: 500 – 550 – 600 USD
📅 Outlook: Medium-term bullish momentum
LTC - GREAT Potential : ALT for 2026Hello Traders 📈
LTC / Litecoin may still present great opportunities for 2026.
From a bigger perspective, it may seem like LTC doesn't move much. But if we zoom in, we see massive bounces over the course of 3-4 weeks which presents big opportunities if you can buy in low:
From a technical indicator perspective, in the 4h LTC is still trading UNDER< showing that bears are still in control:
In the daily, we still see the same story however there seems to be a bullish W pattern appearing. As soon as the price reclaims the MA in the DAILY timeframe , that would be the first positive indicator of more upside:
For the short term, we need to see LTC trade ABOVE ALL the 4h moving averages in order to begin anticipating a bigger move up.

GOLD (XAU/USD): Bulls Eye $4,125 – Breakout Imminent?Gold dropped to a significant horizontal support level last week.
The price subsequently rebounded from this level, forming a rising triangle pattern on a 4-hour timeframe.
The neckline of this triangle is defined by an intraday horizontal resistance.
Its bullish violation (4H candle close above) can be a nice trigger to buy Gold with a confirmation.
Should this occur, a bullish continuation towards 4125 would be anticipated.
Conversely, a bearish movement and a break below the vertical support level could potentially lead to a further decline in price.

DIS | A Possible Bull Flag On Disney | LONGThe Walt Disney Co. engages in the business of international family entertainment and media enterprise. It owns and operates television and radio production, distribution and broadcasting stations, direct-to-consumer services, amusement parks, and hotels. It operates through the following business segments: Disney Entertainment, ESPN, and Disney Parks, Experiences, and Products. The company was founded by Walter Elias Disney on October 16, 1923 and is headquartered in Burbank, CA.


Amazon (AMZN): Ready for a New Breakout!Amazon isn’t just delivering packages — it’s delivering earnings surprises and a chart breakout too! 😎
After reporting strong Q3 earnings on 30 Oct 2025 , AMZN’s chart popped with a clean cup & handle breakout on 31 Oct 2025 — just in time for a bullish Halloween rally 🎃🐂
💰 Earnings Highlights :
Revenue : Came in above expectations, boosted by AWS and advertising growth.
EPS : Beat market estimates, showing stronger profitability.
Operating cash flow : Improved significantly — partly thanks to deferred tax effects — giving Amazon more room for CapEx and expansion.
☁️ AWS Power :
AWS continues to lead the way with steady growth and improved margins. Analysts expect momentum to carry into Q4 2025 , supported by rising demand for cloud and AI-driven services.
📊 Technical View :
The chart shows a classic cup & handle breakout — volume confirmation looks solid, suggesting potential continuation into year-end.
🔥 My Take:
When strong fundamentals meet a clean technical setup, that’s where the magic happens. Amazon might just be brewing a latte-fueled rally into Q4 ☕🚀

TAO / USDT gaining momentum- Eyes on $700-$750 zoneTAO is looking strong and showing good momentum for a bullish rally towards the $700 – $750 range in the coming days.
Trend structure remains positive — watch for continuation signals and manage risk wisely.

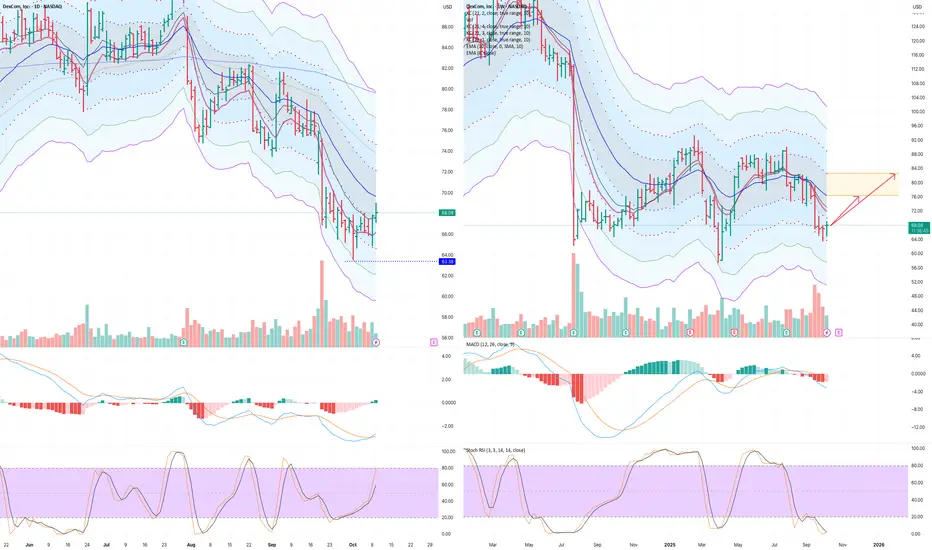
Bullish divergence + finger pattern Weekly DXCM (Dexcom)Bullish divergence incl finger pattern on weekly.
Also support has been tested and stochastic RSI maximally oversold. I expect this to turn up
TP1
76,8
TP2
82,62
Entry
68,08
SL
63,49
R/R TP1
1.9
Trade #00013
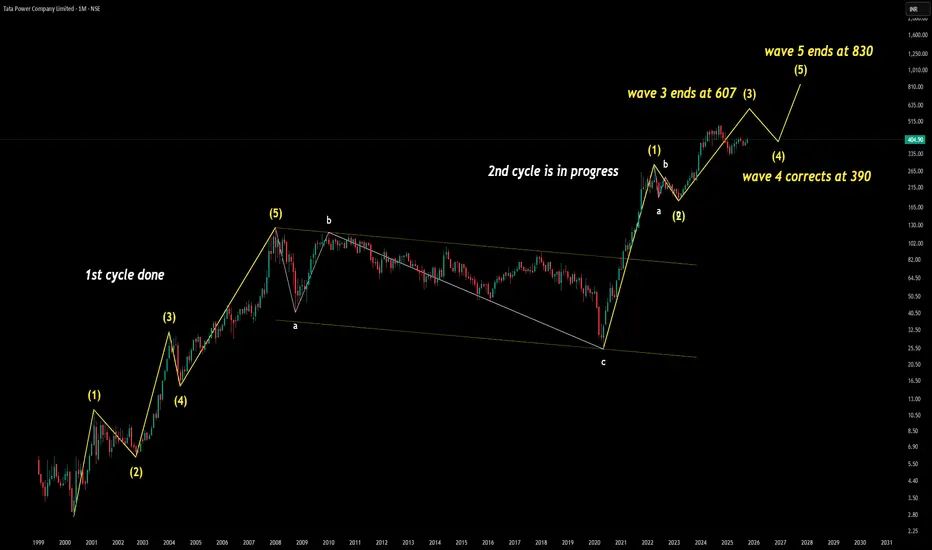
2 Elliot Wave Cycle candidate 1st Cycle – Completed
Impulse Waves: (1) → (5)
Corrective Waves: A → B → C
Classic wave symmetry with post-correction breakout
2nd Cycle – In Progress
Wave (1) and (2) formed strong base
Wave (3) extended sharply, ends at 607
Wave (4) correction expected near 390
Wave (5) projected target: 830+
Analyst Learning Takeaways
Wave 3 typically shows strongest momentum—confirmed here with a sharp rally to 607
Wave 4 often retraces 38–50% of Wave 3, making 390 a logical support zone
Wave 5 tends to mirror Wave 1 or exceed it if sentiment and volume align
Analyst View The current wave structure suggests a healthy impulsive cycle with textbook symmetry. Wave 3 has shown strong directional conviction, and the expected Wave 4 correction toward 390 aligns with Fibonacci retracement norms. If price stabilizes above 390, it confirms buyer strength and sets the stage for Wave 5. The projected target of 830+ is based on proportional extension logic and prior cycle behavior. This setup resembles the 2014 rally, where a similar Wave 4 held and led to a breakout. Traders should monitor volume and sentiment near 390—any breakdown below this level would invalidate the bullish continuation and call for reassessment.
GOOG | The Year of Quantum | LONGAlphabet, Inc. is a holding company, which engages in software, health care, transportation, and other technologies. It operates through the following segments: Google Services, Google Cloud, and Other Bets. The Google Services segment includes products and services, such as ads, Android, Chrome, devices, Google Maps, Google Play, Search, and YouTube. The Google Cloud segment refers to infrastructure and platform services, collaboration tools, and other services for enterprise customers. The Other Bets segment relates to the sale of healthcare-related services and internet services. The company was founded by Lawrence E. Page and Sergey Mikhaylovich Brin on October 2, 2015 and is headquartered in Mountain View, CA.

ALLCARGO MAKING STRONG BASE FOR HUGE BREAKOUT SOONAllcargo Logistics operates as a global integrated logistics solutions provider, specializing in multimodal transport, container freight stations, contract logistics, and project cargo. It plays a pivotal role in global trade, with a presence in over 180 countries.
Yes, Allcargo Logistics is showing signs of short-term strength. The stock is currently trading around 33.30, slightly above key pivot and resistance levels , a VCP pattern is emerging and waiting for full confirmation ,
- 📈 Bullish trigger: Sustained close above 33.76 (100-day EMA) with volume
- 📉 Bearish risk: Breakdown below 31.20 could invite further downside
short to mid term it may show good upside as risk and reward ratio looking good at current levels .

ZEC - SAME SETUPCRYPTOCAP:ZEC - Similar view, uptrend channel still holding.
I expect to see a final pump to grab liquidities higher, likely toward 390 - 400$.
Then we could see a strong rejection following by a double top (monthly basis).

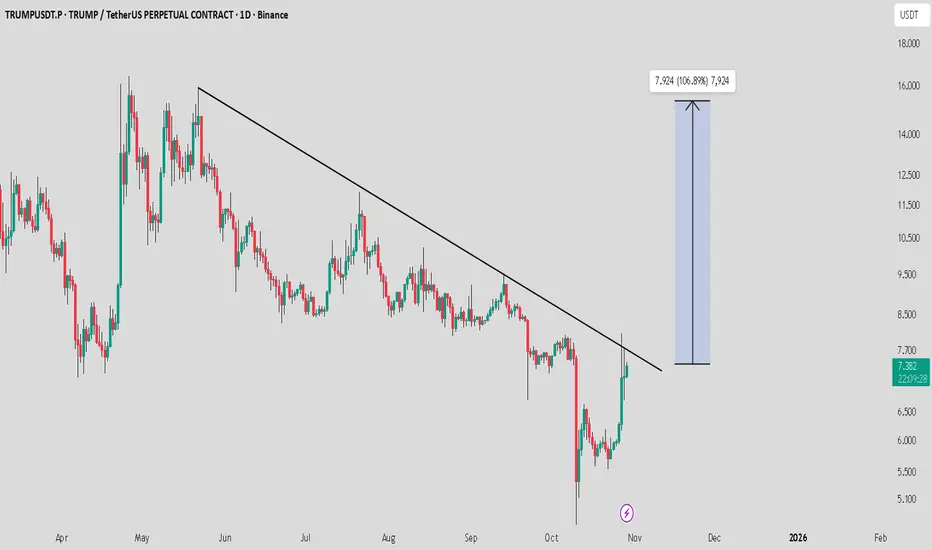
TRUMP / USDT setting up for a potential breakout moveTRUMP is looking strong for a bullish rally toward $15. Buying with lower risk may make sense at current levels.
Always manage risk wisely and wait for clear confirmation before entering.
Cookie 1H analysisCookie can provide good move on upside.
You can buy it on 1H closing above blue line.
Expected targets are given on chart.
DYOR NFA

MAKE or BREAK for Ethereum: New ATH or Epic SHAKEOUT?This week is shaping up to be ABSOLUTELY CRUCIAL for ETHEREUM!
Low Exchange RESERVES are still drawing in investors like moths to a flame. But hold on—something feels OFF the table here.
The news is glaringly OBVIOUS to everyone: rate cuts, QE, trade deals, and all those technical factors screaming "bull run ahead." But in crypto, when EVERYONE knows something, it rarely plays out as expected. Contrarian vibes, anyone?
My gut is screaming: This will be a VOLATILE WEEK , and a SHAKEOUT is essential for a rock-solid BULL RUN in Ethereum during this cycle. Without it, hitting a new ALL-TIME HIGH could feel flimsy, leading to a HISTORICAL DUMP right after the hype fades.
Pro tip: Keep EXTRA MARGINS in your account to dodge those sneaky WHALE TRAPS.
Follow and like if this analysis fired you up! 🚀📉
