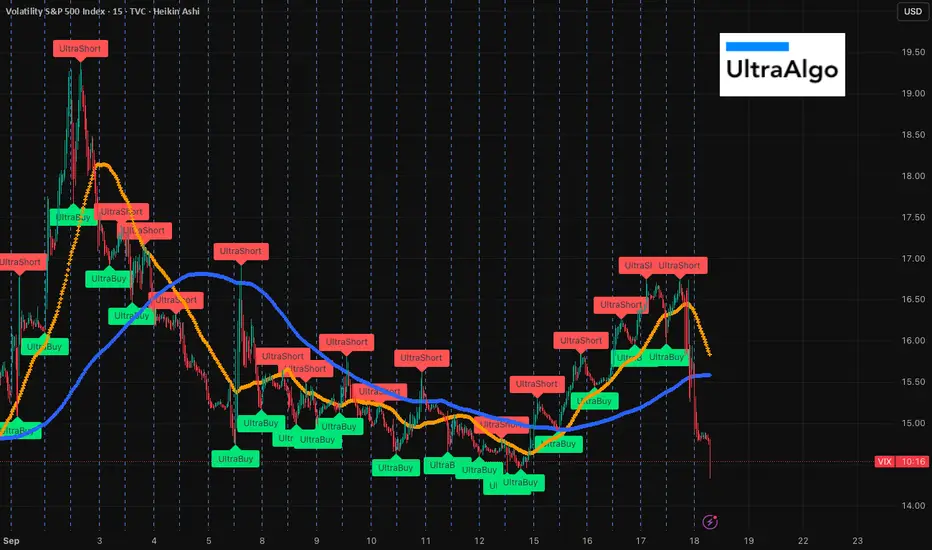
What will happen to VIX after another crappy jobs report today?While there is no crystal ball, the jobs market is beyond horrible and many precursors to a massive pullback on coming together; credit defaults, unemployment (after several revisions, each one worse than the last one), China pulling back on US based AI tech (what AI bubble?), and valuations that peak dot.com bubble. The VIX has been unnaturally low, hedge funds are shorting it!, and let's not forget volmaggedon! Could spike any second and it likely will before people get too complacent. This is a recipe for v-maggedon 2.0. Bullish on the economy, but not blind to facts and historical standards when things look very wonky. Best of luck out there! Everyone is a genius when the market is up :)
Bullishpattern
GOAT - TP4 HIT!! My lines are so accurate - 🔥🚀
#GOAT TP4 hit ✅
If prices consolidate above 0.10200$ (previous range resistance), then I expect to see another 10-15% bull move! 📈

PENGU Upside Targets🎯As long as September low is holding the Pudgy Penguins COINBASE:PENGUUSD is expected to resume the rally higher toward $0.051 - $0.058.

EURCAD
1Hour Time frame Long Call
EUR Is still strong
CAD is still weak
Resistance Broken / Retraced back to 0.618,
Bullish Momemtum
manage risk !

PEPEUSDT -the easiest way to get ur capital Tripled!Let me tell you the fastest way to triple your capital at the beginning of 2026.
The CRYPTOCAP:PEPE chart looks extremely tempting right now, and since it’s one of the coins with insane price action, you really don’t want to miss this opportunity.
On the 3D timeframe , PEPE has formed a symmetrical triangle three times already—just like the one you see here—and every single time it broke out, it did so with a massive green candle that gave no chance for late entries or deep pullbacks.
Another key point: PEPE is currently in a consolidation range very similar to the one it had in 2024 before its explosive rally. But this time, the accumulation has lasted over 550 days, which makes it even stronger.
Now, here’s the real kicker—the part I’ve highlighted in green for you. If you look closely, you’ll notice that before every major breakout, the EMA 25 and EMA 50 always squeezed tightly together. That exact setup is happening again right now.
PEPE is sitting on strong support, inside a long consolidation range. Don’t miss it. Mark my words: a 3x from here is an easy target by the end of 2025.
Best Regards:
Ceciliones🎯

Bitcoin trend reversal done ? It is quite evident from the previous plan that we have faced trend reversal for bitcoin. We had a classic breakout followd by retest , consolidation and pumps. Bitcoin had been dumping for a while now and it we were expecting something like this in the near time .
Bitcoin is currently targeting 117k2 followed by 119k4 and 123k resistance for now.
A candle close below 115k will invalidate the bullish bias.
We have also shared a lot of altcoins trade along with the Btc view on our app.
Dont forget to check out ........

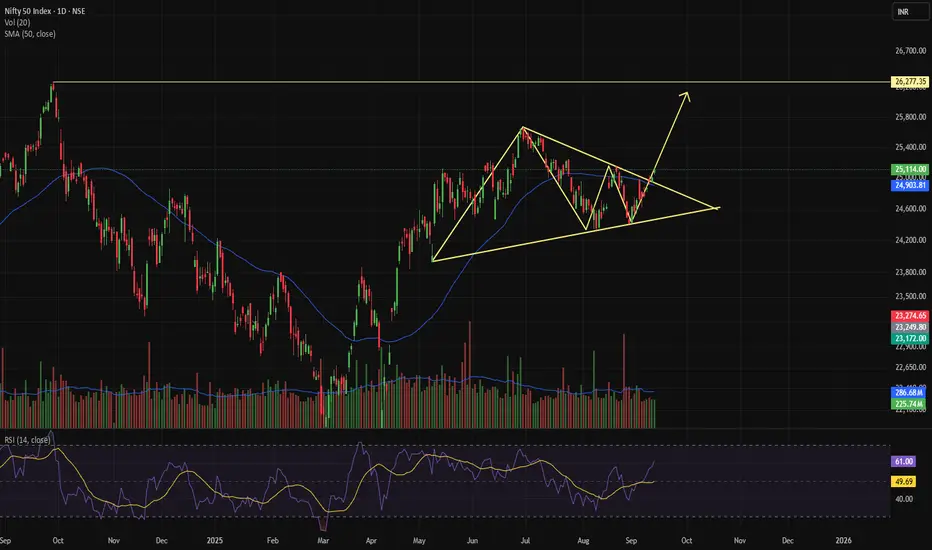
NIFTY- READY FOR UP MOVE CONFIRMATION OF TRIANGLE PATTERNThe daily candle closed above the triangle pattern, indicating a potential upward move, and the RSI index is currently at a value of 61. The first target may be the 25,650 level, while the second target could be the 26,250 level. The market is also finding support at the 50 DSMA, which reinforces the triangle pattern.
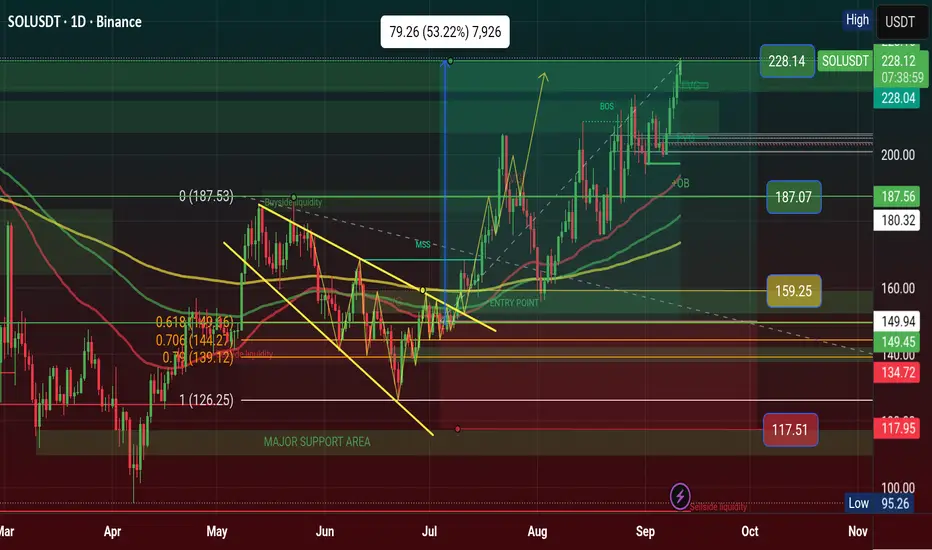
$SOL Finally hit $228 and My Prediction is Done CRYPTOCAP:SOL Finally hit $228 and My Prediction is Done, Next week if Retest and Breakout it will be $333 price in 2026 of Q1, Solana will Archived the price when we are HOLD.
From News, Solana Climbs to $225 as Analysts Predict Strong Year-End 2025 - 2026 Prediction price will hit $333 1st Quarter.
Solana surged to a seven-month high this week, touching nearly $225 as demand from institutions and speculation around ETFS lifted momentum. The token is up 25% in the past month, marking the best performance among the top 10 crypto assets.
Digital asset treasuries have been steadily accumulating Solana throughout 2025. Firms such as Upexi and DeFi Development Corp. each disclosed holdings of over $400 million in the token since January. Forward Industries added fuel to the trend earlier this week, announcing a $1.65 billion private investment in public equity to establish a Solana treasury. The plan, spearheaded by Multicoin Capital's Kyle Samani, could create the largest publicly traded SOL treasury if executed.
ETF applications tied to Solana are also awaiting SEC decisions. Issuers including Bitwise, Canary Funds, and 21Shares have filed proposals, while analysts expect approvals on CRYPTOCAP:SOL , CRYPTOCAP:XRP , and Dogecoin ETFS
sometime in 2025. Market research platforms have taken note of the shifting sentiment. Prediction markets on Myriad now give Solana a 57% chance of reaching a new all-time high this year, up from 23% just weeks ago.
Despite trading about 24% below its January peak of $293.31, Solana's rally has made it one of the strongest performers among major assets. Hougan emphasized that the relative size of Solana compared to Bitcoin and Ethereum means even modest ETF inflows could have an outsized effect on price.
He estimated that Forward's planned treasury allocation, if fully executed, would be equivalent to a $33 billion purchase in Bitcoin terms. With Solana at $221 at press time, investors are closely monitoring whether ETF approvals and treasury expansion will drive the next leg upward.
#Write2Earn #BinanceSquareFamily #Binance #SOL #SUBROOFFICIAL
Disclaimer: This article is for informational purposes only and does not constitute financial advice. Always conduct your own research before making any investment decisions. Digital asset prices are subject to high market risk and price volatility. The value of your investment may go down or up, and you may not get back the amount invested. You are solely responsible for your investment decisions and Binance is not available for any losses you may incur. Past performance is not a reliable predictor of future performance. You should only invest in products you are familiar with and where you understand the risks. You should carefully consider your investment experience, financial situation, investment objectives and risk tolerance and consult an independent financial adviser prior to making any investment.
Bullish Divergence on DTF.
Bullish Divergence on DTF.
Important Resistance is around 52.50
However, sustaining this level will
expose 55 - 60 zone.

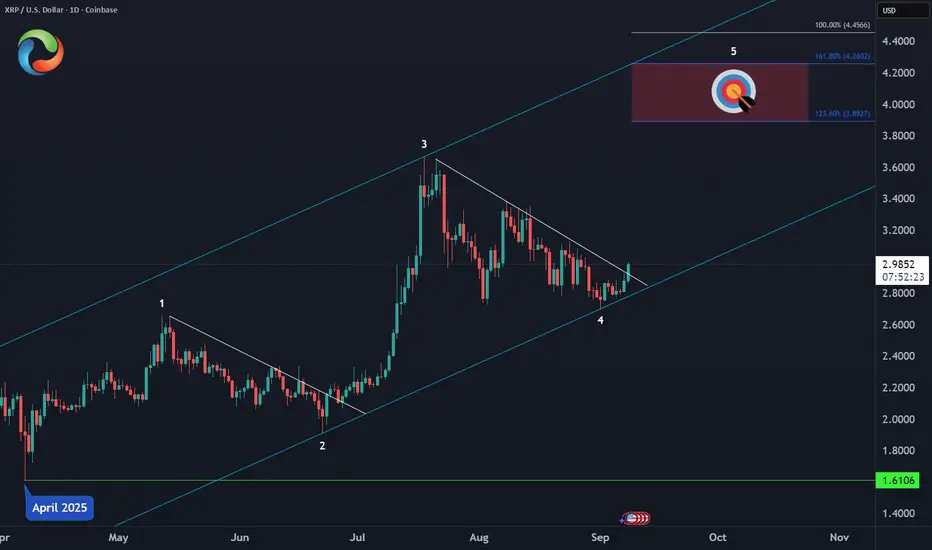
XRP – Next Upside Target🎯 CRYPTO:XRPUSD is poised to resume its impulsive cycle from the April 2025 low, with the minimum extension for wave 5 targeting the $3.89–$4.26 zone.
Structure remains constructive as long as price holds above the recent low, with potential for continuation in the coming sessions.
SOL / USDT : Trading near trendline resistance with potentialSOL/USDT (2H timeframe) is trading near trendline resistance with strong potential.
If price breaks above this resistance, we could see a rally toward $220.
If it fails to break, this setup will be invalid.
Keep it on your radar and always wait for confirmation before entering.

NEAR – Double Correction Setup Near Protocol CRYPTO:NEARUSD is currently pulling back from its July peak, unfolding within an #ElliottWave Double Three (WXY) structure.
Price is now approaching the equal legs zone at $2.26–$2.07, a key area where a bounce is expected this month.

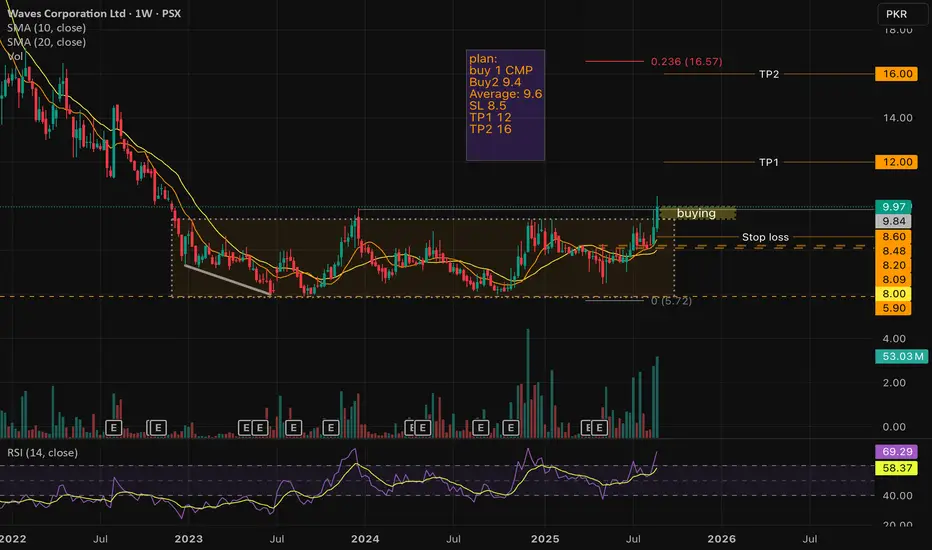
Waves Corporation Ltd (PSX: WAVES) – Weekly Chart BreakoutWaves has finally broken out of a long consolidation zone with strong volume confirmation. Price closed at 9.97 (+10.29%), above both the 10 SMA (8.48) and 20 SMA (8.00).
📌 Trading Plan:
Buy 1: CMP
Buy 2: 9.4
Avg Entry: 9.6
Stop Loss: 8.5
TP1: 12
TP2: 16
📊 Observations:
RSI at 69.29, approaching overbought but still room to run.
Weekly breakout after 2+ years of sideways action.
Strong volume spike supports bullish momentum.
⚠️ Risk management is key: Protect with SL below 8.5.
Gulf Oil Lubricants in BULLISH FLAG Gulf Oil Lubricants
Looks good for long term.
If reqd can start accumulating from current level and down till the mentioned level in the chart.
It is in Bullish Flag Pattern formation. On Breakout confirmation, big rally expected.
Good Dividend payer too

To Whom It May Concern.....Short then LongAn easy grab for the duckets..$$$
You tell me?! I have been on this stock for a minute and have a rhythm that's looking like smooth sailing.
"Gold’s Critical Bounce Zone – Is $3,400 the Next Magnet Level?""Gold’s Critical Bounce Zone – Is $3,400 the Next Magnet Level?"
📊 XAUUSD is showing a textbook bullish structure setup after forming a Higher Low right above strong support at $3,339. Price is now trading inside the Entry Zone ($3,348 – $3,339), an area that aligns with:
✅ Order Block Support
✅ Previous Break of Structure (BOS)
✅ Smart Money Fair Value Gap (FVG) retest
🧐 Market Structure Insight
Recent BOS flipped bias to bullish after buyers pushed through prior resistance.
A bullish FVG from earlier in the trend still holds influence, attracting price back for a healthy retest.
The current Higher Low shows buyers stepping in early, maintaining upward momentum.
Strong resistance is located at $3,400 – $3,440, which also acts as a psychological magnet for traders.
🎯 Trade Plan (Educational Example)
Entry Zone: 3,348 – 3,339 📍
Stop Loss: below 3,339 🛑
Target 1: 3,380 🎯 (partial profits)
Target 2: 3,400 ⭐ (main target)
Extended Target: 3,420 – 3,440 💎
📈 Reward to Risk: ~1.6R to the main target, with potential 2.9R to extended resistance if momentum accelerates.

Bitcoin Manipulation or Opportunity? Watch This Zone!⚡ Bitcoin Manipulation or Opportunity? Watch This Zone!
The chart highlights significant liquidity zones, BOS (Break of Structure), and liquidity sweeps, pointing to how price action is driven by institutional order flow.
🔎 Key Observations:
Break of Structure (BOS): Multiple BOS points confirm shifts in market direction as price transitioned from bearish → bullish → bearish again.
Liquidity Grab: Notice how price swept liquidity around previous support before reversing—classic manipulation to trigger stop losses before a move higher.
Downtrend Liquidity Channel: Price followed a controlled bearish liquidity channel after rejecting the resistance zone at 120,000 – 123,000, showing distribution.
Liquidity Sweep (Latest Move): The recent sweep near 108,000 suggests that sellers were trapped, providing liquidity for potential buy-side movement.
Projection: Based on the liquidity sweep, a rebound toward 116,000 – 118,000 is anticipated ⭐. However, interim resistance at 112,000 must be broken and retested to confirm bullish continuation.
⚠️ Risk Note: If price fails to hold above the liquidity sweep zone, a deeper correction could occur.
📌 Conclusion:
BTCUSD is showing signs of a bullish reversal after liquidity manipulation. Traders should watch for confirmation above 112,000 to target the 116,000 – 118,000 range, aligning with smart money concepts.

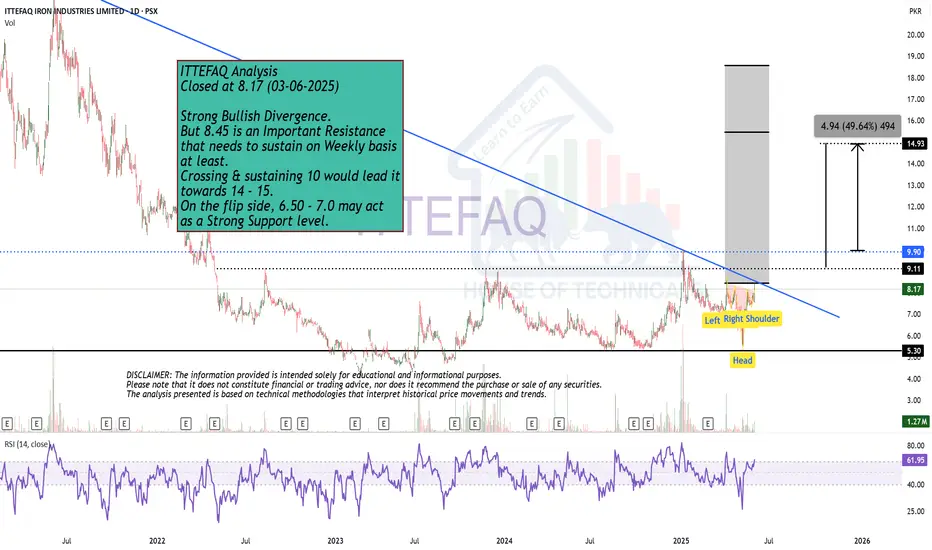
Strong Bullish Divergence. Closed at 8.17 (03-06-2025)
Strong Bullish Divergence.
But 8.45 is an Important Resistance
that needs to sustain on Weekly basis
at least.
Crossing & sustaining 10 would lead it
towards 14 - 15.
On the flip side, 6.50 - 7.0 may act
as a Strong Support level.
CADJPY Bullish After CADJPY broke the trendline and the 20 sma is holding it up, it is now in a consolidation.
We will look to enter as soon as it breaks the consolidation to the upside.

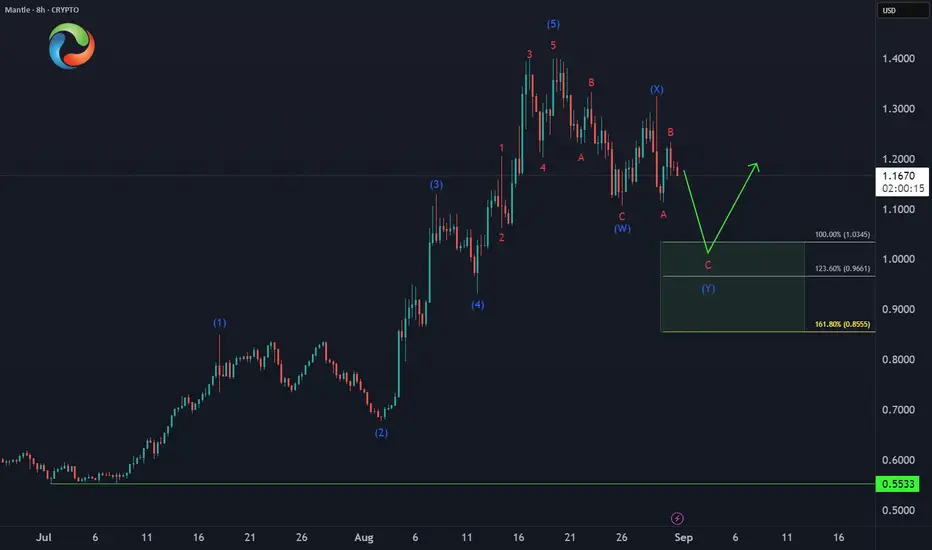
MANTLE Next Buying Opportunity Setting Up📊 CRYPTO:MNTUSD is unfolding a double three correction, and if price reaches the equal legs zone at $1.03–$0.85, it could offer a high-probability entry for the next bullish leg.
ChainLink – Double Correction 🚨 CRYPTO:LINKUSD recent 3-wave bounce failed to hold, signaling the start of a double three corrective structure. Price now appears to be heading toward the equal legs zone at $21–$18, where buyers are likely to step in for a stronger reaction.
Let price complete the pattern. No need to rush the entry.

Cardano – Next Buying Opportunity Setting Up📊 CRYPTO:ADAUSD bounce last week didn’t hold, and price action now points toward a double correction unfolding. The next key zone to watch is the equal legs area between $0.76–$0.72, where buyers could begin to step in again for a stronger reaction.

Ethereum Trading PlanCRYPTO:ETHUSD remains in corrective mode and could extend lower into early September, targeting the equal legs zone at $4022–$3627.
This area may set the stage for the next daily higher low, paving the way for a bullish resumption and a potential breakout above $5K.
Bullish Structure remains intact, let price confirm before positioning for the next leg.
⚠️ Disclaimer: This is not a recommendation to sell or short ETH. The analysis is intended as a preparation for a potential long entry, if price drops into the highlighted support zone.
