🔥📉 Falling Wedge Alert on $POLS! Bullish Reversal Brewing?Hey traders! Today, I want to bring your attention to an intriguing chart pattern on $POLS (Polkastarter). Let's dive into the falling wedge pattern and explore the potential for a bullish reversal. 📊💡
Pattern: Falling Wedge 📉🔽
Symbol: $POLS 💰
Overview:
A falling wedge is a bullish chart pattern characterized by converging trendlines, with the upper trendline sloping downward and the lower trendline sloping upward. It often signals a potential trend reversal from bearish to bullish. Now, let's analyze the falling wedge pattern on $POLS in more detail. ⚡💹
Key Features of the Falling Wedge on $POLS:
Converging Trendlines: Notice how the upper trendline connects lower highs, while the lower trendline connects higher lows. This pattern suggests a potential shift in market sentiment. 📈📉
Decreasing Volatility: Observe the gradual contraction of price range and declining trading volume as the pattern develops. These characteristics may indicate diminishing selling pressure. 📉🔻📈
Breakout Expectations:
A falling wedge pattern often precedes a bullish breakout. Traders typically await a decisive move above the upper trendline for confirmation. However, exercise caution and wait for a clear breakout before initiating trades. 🚀📈
Trading Strategy:
Entry Point: Consider entering a long position once $POLS breaks above the upper trendline of the falling wedge pattern. This breakout could signal a potential trend reversal and the start of a bullish move. ⬆️💰
Stop-Loss: Place a stop-loss order below the lower trendline to manage risk and protect against potential downside. ⛔️📉
Target Levels: Identify key resistance levels or previous swing highs as profit targets. Adjust your position size and take profits accordingly. 🎯📈
Risk Management:
Implement proper risk management techniques, including position sizing, stop-loss orders, and adherence to your trading plan. Always be mindful of the inherent risks involved in trading cryptocurrencies like $POLS. ⚠️💼💡
Disclaimer: Trading cryptocurrencies carries risks, and it is essential to conduct thorough analysis and seek professional advice before making any investment decisions.
#FallingWedge #POLS #Cryptocurrency #BullishReversal #TradingStrategy #TechnicalAnalysis #ProfitTargets #RiskManagement
In conclusion, the falling wedge pattern identified on $POLS indicates the potential for a bullish reversal. However, exercise patience and wait for a confirmed breakout before making any trading decisions. Stay tuned for further updates on $POLS! 🚀📊
(Note: This post is for informational purposes only and should not be considered as financial advice.) 💡💼📚
Bullishreversal

📉 Falling Wedge Alert on $HBAR! Potential Reversal Opportunity?Hey traders! Check out the falling wedge pattern I identified on CRYPTOCAP:HBAR (Hedera Hashgraph). Is a bullish reversal in the cards? Let's analyze and explore potential profit-taking levels! 📊💡
Pattern: Falling Wedge 📉🔽
Symbol: CRYPTOCAP:HBAR 💰
Overview:
A falling wedge pattern on CRYPTOCAP:HBAR suggests a potential trend reversal from bearish to bullish. It forms when converging trendlines indicate decreasing volatility and selling pressure. Now, let's discuss potential profit-taking levels! ⚡💹
Key Features of the Falling Wedge on CRYPTOCAP:HBAR :
Converging Trendlines: Upper trendline connects lower highs, while lower trendline connects higher lows, indicating a potential shift in sentiment. 📈📉
Decreasing Volume: Observe declining trading volume as the pattern develops, implying diminishing selling pressure. 📉🔻📈
Breakout Expectations:
A bullish breakout from the falling wedge can be anticipated. Traders often await a decisive move above the upper trendline for confirmation. Exercise patience and confirm a clear breakout before executing trades. 🚀📈
Profit-Taking Levels:
Take Profit 1: Consider booking partial profits as CRYPTOCAP:HBAR breaks above the upper trendline and reaches the first significant resistance level around $.07. 🎯💰
Take Profit 2: If the bullish momentum continues, look for the next resistance level around $0.10 as a potential profit target. Adjust your position accordingly. 🎯💰
Risk Management:
Implement effective risk management techniques to protect your capital. Set appropriate stop-loss orders below the lower trendline to mitigate potential downside risk. Adapt your trading plan as market conditions evolve. ⚠️💼💡
Disclaimer: Trading cryptocurrencies carries risks. Conduct thorough analysis, seek professional advice, and take responsibility for your investment decisions.
#FallingWedge #HBAR #Cryptocurrency #TradingOpportunity #TechnicalAnalysis #ProfitTakingLevels #BullishReversal #TradingStrategy
In conclusion, the falling wedge pattern on CRYPTOCAP:HBAR indicates the potential for a bullish reversal. Monitor the breakout and adapt your strategy accordingly. Don't forget to implement proper risk management techniques. Good luck! 🚀📊
(Note: This post is for informational purposes only and should not be considered as financial advice.) 💡💼📚

Bullish Reversal on DRIP/BUSD: Falling Wedge Pattern UnveiledGreetings, Traders! Today, I want to share an exciting technical analysis finding on the trading pair of DRIP (the DeFi protocol) and Binance USD (BUSD). A falling wedge pattern has been identified, indicating the potential for a bullish reversal in the near future. Let's delve into the details!
📈 Trading Pair: DRIP/BUSD
📅 Timeframe: Daily Chart
📊 Pattern: Falling Wedge
📉 Understanding the Falling Wedge Pattern:
A falling wedge is a bullish chart pattern characterized by converging trendlines that slope downward. Typically formed during a downtrend, it suggests diminishing selling pressure and the potential for a reversal. This pattern indicates the possibility of an upward price movement.
🔍 Identifying the Falling Wedge on DRIP/BUSD:
Upon analyzing the daily chart of DRIP/BUSD, the following observations come to light:
1️⃣ Recent downtrend: The trading pair has experienced a decline in price over the past weeks.
2️⃣ Converging trendlines: The upper trendline connects the lower highs, while the lower trendline connects the lower lows.
3️⃣ Decreasing trading volume: As the falling wedge pattern forms, the trading volume has been declining, indicating a potential reduction in selling pressure.
📈 Price Targets and Trading Strategy:
If the falling wedge pattern on DRIP/BUSD plays out as anticipated, a potential bullish breakout above the upper trendline may occur, leading to a reversal and potential price appreciation. Consider the following price targets:
1️⃣ Target 1: Resistance level near $40.00
2️⃣ Target 2: Psychological resistance near $50.00
🛡️ Risk Management:
Managing risk is essential for successful trading. Implement the following risk management techniques:
1️⃣ Set a stop-loss order below the lower trendline to protect against unexpected price movements.
2️⃣ Adjust position size based on your risk tolerance and overall portfolio management strategy.
🔔 Conclusion:
Keep a close eye on the DRIP/BUSD trading pair as it develops this falling wedge pattern. The pattern suggests the potential for a bullish reversal on the horizon. However, please note that technical analysis is not infallible, and market conditions can change rapidly. Combine this analysis with other relevant factors before making any trading decisions.
Disclaimer: This post is for informational purposes only and should not be considered as financial advice. Always conduct your own research and consult with a qualified financial professional before making any investment decisions.
Happy Trading! 📈💰
#tradingview #technicalanalysis #fallingwedgepattern #DRIP #BUSD #DeFi #cryptotrading #chartpatterns #bullishreversal #tradingstrategies #investing #finance #marketanalysis

$TOTALDEFI Identifying a Rectangle Bottom PatternHello, Traders! Today, I want to share an exciting technical analysis finding on the cryptocurrency Total DeFi ( CRYPTOCAP:TOTALDEFI ). A rectangle bottom pattern has been identified, indicating the potential for a bullish move in the near future. Let's delve into the details!
📈 Ticker: CRYPTOCAP:TOTALDEFI
📅 Timeframe: Daily Chart
📊 Pattern: Rectangle Bottom
📉 Understanding the Rectangle Bottom Pattern:
A rectangle bottom is a bullish chart pattern characterized by a horizontal price consolidation range. It signifies a period of consolidation before a potential bullish breakout. This pattern indicates the possibility of an upward price movement.
🔍 Identifying the Rectangle Bottom on CRYPTOCAP:TOTALDEFI :
Upon analyzing the daily chart of CRYPTOCAP:TOTALDEFI , the following observations come to light:
1️⃣ Price consolidation range: CRYPTOCAP:TOTALDEFI has been trading within a horizontal range, with relatively equal highs and lows.
2️⃣ Multiple touches: The price has tested the upper and lower boundaries of the range multiple times, confirming the validity of the pattern.
3️⃣ Volume analysis: Observe increasing trading volume during the breakout phase to confirm the pattern's reliability.
📈 Price Targets and Trading Strategy:
If the rectangle bottom pattern on CRYPTOCAP:TOTALDEFI plays out as anticipated, a potential bullish breakout above the upper boundary may occur, indicating a potential price appreciation. Consider the following price targets:
1️⃣ Target 1: Resistance level near $60 billion
2️⃣ Target 2: Psychological resistance near $80 billion
🛡️ Risk Management:
Managing risk is crucial for successful trading. Implement the following risk management techniques:
1️⃣ Set a stop-loss order below the lower boundary to protect against unexpected price reversals.
2️⃣ Adjust position size based on your risk tolerance and overall portfolio management strategy.
🔔 Conclusion:
Keep a close eye on Total DeFi ( CRYPTOCAP:TOTALDEFI ) as it continues to develop this rectangle bottom pattern. The pattern suggests the potential for a bullish breakout and subsequent price increase. However, please remember that technical analysis is not foolproof, and market conditions can change. Consider incorporating additional analysis and fundamental factors before making any trading decisions.
Disclaimer: This post is for informational purposes only and should not be considered as financial advice. Always conduct your own research and consult with a qualified financial professional before making any investment decisions.
Happy Trading! 📈💰
#tradingview #technicalanalysis #rectanglebottom #bullishpotential #TOTALDEFI #cryptocurrency #chartpatterns #tradingstrategies #investing #finance #marketanalysis

Reversal Potential on $XLM: Falling Wedge PatternHello, Traders! Today, I want to share an exciting technical analysis finding on the cryptocurrency Stellar Lumens ( LSE:XLM ). A falling wedge pattern has been identified, indicating the potential for a bullish reversal in the near future. Let's dive into the details!
📈 Ticker: LSE:XLM
📅 Timeframe: Daily Chart
📊 Pattern: Falling Wedge
📉 Understanding the Falling Wedge Pattern:
A falling wedge is a bullish chart pattern characterized by converging trendlines that slope downward. Typically formed during a downtrend, it suggests diminishing selling pressure and the potential for a reversal. This pattern indicates the possibility of an upward price movement.
🔍 Identifying the Falling Wedge on LSE:XLM :
Upon analyzing the daily chart of LSE:XLM , the following observations come to light:
1️⃣ Recent downtrend: LSE:XLM has experienced a decline in price over the past weeks.
2️⃣ Converging trendlines: The upper trendline connects the lower highs, while the lower trendline connects the lower lows.
3️⃣ Decreasing trading volume: As the falling wedge pattern forms, the trading volume has been declining, indicating a potential reduction in selling pressure.
📈 Price Targets and Trading Strategy:
If the falling wedge pattern on LSE:XLM plays out as anticipated, a potential bullish breakout above the upper trendline may occur, leading to a reversal and potential price appreciation. Consider the following price targets:
1️⃣ Target 1: Resistance level near $0.40
2️⃣ Target 2: Psychological resistance near $0.50
🛡️ Risk Management:
Managing risk is crucial for successful trading. Implement the following risk management techniques:
1️⃣ Set a stop-loss order below the lower trendline to protect against unexpected price movements.
2️⃣ Adjust position size based on your risk tolerance and overall portfolio management strategy.
🔔 Conclusion:
Keep a close eye on Stellar Lumens ( LSE:XLM ) as it develops this falling wedge pattern. The pattern suggests the potential for a bullish reversal on the horizon. However, please note that technical analysis is not infallible, and market conditions can change rapidly. Combine this analysis with other relevant factors before making any trading decisions.
Disclaimer: This post is for informational purposes only and should not be considered as financial advice. Always conduct your own research and consult with a qualified financial professional before making any investment decisions.
Happy Trading! 📈💰
#tradingview #technicalanalysis #fallingwedge #bullishreversal #xlm #cryptocurrency #chartpatterns #tradingstrategies #investing #finance #marketanalysis

Bullish Potential on $PYPL: Falling Wedge Pattern Greetings, Traders! Today, I'm excited to share an intriguing technical analysis discovery on the stock of PayPal Holdings Inc. ( NASDAQ:PYPL ). A falling wedge pattern has been identified, indicating the potential for a bullish reversal in the near future. Let's dive into the details!
📈 Ticker: NASDAQ:PYPL
📅 Timeframe: Daily Chart
📊 Pattern: Falling Wedge
📉 Understanding the Falling Wedge Pattern:
A falling wedge is a bullish chart pattern characterized by converging trendlines that slope downward. Typically formed during a downtrend, it suggests diminishing selling pressure and the potential for a reversal. This pattern indicates the possibility of an upward price movement.
🔍 Identifying the Falling Wedge on NASDAQ:PYPL :
Upon analyzing the daily chart of NASDAQ:PYPL , the following observations come to light:
1️⃣ Recent downtrend: NASDAQ:PYPL has experienced a decline in price over the past weeks.
2️⃣ Converging trendlines: The upper trendline connects the lower highs, while the lower trendline connects the lower lows.
3️⃣ Decreasing trading volume: As the falling wedge pattern forms, the trading volume has been declining, indicating a potential reduction in selling pressure.
📈 Price Targets and Trading Strategy:
If the falling wedge pattern on NASDAQ:PYPL plays out as anticipated, a potential bullish breakout above the upper trendline may occur, signaling a reversal and potential price appreciation. Consider the following price targets:
1️⃣ Target 1: Resistance level near $320.00
2️⃣ Target 2: Psychological resistance near $340.00
🛡️ Risk Management:
Implement the following risk management techniques to protect your capital and manage risk effectively:
1️⃣ Set a stop-loss order below the lower trendline to safeguard against unexpected price reversals.
2️⃣ Adjust position size based on your risk tolerance and overall portfolio management strategy.
🔔 Conclusion:
PayPal Holdings Inc. ( NASDAQ:PYPL ) is exhibiting a falling wedge pattern, suggesting the potential for a bullish reversal in the near future. However, please remember that technical analysis has limitations, and market conditions can change. Incorporate additional analysis and fundamental factors before making any trading decisions.
Disclaimer: This post is for informational purposes only and should not be considered as financial advice. Always conduct your own research and consult with a qualified financial professional before making any investment decisions.
Happy Trading! 📈💰
#TradingViewAnalysis #TechnicalAnalysis #FallingWedgePattern #BullishReversal #PYPLStock #StockMarketAnalysis #ChartPatterns #TradingSignals #InvestSmart #FinancialMarkets #MarketAnalysis

Falling Wedge Pattern on $BLNK: Potential Bullish Reversal Greetings, Traders! Today, I'm thrilled to share an exciting technical analysis finding on the stock of Blink Charging Co. ( NASDAQ:BLNK ). A falling wedge pattern has been identified, suggesting the potential for a bullish reversal in the near future. Let's dive into the details!
📈 Ticker: NASDAQ:BLNK
📅 Timeframe: Daily Chart
📊 Pattern: Falling Wedge
📉 Understanding the Falling Wedge Pattern:
A falling wedge is a bullish chart pattern characterized by converging trendlines that slope downward. Typically formed during a downtrend, it indicates diminishing selling pressure and the potential for a reversal. This pattern suggests the possibility of an upward price movement.
🔍 Identifying the Falling Wedge on NASDAQ:BLNK :
Upon analyzing the daily chart of NASDAQ:BLNK , the following observations come to light:
1️⃣ Recent downtrend: NASDAQ:BLNK has experienced a decline in price over the past weeks.
2️⃣ Converging trendlines: The upper trendline connects the lower highs, while the lower trendline connects the lower lows.
3️⃣ Decreasing trading volume: As the falling wedge pattern forms, the trading volume has been declining, indicating a potential reduction in selling pressure.
📈 Price Targets and Trading Strategy:
If the falling wedge pattern on NASDAQ:BLNK plays out as anticipated, a potential bullish breakout above the upper trendline may occur, leading to a reversal and potential price appreciation. Consider the following price targets:
1️⃣ Target 1: Resistance level near $40.00
2️⃣ Target 2: Psychological resistance near $45.00
🛡️ Risk Management:
Effective risk management is crucial for successful trading. Implement the following risk management techniques:
1️⃣ Set a stop-loss order below the lower trendline to protect against unexpected price movements.
2️⃣ Adjust position size based on your risk tolerance and overall portfolio management strategy.
🔔 Conclusion:
Keep a close watch on Blink Charging Co. ( NASDAQ:BLNK ) as it develops this falling wedge pattern. The pattern suggests the potential for a bullish reversal in the near future. However, please note that technical analysis is not infallible, and market conditions can change rapidly. It's advisable to incorporate additional analysis and fundamental factors before making any trading decisions.
Disclaimer: This post is for informational purposes only and should not be considered as financial advice. Always conduct your own research and consult with a qualified financial professional before making any investment decisions.
Happy Trading! 📈💰
#tradingview #technicalanalysis #fallingwedge #bullishreversal #blnk #stockanalysis #chartpatterns #tradingstrategies #investing #finance #marketanalysis

Gold to retest its lows, reversal potentiallyGold has taken over 7 days to decline back to its lower low. I don't believe that price is prepared to push lower. I will await a re-test of the lows to indicate whether I will go long on gold at the bottom of its consolidation range. As long as price continues to decline with these indecision candles I'm under the impression that it will suddenly become bullish after a reversal candlestick retest at the low of 4H bullish engulfing confirmed.

KPRMILL - Bullish Swing ReversalNSE: KPRMILL is closing with a bullish swing reversal candle supported with volumes.
Today's volumes and candlestick formation indicates strong demand and stock should move to previous swing highs in the coming days.
The stock has been moving along the horizontal support for the past few days which is indicating demand.
One can look for a 8% to 12% gain on deployed capital in this swing trade.
The view is to be discarded in the event of the stock breaking previous swing low.
#NSEindia #Trading #StockMarketindia #Tradingview #SwingTrade
Disclaimer:
This is for educational purposes only.

AUD USD Bullish Reversal Start OANDA:AUDUSD Bullish Reversal Start in AUD USD. Bullish Divergence show some good strength is price. Price break previous L.H now move upward to break another Previous H.H

REDINGTON - Bullish Swing ReversalNSE: REDINGTON is closing with a bullish swing reversal candle supported with volumes.
Today's volumes and candlestick formation indicates strong demand and stock should move to previous swing highs in the coming days.
The stock has been moving along the horizontal support for the past few days which is indicating demand.
One can look for a 8% to 12% gain on deployed capital in this swing trade.
The view is to be discarded in the event of the stock breaking previous swing low.
#NSEindia #Trading #StockMarketindia #Tradingview #SwingTrade
Disclaimer:
This is for educational purposes only.

MHRIL - Bullish Swing ReversalNSE: MHRIL is closing with a bullish swing reversal candle supported with volumes.
Today's volumes and candlestick formation indicates strong demand and stock should move to previous swing highs in the coming days.
The stock has been moving along the horizontal support for the past few days which is indicating demand.
One can look for a 8% to 11% gain on deployed capital in this swing trade.
The view is to be discarded in the event of the stock breaking previous swing low.
#NSEindia #Trading #StockMarketindia #Tradingview #SwingTrade
Disclaimer:
This is for educational purposes only.

INGERRAND - Bullish Swing ReversalNSE: INGERRAND is closing with a bullish swing reversal candle supported with volumes.
Today's volumes and candlestick formation indicates strong demand and stock should move to previous swing highs in the coming days.
The stock has been moving along the horizontal support for the past few days which is indicating demand.
One can look for a 8% to 12% gain on deployed capital in this swing trade.
The view is to be discarded in the event of the stock breaking previous swing low.
#NSEindia #Trading #StockMarketindia #Tradingview #SwingTrade
Disclaimer:
This is for educational purposes only.

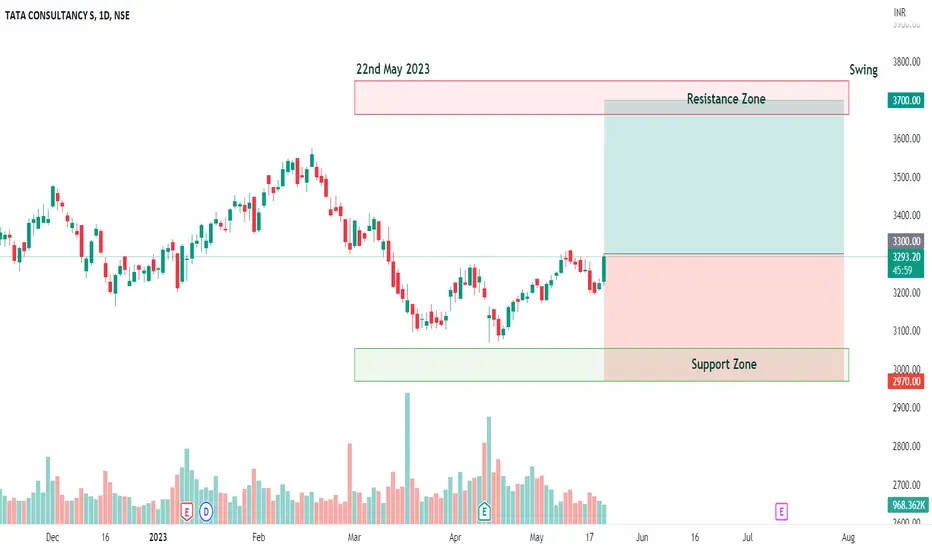
TCS - Bullish Swing ReversalNSE: TCS is closing with a bullish swing reversal candle supported with volumes.
Today's volumes and candlestick formation indicates strong demand and stock should move to previous swing highs in the coming days.
The stock has been moving along the horizontal support for the past few days which is indicating demand.
One can look for a 8% to 12% gain on deployed capital in this swing trade.
The view is to be discarded in the event of the stock breaking previous swing low.
#NSEindia #Trading #StockMarketindia #Tradingview #SwingTrade
Disclaimer:
This is for educational purposes only.
AUDUSD- Bullish ReversalFX:AUDUSD
Current Trend
AUDUSD is in Bearish Trend.
A Bullish Divergence can be seen with Double bottom indicating a bullish reversal. If the trend breaks the neckline of previous LH , It will go Bullish.
Entry to be taken at the neckline with stop loss defined at previous LL.
Risk Percentage : 2%

PGHL - Bullish Swing ReversalNSE: PGHL is closing with a bullish swing reversal candle supported with volumes.
Today's volumes and candlestick formation indicates strong demand and stock should move to previous swing highs in the coming days.
The stock has been moving along the horizontal support for the past few days which is indicating demand.
One can look for a 8% to 11% gain on deployed capital in this swing trade.
The view is to be discarded in the event of the stock breaking previous swing low.
#NSEindia #Trading #StockMarketindia #Tradingview #SwingTrade
Disclaimer:
This is for educational purposes only.

CADJPY - Bullish ReversalCADJPY was in Bearish run. It seems that It will go Bullish if the trend breaks at 99.835.
Analysis
A Divergence can be seen on RSI indicator. Also a double bottom reversal pattern indicates a possible reversal. To make sure, trend needs to break the previous LH and then it will rally towards estimated TPs. Entry can be taken on below mentioned parameters.
IDEA:
Buy Stop Entry : 99.835
Stop Loss : 98.610
TP 1: 101.060
TP 2: 102.268
Risk: 2%

IIFL - Bullish Swing ReversalNSE: IIFL is closing with a bullish swing reversal candle supported with volumes.
Today's volumes and candlestick formation indicates strong demand and stock should move to previous swing highs in the coming days.
The stock has been moving along the horizontal support for the past few days which is indicating demand.
One can look for a 8% to 12% gain on deployed capital in this swing trade.
The view is to be discarded in the event of the stock breaking previous swing low.
#NSEindia #Trading #StockMarketindia #Tradingview #SwingTrade
Disclaimer:
This is for educational purposes only.

METROBRAND - Bullish Swing ReversalNSE: JINDALSTEL is closing with a bullish swing reversal candle supported with volumes.
Today's volumes and candlestick formation indicates strong demand and stock should move to previous swing highs in the coming days.
The stock has been moving along the horizontal support for the past few days which is indicating demand.
One can look for a 8% to 12% gain on deployed capital in this swing trade.
The view is to be discarded in the event of the stock breaking previous swing low.
#NSEindia #Trading #StockMarketindia #Tradingview #SwingTrade
Disclaimer:
This is for educational purposes only.

APOLLOHOSP - Bullish Swing ReversalNSE: APOLLOHOSP is closing with a bullish swing reversal candle supported with volumes.
Today's volumes and candlestick formation indicates strong demand and stock should move to previous swing highs in the coming days.
The stock has been moving along the horizontal support for the past few days which is indicating demand.
One can look for a 8% to 12% gain on deployed capital in this swing trade.
The view is to be discarded in the event of the stock breaking previous swing low.
#NSEindia #Trading #StockMarketindia #Tradingview #SwingTrade
Disclaimer:
This is for educational purposes only.

AURO-PHARMA Aurobindo Pharma
Seems to be a strong buy for long term from here with at least holding for 1year from now as :
CMP 484
TGT 600-750-1100+
SL below 390 (52 week low)
TGT 600 can be seen very soon ..
Note : It's just an idea not any personal recommendation for the. Stock mentioned here.
Let's practise chart's together.
Comment any stock name to view and analyse: will love to do so .

APOLLOTYRE - Bullish Swing ReversalNSE: APOLLOTYRE is closing with a bullish swing reversal candle supported with volumes.
Today's volumes and candlestick formation indicates strong demand and stock should move to previous swing highs in the coming days.
The stock has been moving along the horizontal support for the past few days which is indicating demand.
One can look for a 8% to 12% gain on deployed capital in this swing trade.
The view is to be discarded in the event of the stock breaking previous swing low.
#NSEindia #Trading #StockMarketindia #Tradingview #SwingTrade
Disclaimer:
This is for educational purposes only.

M_MFIN - Bullish Swing ReversalNSE: M_MFIN is closing with a bullish swing reversal candle supported with volumes.
Today's volumes and candlestick formation indicates strong demand and stock should move to previous swing highs in the coming days.
The stock has been moving along the horizontal support for the past few days which is indicating demand.
One can look for a 8% to 12% gain on deployed capital in this swing trade.
The view is to be discarded in the event of the stock breaking previous swing low.
#NSEindia #Trading #StockMarketindia #Tradingview #SwingTrade
Disclaimer:
This is for educational purposes only.
