RELIANCEi Observed these Levels based on Price Action and Demand & Supply which is my own Concept "PENDAM CONCEPTS"... Please don't take any trades based on this chart/post... Because this chart is for educational purpose only not for Buy or Sell Recommendation... Thank Q
Bullishsetup

Bullish Trend this is my outlook on gold currently waiting for the four hour candle to close to determine if i will be short term selling with this pullback or the next push to my next level

BTC Analysis, Next Possible move!Btc is still bullish unless it breaks it structure (masked level) upon which I will swing short it. So far Monthly and Weekly still needs to close above previous local top otherwise this can turn into a top for BTC here. Will trade upon confirmation.

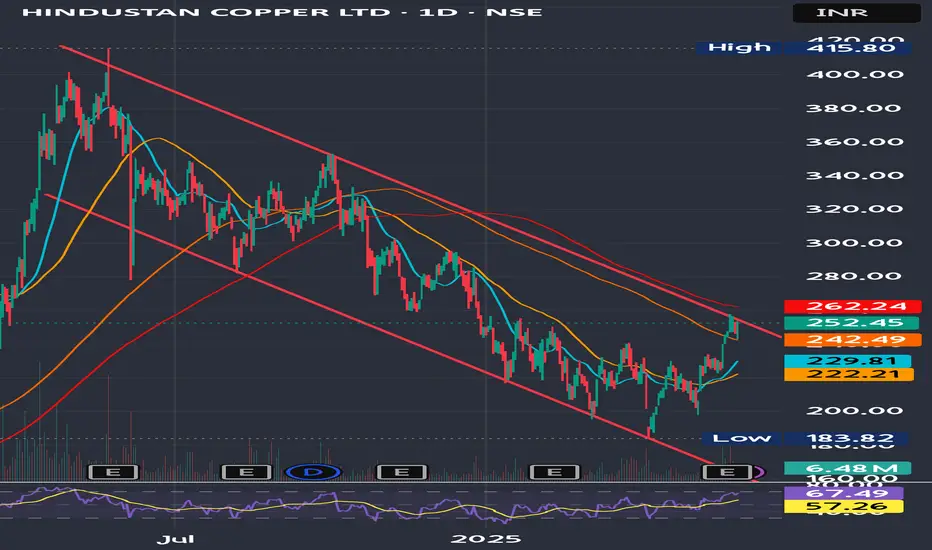
Hindcopper's Channel Breakout DueHindustan Copper Ltd. has recently garnered attention due to its strong financial performance and positive market sentiment.
Stock has broken out above key resistance around ₹240–₹245 with volume support.
Trend: Bullish
Indicators:
RSI ~67 (strong momentum)
MACD positive crossover
Above 50- & 200-DMA
Target Levels (Upside Potential)
Target Level Reason
270 Minor resistance zone (prior supply area)
292–295 Near-term swing high (Feb 2024 levels)
320+ Medium-term breakout target if momentum sustains
Stoploss Levels
Stoploss Type Level
Reason
Tight Stoploss 240 Previous breakout zone
Moderate SL 225 Near 50-day moving average
Positional SL 216 Breakdown confirmation below trend support
Buy on dips strategy around 245 -250 levels
AUDJPY Breakout Setup | Potential Long OpportunityHello Traders!
We're currently watching a textbook breakout setup forming on the AUD/JPY . After a prolonged consolidation phase, price has finally broken out of the descending trendline that has held for weeks.
🔍 Key Observations:
Consolidation Zone: Price moved sideways within a defined range, building up pressure.
Trendline Break: A clean breakout above the downtrend indicates momentum shift.
Resistance Level at 93.86: A crucial level to watch for confirmation.
Target Level: 95.62 – a significant resistance zone from previous highs.
📊 Trade Idea:
Buy above 93.86 once we see a strong retest or bullish confirmation.
Targets: 95.00 and 95.62.
Stop Loss: Below 93.30 (or as per your risk strategy).
⚠ Risk Management is Key! Always use appropriate stop losses and calculate position sizes based on your risk profile.
Let me know your thoughts below ⬇ Will AUD/JPY explode to 95.60? 🚀
#AUDJPY #Forex #BreakoutTrading #TechnicalAnalysis #TradingSetup #PriceAction

Cup and Handle Breakout in THOMAS COOK (INDIA) LTDTHOMAS COOK (INDIA) LTD is showing a classic Cup and Handle breakout pattern on the daily chart.
🔍 Chart Highlight
Breakout from the Cup's rim around ₹169.93 level.
Strong bullish candle with +7.61% gain, backed by higher volume.
Price sustained above the 200 EMA (₹163.85).
Next potential resistance: ₹197.29, a previous swing high.
Levels to Watch:
Support Zone: ₹163.85 – ₹169.93 (200 EMA + breakout retest zone)
Resistance Zone: ₹197.29 (next swing high)
If the price retests and holds above ₹169.93, it could offer a good risk-reward opportunity with ₹197+ as the near-term target. Keep an eye on volume and any pullback toward the breakout zone.
⚠️ Disclaimer:
This idea is for educational purposes only and not financial advice. Please do your own research or consult your financial advisor before making any trading decisions. Markets carry risk — trade wisely!

Fasten your seatbelts - China Southern Airlines to fly higherChina’s recent decision to grant visa-free entry to citizens of four Gulf Cooperation Council (GCC) countries—Saudi Arabia, Oman, Kuwait, and Bahrain—from June 9, 2025, is expected to significantly boost travel demand between China and the Gulf region.
Key benefits for China Southern Airlines:
> Increased passenger traffic from GCC countries for tourism, business, and cultural exchange.
> Opportunity to expand direct flight routes to major Gulf cities, enhancing its international network.
> Stronger hub positioning for cities like Guangzhou and Urumqi as gateways for Middle East–Asia connectivity.
> Improved load factors and revenue from both inbound and outbound travel, especially during peak seasons.
This policy complements earlier agreements with the UAE and Qatar, which already enjoy 30-day visa-free access, effectively making all GCC nations visa-exempt for short-term visits to China
Basis review of monthly chart, price has potential to retest level of 5.70 which is 46% upside from current level of 3.90. Price needs to breach the overhead resistance of 4 and sustain above it for multiple days for the upside momentum to kick in. However, this view is negated if price breaks below 3.20 level.

AADHARHFCi Observed these Levels based on Price Action and Demand & Supply which is my own Concept "PENDAM CONCEPTS"... Please don't take any trades based on this chart/post... Because this chart is for educational purpose only not for Buy or Sell Recommendation... Thank Q

BSOFTi Observed these Levels based on Price Action and Demand & Supply which is my own Concept "PENDAM CONCEPTS"... Please don't take any trades based on this chart/post... Because this chart is for educational purpose only not for Buy or Sell Recommendation... Thank Q

TEXRAILi Observed these Levels based on Price Action and Demand & Supply which is my own Concept "PENDAM CONCEPTS"... Please don't take any trades based on this chart/post... Because this chart is for educational purpose only not for Buy or Sell Recommendation... Thank Q

Silver (XAG/USD) | MMC Retest in Play – Eyes on $33.55 TargetThis 1-hour chart of Silver (XAG/USD) presents a clean and compelling bullish setup, applying Mirror Market Concepts (MMC) in combination with classical price action, support/resistance flips, and trendline analysis. It outlines a likely bullish continuation scenario based on how price respects key structural levels.
🧩 1. Mirror Market Concepts (MMC) Overview
MMC views the market as a symmetrical organism, where past price behavior on one side of a pattern tends to be “mirrored” on the other side. Here, we see the market reflecting previous structural behaviors through:
Symmetrical lows and highs
Balanced corrective structures
Repeatable retests of trendline support
This creates a roadmap for anticipating price reactions, especially around previously respected levels.
🔸 2. Trendline Support – Anchoring Bullish Momentum
The rising trendline is a major structural feature. It's been respected three times previously (highlighted with blue circles), providing strong bullish support.
Current price is once again approaching this trendline.
A bounce here would confirm continued higher-low structure.
If trendline is broken, it may invalidate the bullish setup — so this acts as the key decision point.
🔸 3. SR Interchange Zone (Support/Resistance Flip)
The chart marks a wide SR Interchange Zone, previously resistance, now turned into support. This flip is a critical area for accumulation and re-entry by institutional players.
Price bounced from this zone earlier.
The current structure suggests price may retest this zone again during a potential fakeout or liquidity grab.
This level is a magnet zone for stop-hunting before continuation.
🔸 4. “Type of Retesting” – MMC Style
This chart specifically labels a "Type of Retesting", which refers to a deeper liquidity sweep where:
Price breaks minor support to tap trendline or SR zone liquidity.
Then reclaims the structure and resumes the uptrend.
This is a mirror market behavior — where past retests serve as a template for future ones. Expectation is for the same type of bounce from the trendline/SR area as seen before.
🔸 5. Projected Path – Bullish Scenario
The expected flow includes:
Price dips back into the trendline + SR Interchange confluence.
Forms a higher low (marked with arrows).
Breaks minor resistance levels toward Major Resistance at $33.556.
This zone acts as the target — derived from the previous swing high and structural mirror projection.
The target zone aligns with a key Fibonacci and historical resistance level — giving extra weight to this forecast.
🔸 6. Volume and Confirmation (Trader Tip)
While volume is not shown on this chart, experienced traders would:
Watch for volume divergence or spikes near the SR zone.
Seek candle confirmation (like bullish engulfing, pin bars, or strong wicks) near the trendline/SR confluence before entering.
🎯 Trading Plan Summary:
Entry Zone: Near trendline + SR Interchange support zone.
Stop Loss: Below the SR zone or swing low.
First Target: Return to $33.20–33.30 range.
Main Target: $33.556 (marked target zone on chart).
Invalidation: Strong break and close below trendline + SR zone, with no bounce.
📘 Educational Notes (For Traders):
Trendline retests are best traded in confluence with horizontal levels.
SR flips provide high-confidence zones for reaction.
MMC adds a predictive edge by recognizing repeating behavior and structure across mirrored segments of the chart.
This setup rewards patience, especially during consolidation near major support.
⚠️ Risk Management Reminder:
Always manage risk properly. Even with high-probability setups like this, price may wick below or fake out. Wait for confirmation. Avoid over-leveraging or premature entries.

LTCUSDTThe tool watches for a strong upward move (called the flagpole).
Then it looks for a small pullback or sideways move (called the flag).

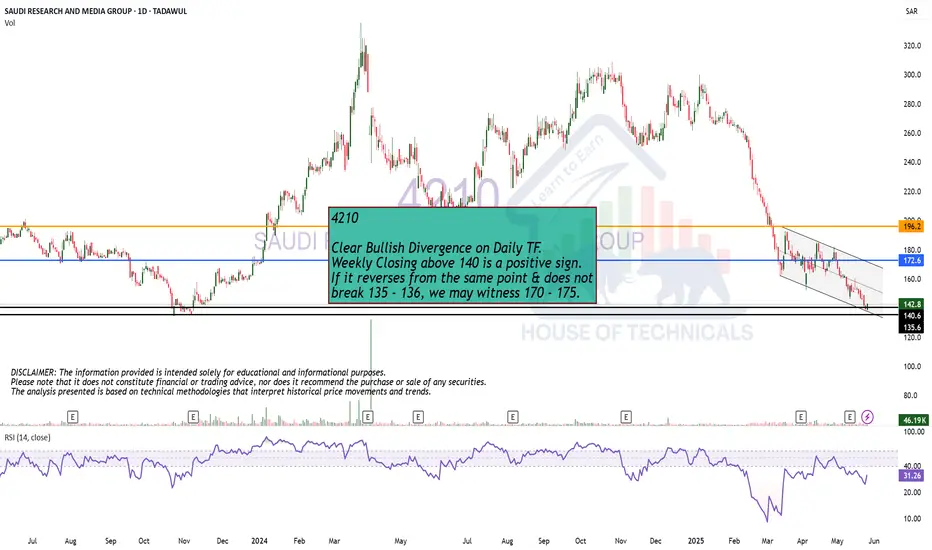
Clear Bullish Divergence on Daily TF.
Clear Bullish Divergence on Daily TF.
Weekly Closing above 140 is a positive sign.
If it reverses from the same point & does not
break 135 - 136, we may witness 170 - 175.
MARUTIi Observed these Levels based on Price Action and Demand & Supply which is my own Concept "PENDAM CONCEPTS"... Please don't take any trades based on this chart/post... Because this chart is for educational purpose only not for Buy or Sell Recommendation... Thank Q

RAY (Raydium) – Long Swing Trade Setup from Major SupportRAY is trading at a major support zone between $2.85 – $3.25, which historically has acted as a base for significant upward moves. With strong support beneath and favorable upside targets, this presents a solid long swing opportunity with clear invalidation.
🔹 Entry Zone:
$2.85 – $3.25 (key support and previous accumulation range)
🎯 Take Profit Targets:
🥇 $4.23 (previous resistance and psychological level)
🥈 $5.00 (key breakout level and round number target)
🛑 Stop Loss:
$2.84 (tight invalidation just below support zone)

Equity Research Flash – Hexaware Technologies Ltd.CMP: ₹722.35 | Bullish Momentum Post Trend Reversal
HEXT shows a bullish breakout from a falling trendline, with RSI near 60 and strong volume uptick. The price reclaimed the 0.5 Fibonacci level, eyeing next targets at ₹749.85 (0.618) and ₹793.35 (0.786). Fundamentally strong with robust revenue growth, improving ROCE (26.4%), and low debt. A move above ₹750 could trigger further upside. Accumulate on dips with SL at ₹688.
Recommendation: Positive | Buy on Dips Near ₹700
For Education Purpose only

EURUSD Trendline Breakout – Bullish Target Ahead
EURUSD has successfully broken out of a strong descending trendline, which was acting as dynamic resistance for weeks. The breakout is backed by strong bullish candles and clear higher lows forming.
After the breakout, the price also reclaimed a key horizontal support zone around 1.12573, turning it into a solid base for further upside.
🎯 Bullish Target (Expected):
First major bullish target at 1.13864 based on the 1.618 Fibonacci extension from the last swing move.
📌 Support: 1.12573
📌 Breakout Confirmation: Valid as long as price holds above the trendline and support.
📈 Outlook:
The momentum looks strong for further bullish continuation. If the price holds above the breakout zone, we expect a move toward 1.13864 in the coming sessions.

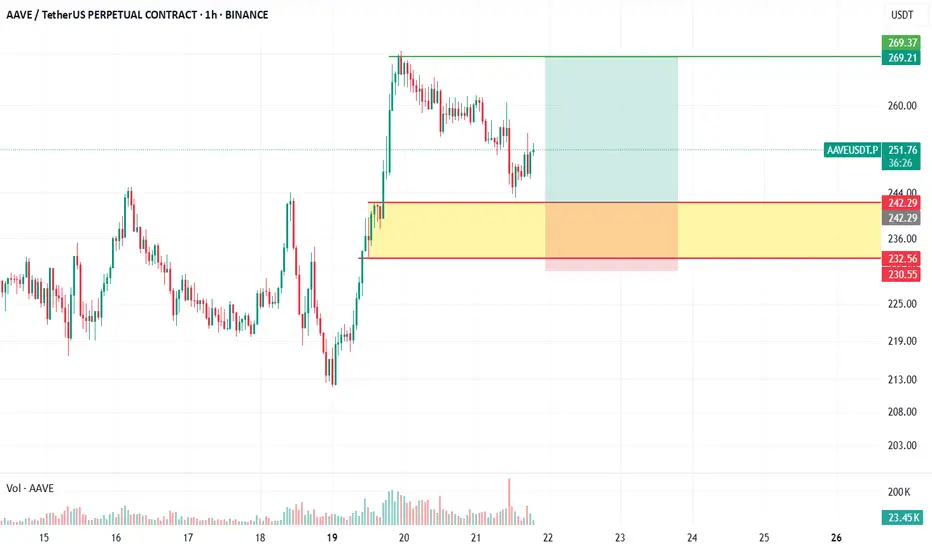
AAVEUSDT | A simple setupHi everyone, this is Dark Analysis .
Today I want to show you a simple Analysis on AAVE.
This pair is in a good bullish trend.so we have an entry on the order block shown on picture.
the momentum is good, and we have a 3-drive model here.
- SETUP
If the price reaches to this zone, I will open a buy position.
SL: 230.47
TP:269
RR:2.29
- ATTENTIONS
You can use any trigger for this trade.
Do not gamble ...
Feel free to comment your ideas.
JPY/USD Weekly Chart – Bullish Triangle Breakout Pattern Forming🔍 Chart Pattern Breakdown:
The chart is showing a symmetrical triangle pattern forming on the weekly timeframe of JPY/USD (Japanese Yen vs. US Dollar). This triangle is developing after a massive multi-year downtrend, which started all the way back in 2021. Such a triangle at the bottom of a trend often signals a potential reversal or a strong trend shift.
Here's what's happening technically:
🔺 Triangle Formation (Consolidation Phase):
Lower highs and higher lows indicate a clear symmetrical triangle.
The price has been bouncing between these converging trendlines for months.
This compression is like a spring — it’s storing energy and getting ready to break out.
The triangle pattern is nearing its apex, which means a breakout is likely soon.
📉 Previous Trend Context:
Before the triangle, the market had a strong bearish move — a downtrend that brought the pair into a major weekly support zone.
This support zone (marked in light blue) around 0.0062–0.0063 has been tested and respected multiple times.
📊 Key Technical Zones:
Support Zone: 0.0062 – 0.0063 — this is where price bounced and formed the base of the triangle.
Resistance Zone / Triangle Top: Around 0.0071 – this is the upper boundary of the triangle. A breakout above this will confirm the bullish scenario.
Target Area: 0.00829 – derived from measuring the height of the triangle and projecting it from the breakout point.
Major BOS (Break of Structure): Once price breaks above the triangle and the BOS line, it confirms a shift from bearish to bullish structure.
SL Zone: Stop loss area is just below the support zone at 0.00629 to protect against false breakouts.
🔁 Retest Setup:
After the breakout, it's common to see a pullback to retest the previous resistance (now turned support). That retest often provides a high-probability entry for swing and position traders. If it happens — that’s your golden moment!
🎯 Trade Plan (Example for Education):
Entry Criteria Value/Zone
Breakout Entry Above 0.0071 (confirmed candle close)
Retest Entry 0.0069 – 0.0070 (support flip)
Stop-Loss (SL) Below 0.00629
Target (TP) 0.00829
✅ Why This Setup Matters:
Clear structure on the weekly chart.
Multi-touch points on both trendlines = strong pattern.
Support zone backing the triangle base gives extra conviction.
A breakout from such consolidation patterns often results in sharp movements.
Risk/reward ratio is highly favorable.
⚠️ Risk Management Reminder:
Always trade with a plan, use a stop-loss, and don’t jump into the breakout blindly. Volume confirmation or retest confirmation will help increase the success rate. These kinds of setups are powerful, but only when approached with discipline.
🧠 Final Thoughts:
This JPY/USD triangle on the weekly chart is a textbook example of potential bullish reversal from a major downtrend. It’s showing signs of a structural shift, supported by strong support, tightening price action, and the chance for a breakout to deliver a major upside move toward 0.00829.
If you’re a swing or position trader, keep this on your radar. Momentum is building — don’t miss the move when the breakout hits. 📈🔥

NFP ANALYSIS🚀#NFP Analysis : Pattern Formation💲💲
🔮As we can see in the chart of #NFP that there is a formation inverse head and shoulder pattern and it's a bullish pattern. Also there is a perfect breakout and retest of the levels. This indicates a potential bullish move.📈📈
🔰Current Price: $0.0910
🎯 Target Price: $0.1100
⚡️What to do ?
👀Keep an eye on #NFP price action. We can trade according to the chart and make some profits. The price must close above the neckline. After that we will see a bullish move. ⚡️⚡️
#NFP #Cryptocurrency #TechnicalAnalysis #DYOR

EUR USD Entry Setup 1 hour timeframe EUR USD Entry Setup 1 hour timeframe
Trade Setup: Bullish break and retest
Additional Confluence: Fib Retracement Level👌🏻⬆️

Beautiful SetupClosed at 141.02 (21-02-2025)
Beautiful Bullish Divergence +
Inverse H&S in progress.
As mentioned earlier, 144 - 146 is
an immediate resistance; once crossed
& sustained, we may witness 152 - 155
& then 175 - 180.

Bullish
Closed at 34.03 (21-05-2025)
Hidden Bullish Divergence on bigger tf.
Bullish Divergence on shorter tf.
Immediate resistance is around 34 - 34.10
Crossing & Sustaining this level may exposes
upside towards 47 - 48
However, mid way, 40-41 & 44-45 are important
resistances that should not be ignored.
On the flip side, 30 - 32 are important Support levels.
and 29.80 Must not Break on Monthly Basis.
