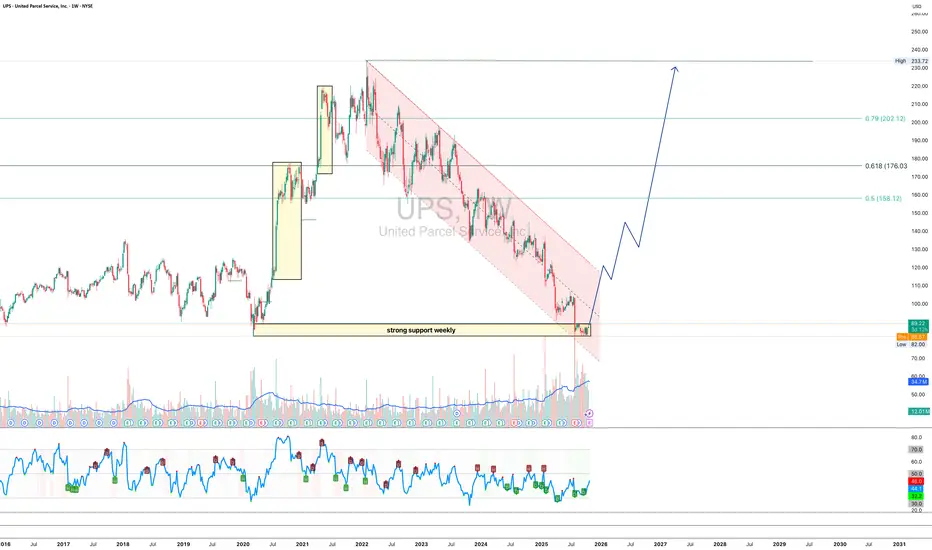
UPS 1W - delivery of a trend reversal is on the way?On the weekly chart, UPS is holding strong around the $82–90 support zone - a key level where buyers historically step in. The structure suggests the end of the long corrective channel and the potential start of a bullish reversal.
Technically, a confirmed breakout above the channel could trigger momentum toward $158, $176, and $202 - attractive targets for mid-term traders.
From a fundamental standpoint, UPS continues to streamline operations, improve automation, and prepare for peak season shipping. Growing e-commerce volumes and steady fuel costs may support stronger margins ahead. If earnings start to reflect these improvements, the stock could easily shift gears into a sustainable uptrend.
* UPS announced that it will report its Q3 results on October 28, 2025.
* The company is introducing increased seasonal charges and shipping rates starting October 26 ahead of the holiday season, which may temporarily reduce demand.
* UPS also announced plans to equip 5,000 of its trucks with air conditioning in the hottest regions of the US, a step to improve working conditions but at a cost.
* The high dividend yield (~7.5%) raises questions about sustainability, as the payout is almost equal to free cash flow.
Tactical play: as long as $82–90 holds, bulls have the initiative. Once the breakout is confirmed - the next big delivery might just be profits.
Bullishsetup
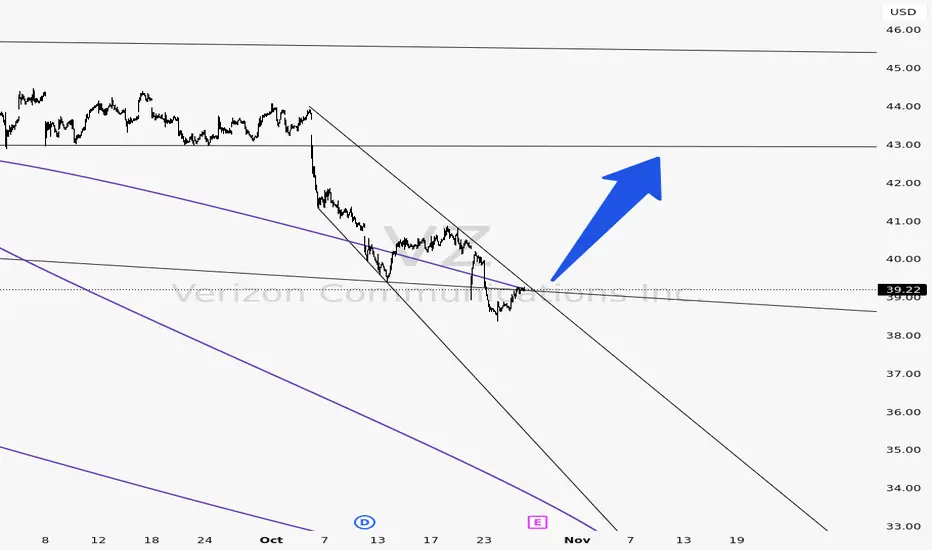
Verizon (VZ) — Bullish Reversal Setup! Smart Money Loading UpNYSE:VZ is showing early signs of a **trend reversal** after a long downtrend. The price is now testing the **upper boundary of its descending channel**, signaling potential breakout momentum.
Technicals suggest that **smart money might be accumulating** before a larger move toward the $45 range.
💎 The structure looks strong — a clean breakout and retest could confirm a new bullish leg.
Watch for volume confirmation and hold above resistance for a possible **momentum breakout**.
“They laughed when NYSE:VZ dipped. They won’t laugh when it rips.” - twitter (WallStMessiah)
👇 Drop your thoughts below — breakout or fakeout?
Disney's Possible Swing SetupHi Traders!
As I analyze Disney, I am seeing it's in a counter trend on the 24HR with a resistance at $120. I'm staying patient watching to see how far price will retrace with a 24HR CHOCH sitting at around $102.50. That seems far away, but that would help fill in some of the gap, and give a nice set up for a reversal. In addition, there are 4 days left in the current Monthly candle, and they've been closing small. IMO that could indicate that price could eventually make it to $130.
For now, I have alerts set and I'm planning to take a long swing.
Let me know what you guys think in the comments! Good luck!
*DISCLAIMER: I am not a financial advisor. The ideas and trades I take on my page are for educational and entertainment purposes only. I'm just showing you guys how I trade. Remember, trading of any kind involves risk. Your investments are solely your responsibility and not mine.*

Cookie 1H analysisCookie can provide good move on upside.
You can buy it on 1H closing above blue line.
Expected targets are given on chart.
DYOR NFA

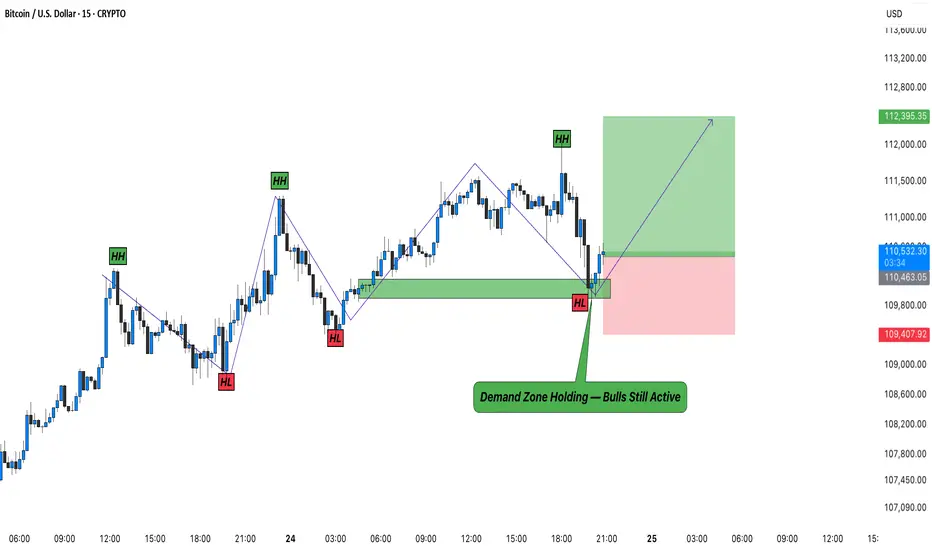
BTC – Demand Zone Holding Firm, Bulls Still in Control!Bitcoin (BTCUSD) continues to respect its demand zone around 110K–109.4K , where buyers have stepped in once again to defend the short-term structure. This area has acted as a reliable reaction point multiple times, confirming that smart money is active around this region.
Price recently dipped into the green zone and showed a quick rebound, forming a possible higher low structure. As long as BTC stays above this zone, the short-term bias remains bullish with immediate targets near 112.3K .
If the momentum continues to build, we might see another impulsive leg to the upside. However, any sustained close below 109.4K would invalidate this setup.
Remember: structure defines direction, not emotions.
Rahul’s Tip:
The best trades often form when most traders panic. Let the market test patience, not your conviction.
Disclaimer: This analysis is for educational purposes only and is not financial advice. Always trade with risk management.
VIRTUAL - BULLISH OUTLOOK! SPARKS:VIRTUAL - Ready for another leg up? 🚀
Cup & Handle H4? - To confirm breakout 💣
Uptrend looks solid, + potential daily retest is cooking! 📈
Bulls could push another 30%+ from here! 🚀
Current price 1.200$
Upper big resistances:
1.380 |1.400$
1.550
1.640
1.800
1.920
#VIRTUAL

NASDAQ: CEG — Strong Rebound from Support, Uptrend Still Intact?On the daily chart, CEG found solid support and began to rebound.
The September price action shows a clear higher high, higher low structure — confirming a healthy uptrend. The upward trendline (green) continues to act as reliable dynamic support.
In October, the stock broke above the previous horizontal resistance (red dotted line), and recent pullbacks have retested the same level as support — a classic resistance-turned-support setup.
After a successful retest of the horizontal support line — which coincides with the Fibonacci 0.618 retracement zone — the latest candle closed back above the 20-day SMA (purple), reaffirming that the uptrend remains firmly intact.
Friday’s session showed strong momentum with a gap-up and a full-bodied bullish candle, signaling renewed buying interest.
Overall, the uptrend remains valid, and this rebound from support may mark the beginning of the next leg higher.

IBRX consolidating at $2.3 with volume confirmationThe share price has tested and been holding steady around/above ~2.3 for all of 2025. Volume is showing a very obvious increase over time as shares are being consolidated at this level. Price is due for a reversal. How high? My conservative guess is it will reach at least $6.7 before the end of its upward trend.
Don't know much about the company, just going off the chart.

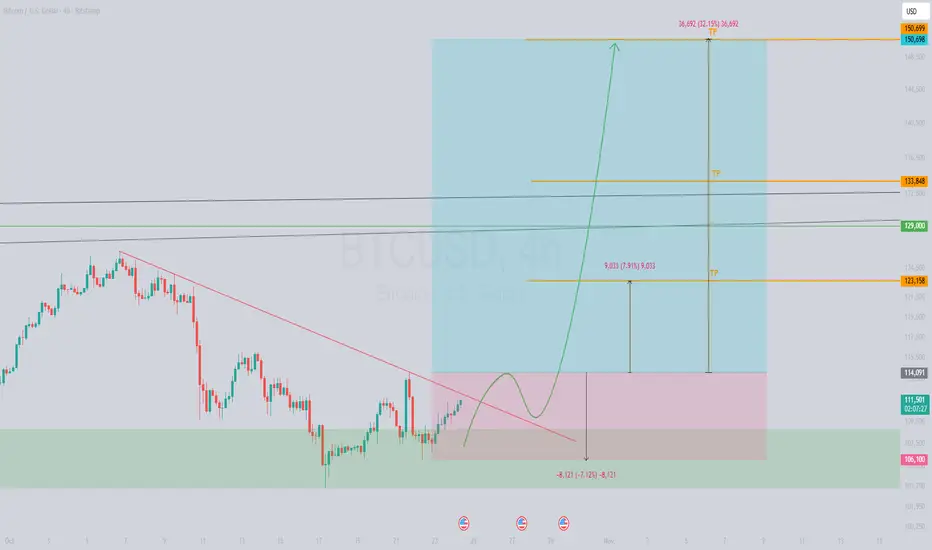
Bitcoin 4H: Ready for a Bullish Breakout to New Highs! 🚀 Bitcoin 4H: Ready for a Bullish Breakout to New Highs! 🚀
Traders, buckle up! 🔥 Bitcoin ($BTC/USD) is showing serious strength on the 4-hour chart, with buyers fiercely defending the $103,530 - $108,872 support zone. The king of crypto looks poised to kick off a fresh bullish surge toward new all-time highs! 📈
📊 Setup Highlights:
Support Zone: $103,530 - $108,872 – a rock-solid base where buyers have stepped in with conviction.
Key Trigger: Watch for a clean break above the descending trendline. This could ignite a powerful rally!
Targets: The chart lays it all out – we’re eyeing those juicy new highs. Check the marked targets for potential profit zones.
The momentum is building, and the bulls are charging! 🐂 Don’t miss this potential rocket launch to uncharted price territory.
⚠️ Disclaimer: This isn’t financial advice – always DYOR and trade with caution. Crypto is volatile, so keep your risk in check!
🚀 Epic Analysis + Signals? Follow NOW! ✅
📊 Craving a Golden Chart? Smash LIKE! ✅
💬 Got ideas? Drop a COMMENT – we reply to the best! ✅
Follow = Profits | Like = Gold Chart | Comment = VIP Access! 😎
$SOL / Solana to $300+?All things suggest a strong launch opportunity for Solana.
If $200 holds, it's a good accumulation level. RSI is at 50, in the Fibonacci Golden Zone, with a weekly demand level, and the $250 weekly resistance/supply level has been tested 3+ times.
Solana bulls have a solid chance to reach $300+ short-term, especially with potential ETF filings.

Time to load up on $BULLIf we drop below $9 from here, we could see it fall into the $7 range. The main support zone remains around $10–$12 — those are the prime loading levels. I’m still holding a $20 target by year-end.

Ethereum ETH Final Upside LegCRYPTO:ETHUSD found buyers at the equal legs support zone of $3629–$3363, triggering a bullish reaction from that area. As long as October low holds, then Price action now favors a move higher toward the next target to the upside at $5300 - $5880

RIOT – Short-Term Bullish SetupNASDAQ:RIOT completed its wave 4 pullback after attracting buyers at the #BlueBox support zone of $18.34–$17.24, and has already reacted higher from that level.
Currently, the wave ((ii)) correction is unfolding in 3 swings, reaching another equal legs area at $20.49–$19.58, where price is expected to resume the rally if support holds.

$GLW Bull FlagA high quality company within a strong uptrend. Consolidating in a bull flag as volume drops off. Earnings in one week time could be the catalyst which finally pushes this past $100 and beyond.

MLN - BULL REACTION AWAITEDCBOE:MLN , as long as price hold above 8.20$ I'll do DCA. Expecting to see another big bull reaction 📈


NASDAQ: ADI – Third Breakout Above $240 Key Resistance?NASDAQ: ADI (Analog Devices) has been consolidating for about a year and a half since May last year. During this period, the $240 level has acted as a major psychological and structural resistance zone.
Over the past year, price has tested this level three times — yet none of the weekly candles managed to close above $240, each time retreating shortly after. This showed consistent selling pressure at that zone.
In recent months, however, the price action has started to shift.
* First Breakout (June 30): ADI closed above $240 after a three-month rally, but the move lacked a proper pullback or base formation. Price failed to hold above the breakout level afterward.
* Second Breakout (August 18): A second attempt after a month of mild consolidation also failed to sustain above $240, signaling insufficient buying momentum.
* Third Breakout (October 6): Last week’s weekly candle finally closed at $242.87, about $2.87 above the key resistance, marking a third breakout attempt — and this time, the setup looks technically healthier.
The latest two weekly candles formed a clear “break and reclaim” pattern:
1. The first candle broke below the $240 level and tested the 20-week SMA.
2. The following candle reclaimed both the SMA 20 and the $240 level in one strong move.
This indicates that the market successfully retested short-term support and regained strength quickly — completing a constructive pullback within just two weeks.
In summary:
* $240 remains the key line in the sand.
* The third breakout shows stronger technical structure (with retest + reclaim).
* If price can continue holding above $240 with increasing volume, ADI could be entering a renewed uptrend phase following its long consolidation.

XPIN - ROAD TO 0.50$ NEXT ?#XPIN - Looks like another bullish breakout on 📈
Uptrend remain solid & strong --> 0.500$ next? 🎯
#XPIN #trading

EURAUD 4H – Long ideaPrice is bouncing from the lower rail of the 4H ascending channel that aligns with the weekly trendline. After a short liquidity sweep, the structure flipped bullish, and an H4 fair-value gap sits at 1.77–1.78 .
Plan: buy the pullback into the FVG ~1.774 (E: 1.77415). SL: 1.7363 —below the channel base and last swing low. TP: 1.8889 , targeting the channel top/previous supply and full FVG fill. Partial profits can be taken on the way at ~1.825/1.845 . Bias is invalidated on a daily close below 1.74 .

MUBARAK/ USDT attempting Breakout_Need confirmation for rallyMUBARAK is currently breaking out from its trendline resistance with strong potential. A successful breakout and hold above this level could trigger a short-term bullish move.
Always wait for confirmation before entering and manage risk wisely.

Bumble - Potenial Inverse H&SLooking at Bumble now and have been accumulating shares these last days. If this stock manages to break the neckline It could easily make a quick run of 100-200%.

KGEN / USDT : Looking strong for a nice bullish moveKGEN is showing strong bullish momentum and looks ready for a potential 40–50% rally in the short term.
Keep a close watch and manage risk wisely — wait for confirmation before entering.

USDJPY – Demand Zone Retest | Bullish Reversal ExpectedFX:USDJPY
🟢
Structure | Trend | Key Reaction Zones
Price is testing the yellow demand zone (150.700 – 150.400), which aligns perfectly with the ascending channel’s lower boundary.
Structure remains bullish overall — the market is simply correcting after hitting upper-trend resistance.
A strong rejection from this demand area could initiate the next impulse leg toward the 152.600–153.300 zone.
Market Overview
USDJPY has been moving within a large ascending channel structure. After a sustained rally, price began to retrace, retesting the key demand zone that acted as a previous breakout base.
Buyers are expected to defend this region for continuation higher, targeting upper-channel liquidity zones and major resistance levels.
Confirmation will come from bullish engulfing or breakout candles off the yellow zone.
Key Scenarios
✅ Bullish Case 🚀 → 🎯 Target 1 152.050 | 🎯 Target 2 152.600 | 🎯 Target 3 153.300
❌ Bearish Case 📉 → Close below 150.400 may extend downside toward 149.500 support
Current Levels to Watch
Resistance 🔴 152.050 – 152.600
Support 🟢 150.700 – 150.400
⚠️ Disclaimer: This analysis is for educational purposes only. Not financial advice.
