Paypal Looking Bullish!! Lets Go!Paypal is looking Really bullish.
Setup is Based on AMD, Accumulation, Manipulation and Distribution phase.
It has been accumulating at this price range for a while and enough Manipulation has takenplace. Now it is TIME for Distribution and hunt SL of Sellers, that is BSL.
It is not a Financial advice. It is a speculative idea that i am publishing for educational purposes.
Do your own Research.
Leave a thumbs up if you like this idea.
Bullishsetup

The Bull’s Call: HFCL Joins the Uptrend League!HFCL Technical Update (1-Hour Timeframe)
HFCL is currently moving within a well-defined parallel channel. The stock has established a strong support zone around the ₹72–74 range on the shorter timeframe, while the key resistance is observed near ₹90.
At present, the stock is trading close to the Line of Polarity (LOP). A breakout above the mid-channel level could lead the price toward its upper resistance zone.
If the support zone holds, we may witness further upside momentum in HFCL in the coming sessions.
Thank you !!!!

AIA - BULLISH ACCUMULATION ? WHOLE BOTTOM? NASDAQ:AIA look pretty good here for me.
Looks like a whole bottom & bullish accumulation forming before to see the big leg up I'm waiting for!
2$+ next?? 🚀 🎯

mrmoney limited DXY position/swing trading ideaprice has reacted from our monthly support level giving us pin bar which created a double bottom on the weekly time frame looking for mor bullish move for the time being except price reacts on our resistance level

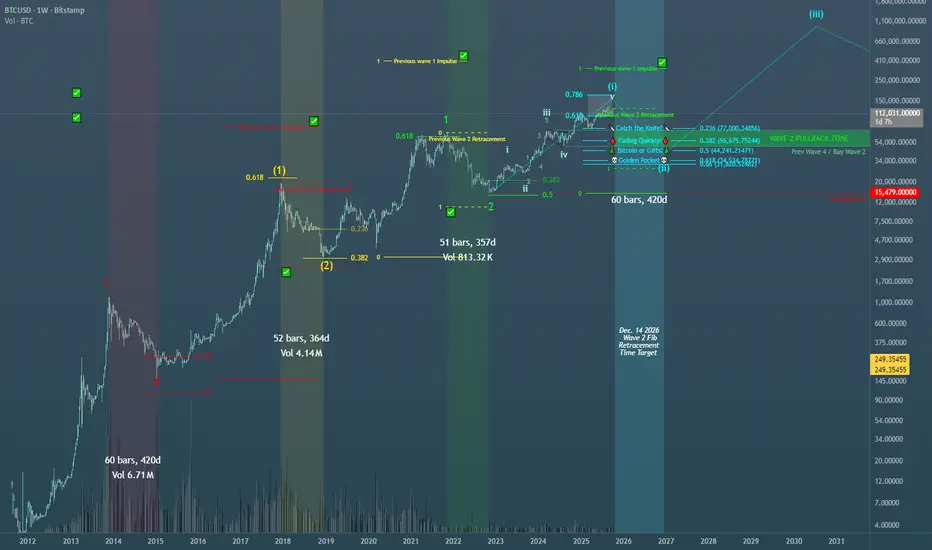
Bitcoin Multi 1,2 Elliott Wave Cycle Analysis: Wave 2 Decryption Shown on the chart is BTCUSD:BITSTAMP on the Weekly Timeframe. This is a breakdown of the Multi 1,2 Elliott Wave Scenario plotted on the chart. This is by far my most bullish scenario for Bitcoin, as we haven't even reached the main wave 3 thrust up, i know its hard to fathom BTC over 1 million dollars, but this is one way to get us beyond that.
Historically the 1,2 pattern has mimicked past 1,2 fractals, usually returning smaller gains and retracements compared to its past 1,2 structure. This is only a guideline for the 1,2 pattern and not a hard rule, although BTC has maintained the right look for this Multi 1,2 Structure throughout its cycle. We are already on the 4th 1,2 pattern continuing the bullish movement to the upside. I have this degree of trend as the final 1,2 before the wave 3 thrust up. Probabilities get lower the more 1,2s we build leading to the 3rd of 3rd of 3rd of 3rd wave thrust, this is already a dream scenario on the Weekly Timeframe, not often do we see these "Rare Unicorn" patterns play out on a HTF, but more often on <15 min TF the rare pokemon are spotted more frequently.
I have highlighted my preferred buy area for the coming wave 2 pullback. The 2nd waves have reached higher fib ratios while still remaining smaller than the previous 1,2 ratios, showing the right look between impulsive and corrective structures thus far. Considering this, wave 2 could surprise us all (MMs known for this) and retrace to the .618 - .66 Golden Pocket area, while still remaining smaller than its past 1,2 fractal. I hope someone finds this useful or at least interesting! Happy Trading
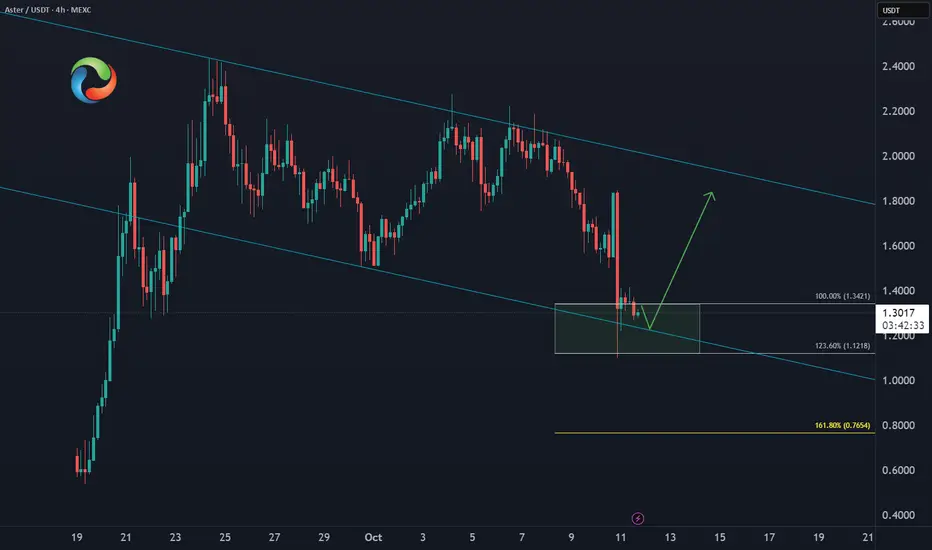
ASTER Short Term Update📊 BYBIT:ASTERUSDT Down ~50% from the highs, but the structure still screams correction, not collapse. We're seeing 3 clean swings into the equal legs zone:
🔹 $1.34 – $1.12 = key inflection area.
📈 A bounce from here is likely next week, potentially tagging the upper boundary of the downtrend channel.
But don’t get comfy, this move could be just a pause before the next decision leg.
🔹Watch for reaction, not prediction.
TAOBOT Bullish Reversal After Surviving the Crash📈 UNISWAP:TAOBOTWETH_8FE920.USD held firm at the June low of $0.20, shrugging off the recent market crash and now printing a daily bullish reversal.
🔹 Holding key support = structural resilience
🔹 A weekly confirmation could unlock momentum toward the August highs near $0.60
This setup puts TAOBOT back on the radar for trend reversal traders.

Bitcoin BTC Bullish Setup📈 CRYPTO:BTCUSD reached the equal legs area $118588 - $117260 and it's expected to rally from there looking for new highs next week or bounce in 3 waves at least.
#Elliottwave #Trading

KR price is showing signs of strength; now it just needs volumeKroger (KR) has moved into an uptrend on the daily chart, forming a higher trough followed by a higher peak. Upside momentum is improving, confirmed by a break of the downsloping trendline, while the RSI has risen above 50 — a positive sign for near-term strength.
The longer RSI holds above 50, the greater the likelihood of continued price appreciation. One area that appears lacking, however, is volume, with the OBV not yet showing a corresponding pickup in accumulation.
Nevertheless, the EMAs are aligned in a bullish formation, and if they begin to develop angle and separation alongside a firm RSI, KR’s price is likely to show further underlying strength.

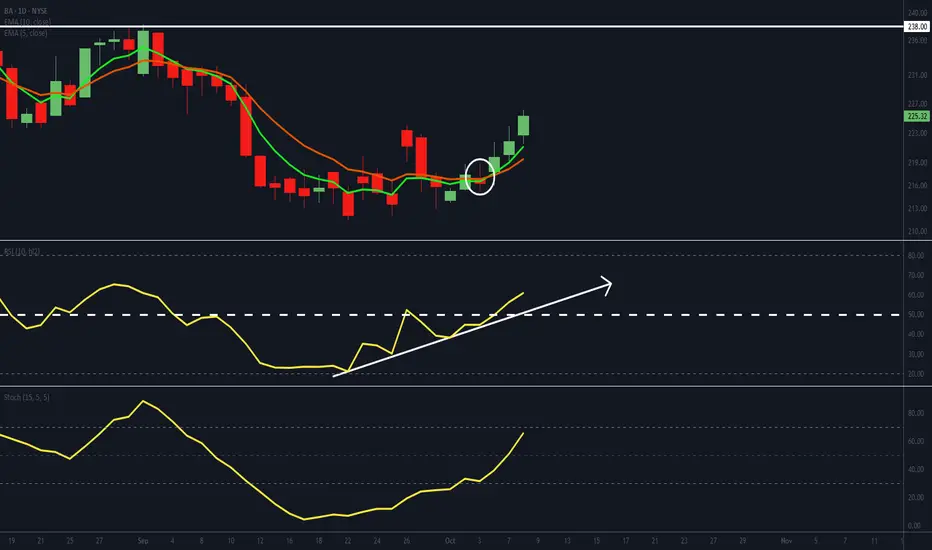
BA setting up for potentially strong move
- BA's EMAs have crossed bullishly and are developing angle and separation.
- Its RSI has popped above 50, suggesting a shift to positive momentum.
- Its stochastic is on the borderline to cross through 70. A move above, will add to the positive momentum argument. The longer it maintains above 70, the greater the likelihood of further price appreciations.
- Overhead resistance is at 238. A break above will be regarded as a bullish development.
INFY Turning Bullish: IT Giant Ready for the Next Leg UpINFOSYS — 1 Hour Timeframe Analysis
INFY is showing strong momentum after respecting its support zone around 1400–1420. The stock has rebounded well and is now approaching its resistance zone near 1580–1590.
The Supertrend indicator is displaying a positive bias, while the MACD has confirmed a bullish crossover in the positive zone, further validating the ongoing strength in momentum.
Any buy-on-dip opportunity near the Supertrend support around 1450–1460 could offer another round of bullish momentum. The stock is currently maintaining a Higher Low – Higher High (HL–HH) structure, indicating a healthy uptrend continuation.
If the support zone holds firmly, we may witness higher prices in INFY in the coming sessions.
Thank You !!

REZ - BULLISH CONSOLIDATION? AMEX:REZ - Update:
Neutral PA at the moment, but;
I'm pretty bullish on this one, price is consolidating above previous key resistances acting now as support.
Lower key supports:
0.01350 - 0.01320 - 0.01300$
Prices could to take off soon.📈

#ZECUSDT - Another leg up is aheadWe all saw a massive bullish in zec in previous days out of 260% instant bullish... and now it's in consolidation
it shows a symmetrical triangle pattern in hourly chart with 2 attempts of breakout ... third one must be work
the next station at ( 250 - 280$)
best Regards:
Ceciliones🎯

Bulls are back on $OPEN Bulls are back on NASDAQ:OPEN 📈
Bullish breakout and potential trend reversal ✅
Expecting further upside as price targets the previous large gap.
Local support: 0.5350$ (weak)
Trend context (H1): Uptrend
Additional levels I’m watching:
• 0.4950 - golden pocket
• 0.4800
• 0.4570 - 0.786 fib
Bulls could push higher from here, but the current price is neutral.
Short term play: Likely bearish correctio, before the next real move!
Bull setup to be monitored.
Safe play: Keep an eye on the 0.4800 -0.4700$ demand zone for bulls!

Bullish Move Coming UpPrice has been slowing coming down, taking out liquidity at different levels. Waiting for price to come down to at least 50% of the order block and do another sweep of liquidity and there's a chance in Market Structure/CHOCH, will enter long.

CAKE 3D AnalysisHere is an analysis of CAKE on 3 Day time frame. It has broke long term down trendline on 3 Day time frame. We can expect the next targets as expected on chart. NFA DYOR.

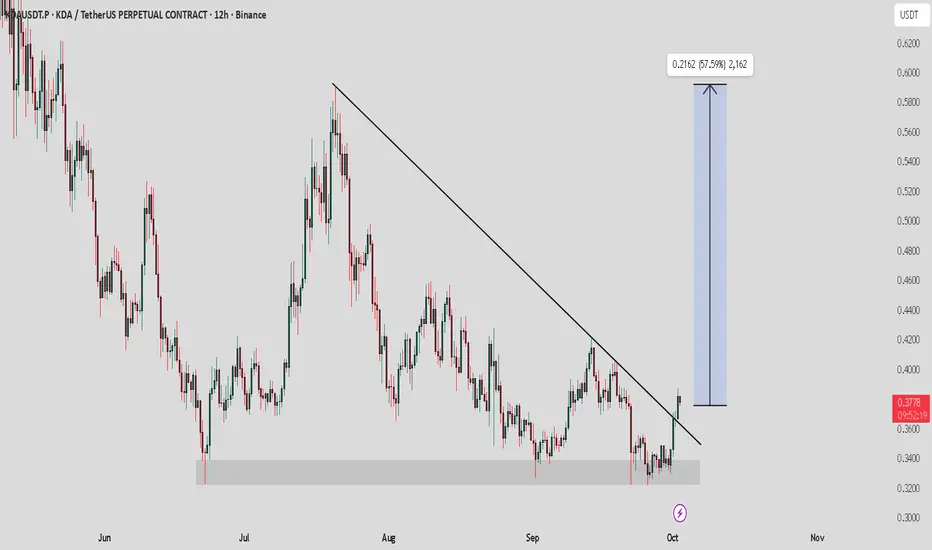
KDA / USDT : Momentum building after a successful breakoutKDA / USDT has confirmed its breakout with strong potential. If momentum sustains, we can expect a bullish rally towards $0.50 – $0.60.
Always manage risk wisely and avoid entering without proper confirmation.
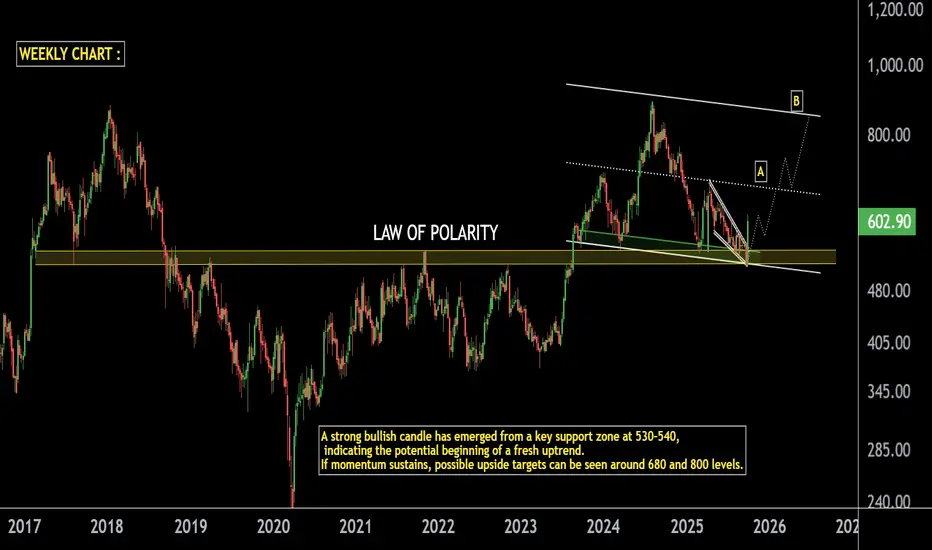
SUN TV on Fire: Explosive Move from Strong Support Zone.SUN TV Weekly Analysis
Support Zone: Stock is respecting the long-term LOP with strong support in the 520–530 range.
Bullish Candle: A powerful bullish candle has formed at this support zone, signaling strength.
Momentum Outlook: If momentum continues, a minor correction could act as a healthy pause before the next rally.
Resistance Levels:
First resistance / rally stop point near 680.
If 680 breaks, next resistance is positioned around 850.
Trend View: As long as the 520–530 support zone sustains, SUN TV may continue its rally in the coming sessions.
Thank You !!
GBPUSD Buy Trade before NFP release. October 1 2025The trade was activated 1 hour before NFP fundamental was released. I use the 5min chart for entries and 15-1H for HTF Structure. I noticed that yesterday the previous supply was taken away creating a demand that is much powerful. In confluence with the recent economic data, I got some risk off environment but JPY is winning against USD. I followed that weakness to be able to validate this GBPUSD trade. Attached here is the chart showing simple bullish move that can be validated by adding your technicals (knowledge about supply and demand) plus fundamental analysis.
RR: 3:1
Entry Model---> 5min BOS then retracement.
Point of Entry :OB with Imbalance.

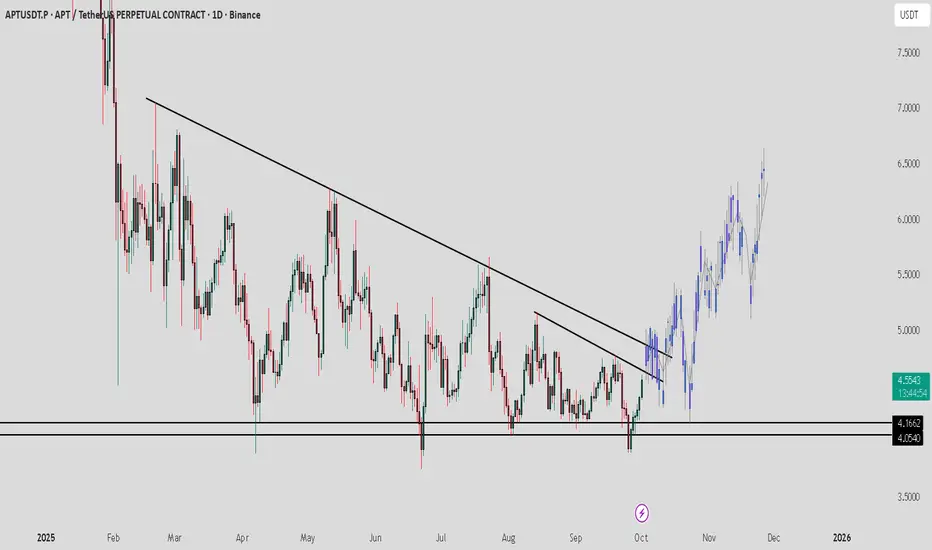
APT / USDT : Showing strong momentum for a strong rallyAPT/USDT Analysis
APT is building strong momentum and preparing for a potential breakout. Once it clears this level, we can expect a bullish rally towards $6 – $7 in the near term.
Always wait for confirmation before entering and manage risk wisely.
XAU/USD Trade Setup – Bullish Continuation in Play?Gold (XAU/USD) has recently shown a strong bullish recovery after a sharp drop from the $3,870 area. The price is currently consolidating near the $3,843 zone, forming a potential bullish continuation pattern.
We’ve now seen:
A V-shaped reversal off the $3,805 support zone
Strong bullish candles breaking short-term resistance
A potential higher low formation, signaling buying interest
🧠 Trade Idea:
🟢 Long Position Setup
Entry: Around $3,840.80
Stop Loss: $3,830.48 (below the recent low)
Targets:
🎯 TP1: $3,854.94
🎯 TP2: $3,861.25
🎯 TP3: $3,871.18 (extended)
This gives a solid risk-to-reward ratio of ~2:1 or better, depending on your target level.
🔍 Technical Highlights:
Key resistance levels: $3,855, $3,861, $3,871
Key support level: $3,830
Candlesticks show strong bullish momentum with little selling pressure during pullbacks.
Price is trading above the breakout zone, indicating buyers are in control.
⚠️ Risk Management:
As always, wait for confirmation near the entry zone. Be cautious of false breakouts, especially around the $3,840–$3,845 region. Stick to your stop loss and take profit levels.

Cognex (CGNX) – Downtrend Breakout + Double Bottom ConfirmationOn the Weekly timeframe , NASDAQ:CGNX is showing strong bullish technical signals:
The long-term downtrend line has been broken both on body and shadow, confirmed with high volume .
The last weekly candle is forming near a retest, while on the Daily chart, a strong bullish candle confirms buyers stepping in.
A clear Double Bottom pattern has formed, with the neckline overlapping the downtrend line, providing stronger confirmation.
Price is trading above EMA50 & EMA100 , with EMA50 attempting a bullish cross over EMA100.
The stock has also broken through local resistance , opening the way for higher targets.
MACD is bullish, showing positive momentum.
RSI is already inside the overbought zone. However, since no divergence is present, this could still support bullish continuation, though short-term pullbacks are possible.
Key Levels:
If the breakout and retest confirm, the first target is the nearby resistance zone.
A further move towards the next resistance level (~$72–73) is possible if momentum sustains.
Important Note:
This analysis is not a buy/sell signal , but rather an educational outlook. While technicals are bullish, traders should remain cautious as RSI is in the overbought zone, where short-term corrections are common.
(For educational purposes only, not financial advice.)

Adobe (ADBE) – Double Bottom + EMA50 Breakout PotentialOn the Daily timeframe, NASDAQ:ADBE is showing early signs of strength:
A Double Bottom pattern has formed, often seen as a bullish reversal signal.
RSI divergence was present at the pattern lows, and RSI has broken above its trendline, suggesting momentum shift.
Price closed above the EMA50 , an important technical milestone.
MACD is in positive territory, supporting a potential continuation upward.
Volume has not spiked dramatically, but it is gradually increasing compared to recent history.
Key Levels:
If the downtrend resistance line is broken and price retests neckline/downtrend area successfully, the pattern projects a move at least towards the next local resistance zone.
Confirmation is crucial: a breakout without retest can be a false signal.
Important Note:
This analysis is not a buy/sell signal. It highlights potential upside if key technical levels are broken and confirmed. Patience for breakout + retest may provide a clearer setup.
(For educational purposes only, not financial advice.)
