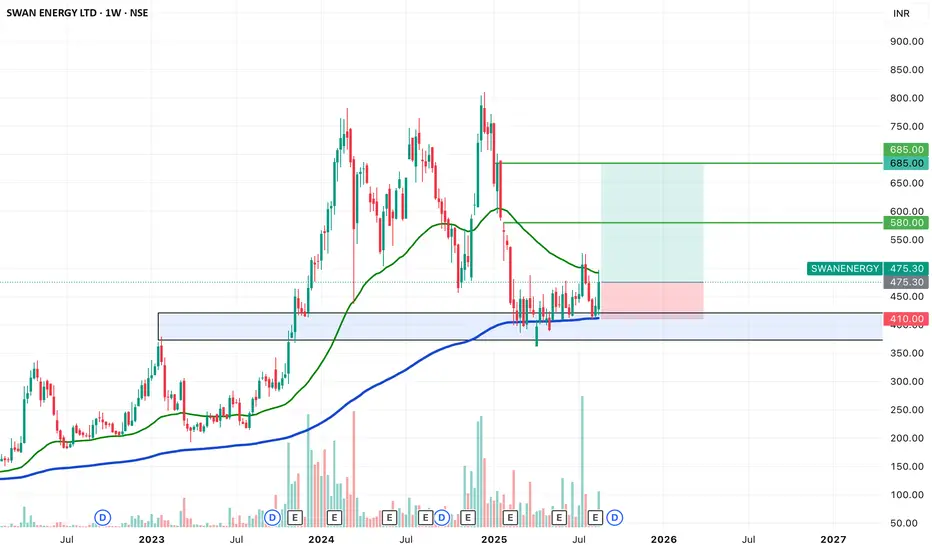
SWING IDEA - SWAN ENERGYSwan Energy , a diversified company with interests across textiles, energy, and real estate, is showcasing a strong swing trade opportunity backed by reliable technical signals.
Reasons are listed below :
The 450 zone has acted as a strong support, and price is now attempting a breakout from a 6-month Darvas box consolidation.
A strong bullish engulfing candle on the weekly timeframe signals renewed buying interest.
The 200 EMA on the weekly chart is acting as a solid support.
The stock is also bouncing from the golden 0.618 Fibonacci retracement zone.
Target - 580 // 685
Stoploss - weekly close below 410
DISCLAIMER -
Decisions to buy, sell, hold or trade in securities, commodities and other investments involve risk and are best made based on the advice of qualified financial professionals. Any trading in securities or other investments involves a risk of substantial losses. The practice of "Day Trading" involves particularly high risks and can cause you to lose substantial sums of money. Before undertaking any trading program, you should consult a qualified financial professional. Please consider carefully whether such trading is suitable for you in light of your financial condition and ability to bear financial risks. Under no circumstances shall we be liable for any loss or damage you or anyone else incurs as a result of any trading or investment activity that you or anyone else engages in based on any information or material you receive through TradingView or our services.
@visionary.growth.insights
Bullishsetup
All Eyes on BALKRISHNA IND – Support Holding Tight!Balkrishna Industries Ltd – MONTHLY Chart
The stock is moving in a well-defined parallel channel with strong support in the 2100–2200 zone.
The EMA is also providing support around 2160 and 2300 levels.
If these levels are sustained, we may witness higher prices in Balkrishna Industries.
However, if the stock breaks below this support, the next major support zone lies near 1200–1300.
Thank you.

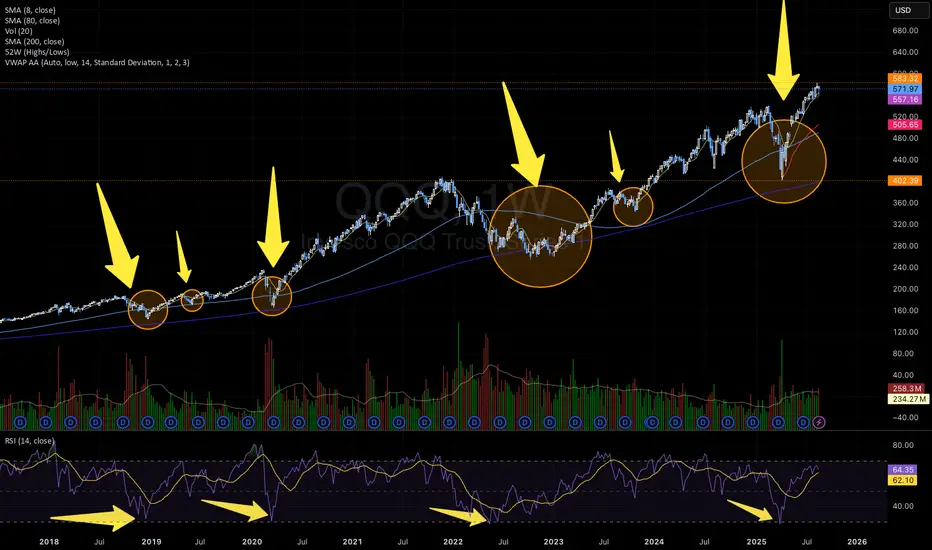
Bullish Pattern: V-Shape + Shakeout with Strong RSI SignalOn the QQQ weekly chart, a recurring bullish pattern has emerged multiple times over the last years:
1) V-shape recoveries followed by Cup & Handle formations and then a shakeout, all of which preceded powerful upside moves (highlighted with arrows and circles).
2) Each time the weekly RSI touched the 30 zone , it triggered a strong bullish rally. This happened three times in the past (2018, 2020, 2022) and just occurred again in March/April 2025.
3) Both times the Cup & Handle pattern formed, the RSI found support around the 45 level.
This suggests that QQQ may be setting up for another bullish leg if history repeats itself.
📊 Key Takeaways:
Weekly RSI bouncing from oversold (30 zone)
Recurrent V-Shape + Cup & Handle + Shakeout bullish pattern
Strong rallies historically followed this setup
⚠️ Not financial advice — purely a technical pattern study.
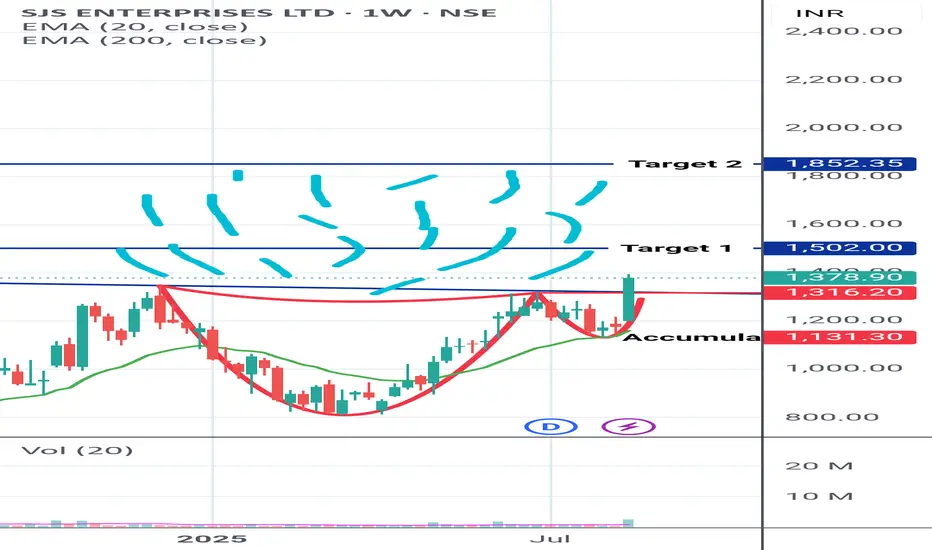
SJS ENTERPRISES VERY HOTSJS ENTERPRISES
Presents you a Hot Beautiful Cup of Coffee for tasting.
Those who wish to Enjoy the Taste can pay and start tasting it
Note Levels mentioned in chart itself. Kindly go through it
GH 3D: breakout forming inside ascending channelThe price of GH continues consolidating within the top of an ascending channel, confirming bullish structure. The rectangular accumulation has lasted for over three months, with price staying above all major EMAs and MAs - a strong trend confirmation. On the last impulse, volume increased, and now the price is compressing again. A breakout with a retest would serve as a valid entry. First target lies near 61.38, second at 73.66, and third at 87.37 - aligned with the upper range of the medium-term Fibonacci extension. Fundamentally, GH remains a promising biotech pick amid sector rotation and potential Fed easing. EMAs and MAs sit below price, and D/A supports the breakout scenario. Waiting for confirmation before entering.

XAUUSD Long Thesis: Triangle Support Bounce to Target 3380Hello, traders! The recent history of the XAUUSD price auction has been defined by the establishment of two major pivot points, which have set the boundaries for the current market structure. A significant pivot point low was formed near the 3300 demand zone, which initiated a rally that was subsequently capped by a pivot point high at the 3390 supply zone. This sequence has transitioned the market from a directional phase into a period of balance and consolidation.
Currently, XAU is consolidating within a large symmetrical triangle, a pattern signifying equilibrium and contracting volatility. The price is being methodically squeezed between a descending supply line and an ascending demand line, indicating that energy is building for a significant move. The market is now in a corrective pullback, heading towards the ascending demand line for what is expected to be a critical test of buyers' resolve in this structure.
The working hypothesis is a long scenario based on a successful defense of the triangle's lower boundary. It is anticipated that the price will complete its corrective dip and test the ascending demand line, which originates from the 3315 demand zone. A confirmed bounce from this dynamic line would validate the pattern's integrity and trigger an upward rotation. The take-profit is therefore set at 3380. Manage your risk!

Bitcoin BTC Bounce Incoming?📊 CRYPTO:BTCUSD is approaching the extreme technical zone: $111,400–$108,300, where a weekend bottom could form.
If structure holds, this area may set the stage for a bounce into next week, aligning with key wave metrics.
⏱️ Timing and confirmation will be critical.

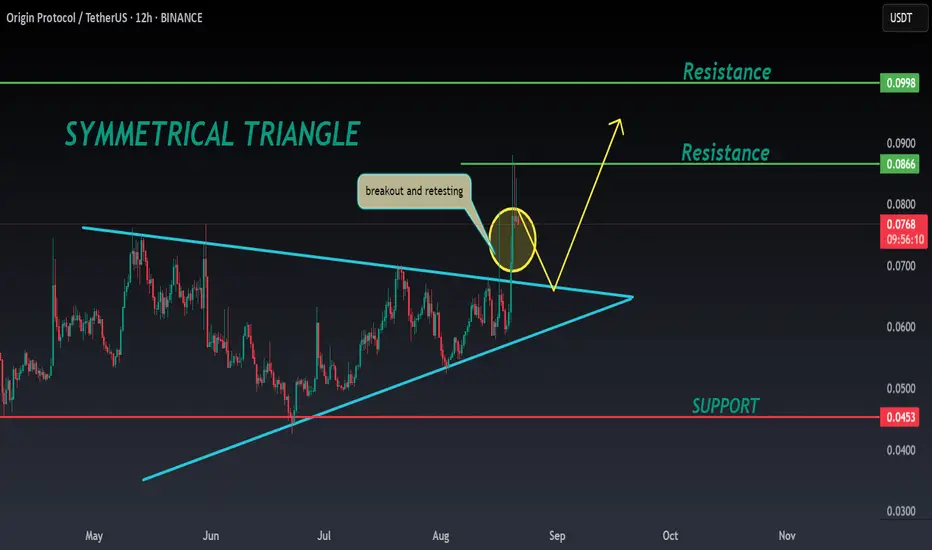
OGN ANALYSIS🔮#OGN Analysis 💰💰
#OGN is trading in a symmetrical triangle in a weekly time frame and breakouts with high volume and we could see a bullish momentum in #OGN. Before that we will see little bit bearish movement towards its support zone and that a bullish movement.
🔖 Current Price: $0.0768
⏳ Target Price: $0.0998
⁉️ What to do?
- We can trade according to the chart and make some profits in #OGN. Keep your eyes on the chart, observe trading volume and stay accustom to market moves.💲💲
🏷Remember, the crypto market is dynamic in nature and changes rapidly, so always use stop loss and take proper knowledge before investments.
#OGN #Cryptocurrency #Pump #DYOR
CMG - Bullish Engulfing off 200 SMA & Support Zone?(Weekly chart) NYSE: CMG price action went through a series of flush downs into multiple support levels, where market makers likely cleared out stop-losses. At that zone, price formed a bullish engulfing pattern, signaling a potential attempt to rebound and regain momentum.
Price action highlights:
1) Flush down into the previous high level (resistance turned support).
2) Confluence with the 200 SMA on the weekly chart – a strong long-term support line.
3) Extension through the lower Bollinger Band, signaling short-term oversold.
4) Stochastic oversold, hinting at potential reversal.
5) Last week formed a strong bullish engulfing candle at supports.
This setup offers a favorable risk-reward profile — limited downside with strong upside potential.

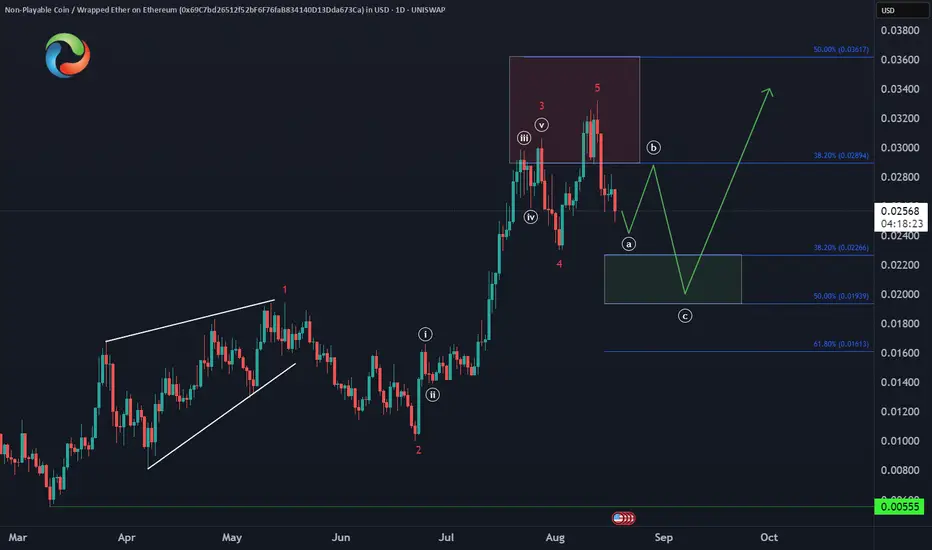
NonPlayableCoin NPC Bullish Setup in PlayBITGET:NPCUSDT has completed a 5-wave advance off the March low, and is now in a 3-wave pullback.
📍 Watch for buyers to step in around the $0.022–$0.019 zone, setting the stage for the next leg higher.
🚀 Structure favors continuation once support holds.
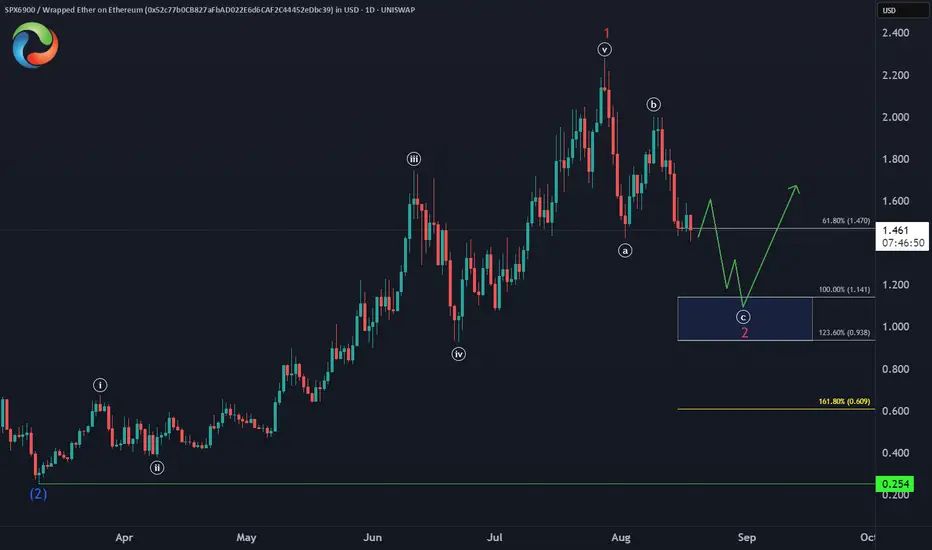
SPX6900 Buying Opportunity🚨 UNISWAP:SPXWETH_52C77B.USD is correcting against the March low within a potential Zigzag structure, eyeing the equal legs zone at $1.14–$0.93 for a bullish setup.
📐 Structure suggests a high-probability bounce from this area.
Cardano ADA Short-Term Correction in Play📉 COINBASE:ADAUSD is currently unwinding its August rally through a 3-wave pullback, with the ideal support zone between $0.85–$0.81.
Buyers are expected to step in there, setting the stage for the next bullish reaction.

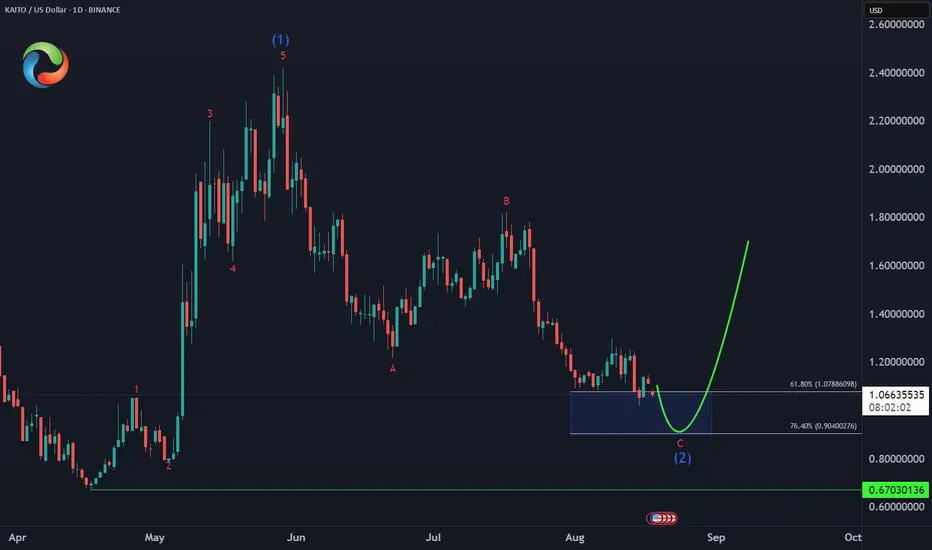
KAITO One Step Closer to the Bounce📊 BINANCE:KAITOUSDT is now entering the key reversal zone at $1.08–$0.90, where a monthly low is expected to form—setting the stage for a larger bullish reversal.
🔄 Watch for reaction and confirmation signals as the structure completes.
EUR/USD Buy idea to the upside Weekly EURUSD Analysis
My outlook for EU is similar to GU — I’ll be watching for a retracement into demand before looking for buys back to the upside. The key area on my chart is the 9H demand zone, where I’ll be monitoring for signs of accumulation before entering longs.
At the same time, I’ve marked a 6H supply zone sitting at a strong premium level. If the bullish scenario doesn’t play out, this would be an ideal area to catch potential sells to the downside. Either way, I’ll be waiting for price to slow down and confirm at one of my POIs before committing.
Confluences for EU Buys:
- Strong 9H demand zone responsible for the last break of structure.
- Overall bullish structure → pro-trend trade idea.
- DXY analysis aligns with bullish EU outlook.
- Imbalance above + liquidity that still needs to be taken.
P.S. If price breaks below the 9H demand zone, I’ll be eyeing the 5H demand zone just beneath, as it’s more discounted and potentially offers an even cleaner long setup.
Let’s have a strong week ahead!

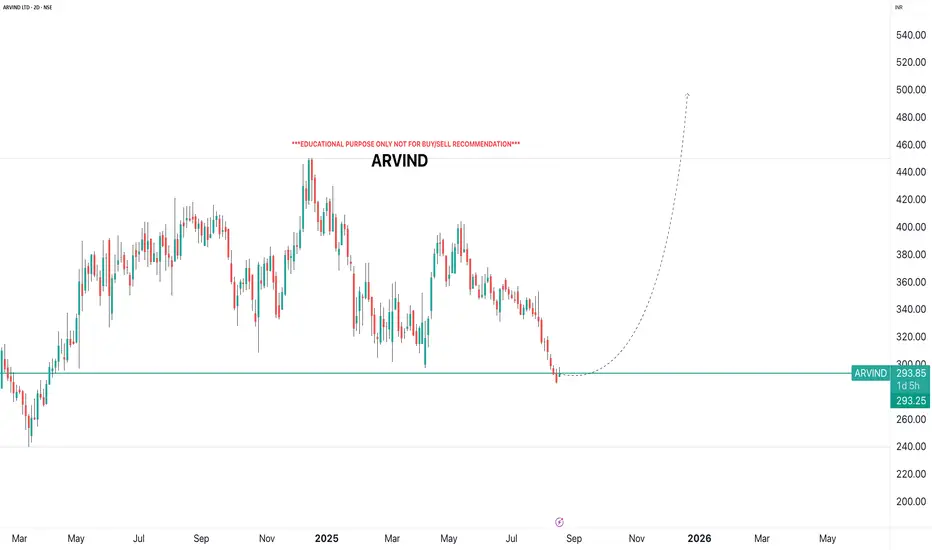
ARVINDi Observed these Levels based on Price Action and Demand & Supply which is my own Concept "PENDAM CONCEPTS"... Please don't take any trades based on this chart/post... Because this chart is for educational purpose only not for Buy or Sell Recommendation... Thank Q
GST Reforms + Cooling Inflation: Can Nifty Aim for 25,800..?🚀 Nifty 50: Breakout + Big Policy Boost ?
📉 Technical View
Nifty 50 has broken out of its downward channel and is testing higher levels.
* Key resistance: 24,850 🔑
* If sustained & retested → next target: 25,800 🎯
This could mark the start of a fresh bullish leg if momentum holds.
📊 Macro Tailwinds
* Inflation cools off ➝ July CPI at 1.55% (lowest since June 2017) 😮
* Food inflation at -1.76%, down from -1.06% in June.
👉 Softening inflation = stronger spending power + supportive environment 📈
📰 Policy Catalyst: GST Reforms by Diwali 2025
PM Modi’s Independence Day speech highlighted “Next-Gen GST Reforms” 🇮🇳:
* 12% GST slab ➝ may shift to 5% 💡
* 28% GST slab ➝ may shift to 18% 📉
* New 40% slab for sin goods (tobacco, beer, etc.) 🚬🍺
➡️ Could lighten tax burden, stimulate consumption, and lift corporate profits.
⚡ Takeaway
Technical breakout + cooling inflation + GST reforms = constructive setup for Nifty 50.
* Watch 24,850 carefully → breakout & retest opens gates to 25,800.
📌 Note: Global risk remains. Trump’s proposed additional tariffs could hinder the trend and inject volatility 🌍⚠️.

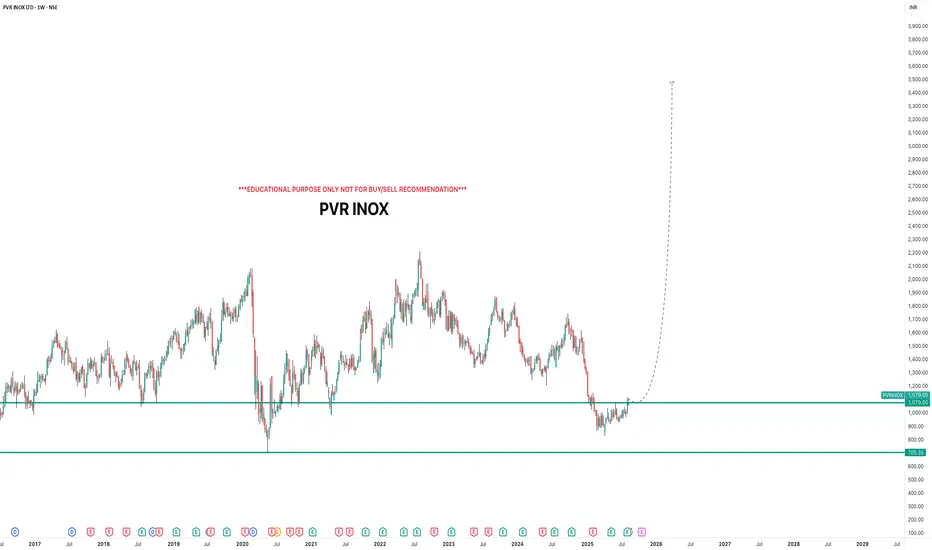
PVR INOXi Observed these Levels based on Price Action and Demand & Supply which is my own Concept "PENDAM CONCEPTS"... Please don't take any trades based on this chart/post... Because this chart is for educational purpose only not for Buy or Sell Recommendation... Thank Q
SCENARIO STUDY: Bullish or Bearish?Hello fellow traders! Here’s a fresh, USD/JPY plan that blends 4-hour technicals with today’s macro/news flow, plus the most recent trader and bank sentiment. Time to get happy!
USD/JPY for Aug 15, 2025, U.S. morning/afternoon
4H structure: After a slide that tested ~146.2–146.4 support, the USD/JPY keeps running into 147.8 and 148.5 as notable 4H hurdles.
Macro/news today: U.S. PPI (July) surprised hotter, cooling talk of a 50 bp Fed cut (market leans 25 bp for Sep 17); Japan Q2 GDP beat aided the yen and BoJ-hike chatter.
BoJ backdrop: July meeting opinions/outlook show a cautious tightening bias and discussion of resuming hikes; 10-yr JGB around ~1.5%.
Positioning & sentiment (latest):
CFTC JPY (non-commercial) net longs have fallen from mid-July peaks to ~82k (Aug 8). Retail (spot) sits near 54% long / 46% short.
Banks’ bias (based on recent published views):
UBS CIO guides for USD/JPY drifting lower through year-end (~140 by Dec 2025) as BoJ tightens gradually, and J.P. Morgan Research also expects weaker USD into late-2025 (USD/JPY ~141 Sep, 140 Dec).
4-hour levels to mark
Support: 146.20–146.40, then ~146.00 (deeper swing shelf).
Resistance: 147.80, 148.50 (recent 4H/spot pivot and swing high).
Scenario A — Bullish (rebound off support / corrective pop)
Why it could play out: Hotter U.S. PPI trimmed aggressive-cut bets; if incoming U.S. data/fedspeak doesn’t further dent yields, a corrective USD bounce can lift price from support toward overhead supply! Go Bulls? :D
Bullish Plan (4H execution):
Entry: 146.40–146.70 on a 4H bullish candle or RSI divergence near S1. (Structure band per the 4H map.)
Stop: 145.95 (clean break of the lower shelf).
Take Profit 1: 147.80 (first supply).
Take Profit 2: 148.50 (recent high / strong supply).
Respect Supports: 146.40–146.20, then 146.00.
Resistances to fade/scale: 147.80, 148.50.
Indicative R:R: from 146.60 risk ~65 pips to stop for ~+120 pips to TP2 (≈1:1.8), +120–190 pips if extension through 148.5.
Scenario B — Bearish (trend continuation from resistance)
Why it could play out: 4H downswing remains intact below 147.8/148.5; BoJ tone leans cautious-hawkish, Japan data firmed (GDP), while CFTC shows less crowded JPY longs (reduced squeeze risk). UBS/JPM public pieces lean medium-term lower USD/JPY.
Bearish Plan (4H execution):
Entry: 147.80–148.00 on a 4H rejection wick / failure swing at R1.
Stop: 148.60 (invalidate above R2 swing high).
TP1: 147.00 (recent intraday base).
TP2: 146.20–146.40 (key 4H demand).
Resistances to lean on: 147.80, 148.50.
Supports to target: 147.00, 146.20–146.40, then ~146.00 if momentum accelerates. Go Bears? :D
BUT WAIT..... Which is more probable now?
As for the team here at How To (dot) Forex, we are collectively leaning bearish (Scenario B) over the next few sessions. And, here is why....
Structure: Price remains capped beneath 147.8/148.5 on the 4H map.
Macro skew: Hot PPI pared back “big cut” bets but markets still favor a 25 bp cut; meanwhile Japan GDP beat + BoJ talk of possible resuming hikes is JPY-supportive.
Sentiment: Retail near 50/50 (slight long) and CFTC net JPY longs off the highs → fewer asymmetric squeeze dynamics for upside USD.
What are the banks saying?
Recent UBS and JPM predictions point to lower USD/JPY into year-end, aligning with fade-rallies bias unless price reclaims R2 decisively.
_________________________________________________
OPINION AND COMMENTARY:
we prefer fade-rally shorts into 147.8–148.0 unless a 4H close above 148.5 flips bias. If you see a strong 4H basing signal at 146.2–146.4, the bullish corrective setup is valid — just keep targets conservative at 147.8/148.5.
If you have questions, or want to see a specific type of analysis not presented here, leave us a comment below. Thank you for reading. We appreciate your support. Happy trading!
_________________________________________________
DISCLAIMER: This analysis was conducted by our in-house team of multi-level traders. We are not responsible for any losses you may incur. Always do you own research before trading. If you are new to trading, consider practicing with a free paper trading account. Ask your broker for details.

TRADE PLAN: Bulls vs BearsHello, fellow traders! We've created a 2-scenario trade plan based on the most recent technical, macro, and trader sentiment using 4 hour charts - because we love you!
1. BULLISH SCENARIO — rebound from support
Price is oversold on the 4H RSI and nearing key support (146.4–147.0). Fed easing expectations are already priced in, so any upside surprise in U.S. data, or lack of follow-through selling, could trigger a corrective rally.
TRADE PLAN:
Entry: 146.40–147.00 (look for a 4H bullish candle or RSI divergence confirmation)
Stop: Below 146.00 (clear break under the next support cluster)
Target 1 (Partial trade plan): 147.80 (local resistance)
Target 2 (Full trade plan): 148.50 (Aug 12 high)
SUPPORT LEVELS:
Support 1: 146.40–147.00
Support 2: 146.00
RESISTANCE LEVELS:
Resistance 1: 147.80
Resistance 2: 148.50
RISK/REWARD: ~1:2 from midpoint entry (146.70), risking 70 pips for 140 pips potential.
__________________________________________________
2. BEARISH SCENARIO — continuation lower
The pair remains in a short-term 4H downtrend after failing above 148.5. Softer U.S. CPI reinforced Fed cut odds, while Japan’s inflation remains >2% with a mildly hawkish BoJ bias — supportive for yen strength.
TRADE PLAN:
Entry: 147.80–148.00 (sell into a retest of broken support / 4H resistance)
Stop: Above 148.50 (invalidated if breakout above Aug 12 high)
Target 1 (Partial TP): 147.00 (intraday swing low area)
Target 2 (Full TP): 146.00 (deeper swing support)
RESISTANCE LEVELS:
Resistance 1: 147.80
Resistance 2: 148.50
SUPPORT LEVELS:
Support 1: 147.00
Support 2: 146.00
Support 3: 145.80
RISK/REWARD: ~1:2.5 from midpoint entry (147.90), risking 60 pips for 150 pips potential.
_________________________________________
PROBABILITY ASSESSMENT (based on our most current data)
Bearish case is slightly more probable near-term because macro backdrop favors JPY (BoJ gradually normalizing, U.S. rate cut expectations rising).
Price action still in 4H downswing with momentum (MACD) negative and resistance overhead. CFTC data shows yen longs reduced — less chance of a squeeze higher on short-covering. That said, oversold conditions mean bullish bounces are possible, but likely corrective rather than trend-changing unless U.S. data turns hawkish again.
We hope you found our analysis helpful and thank you for reading. Follow us here on TradingView for more up to date analysis. Happy trading!
__________________________________________
DISCLAIMER: Our analysis is not 100% absolute. We are not responsible for any losses incurred. Please be sure to do your own research before investing or trading.

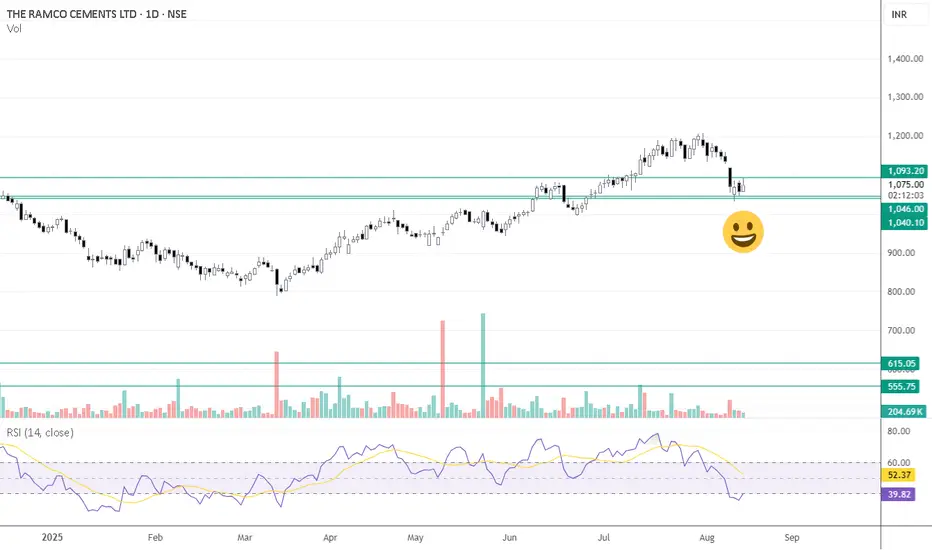
Ramco Cement — Trade SetupRamco Cement — Trade Setup Watchlist
Breakout: Confirmed on both monthly and weekly charts.
Current Move: Price has retraced back to the breakout zone.
Trade Idea: Monitor for potential long entry if price holds above the breakout level.
Reasoning: Pullback to breakout zone could offer an attractive risk–reward opportunity.
Key levels to watch:
Breakout support:
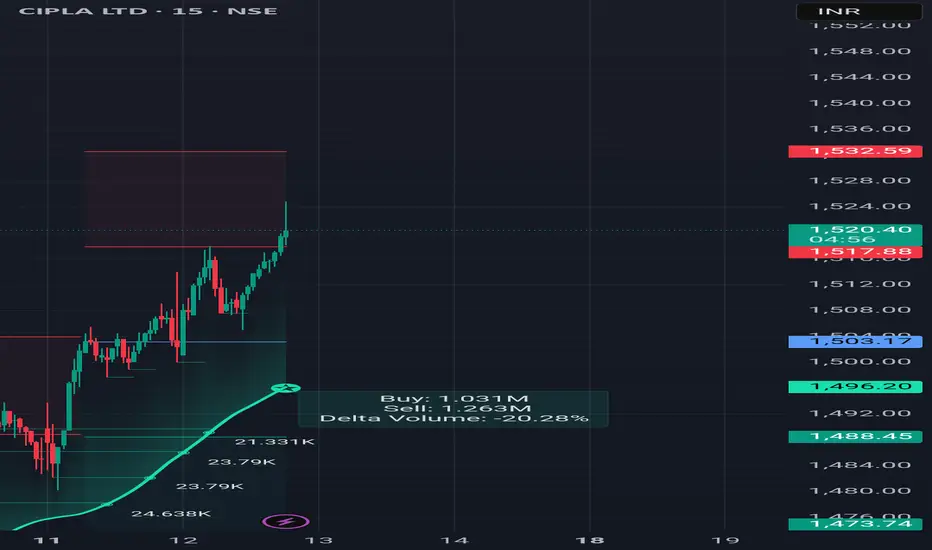
Cipla Break out📊 1–2 Days Technical Call
📌 Stock: CIPLA Ltd
💵 Buy Above: 1519.0
🎯 Target Price: 1557.0 (Upside: +2.50%)
🛑 Stop Loss: 1500.0 (Downside: -1.25%)
⚖ Risk–Reward Ratio: ~1 : 2.0
📅 Holding Period: 1–2 trading days
📌 Rationale: Positive technical setup; breakout expected above 1519 with momentum likely to push towards 1557 in short term.
"Gold’s Next Big Move? The Hidden Entry Zone Smart Money "Gold’s Next Big Move? The Hidden Entry Zone Smart Money is Watching!"
Gold (XAUUSD) is currently consolidating after a series of higher lows, signaling sustained bullish momentum from the strong support region around $3,280–$3,300. Price has respected key structural points, forming a clean market structure with:
BOS (Break of Structure) confirming bullish intent after reclaiming prior resistance.
Bullish FVG (Fair Value Gap) acting as a liquidity zone for potential re-entries.
Multiple Higher Lows, highlighting strong buyer defense levels.
The chart indicates a possible short-term retracement into the $3,350–$3,357 entry zone, which aligns with demand structure. From this zone, buyers are expected to push toward the $3,400–$3,415 resistance target.
Key technical levels:
Entry Zone: $3,350–$3,357 (demand area)
Stop Loss: Below $3,340 to protect against deeper pullbacks
Take Profit: $3,400 psychological level and $3,414 structural resistance
Market Sentiment:
The combination of a strong support base, sustained higher lows, and bullish imbalance zones suggests a favorable risk–reward setup for long positions. A clean breakout above $3,415 could trigger a larger bullish leg toward the $3,440 resistance zone.
📈 Bias: Bullish above $3,350
💡 Watch for a reaction at the entry zone before committing to positions.

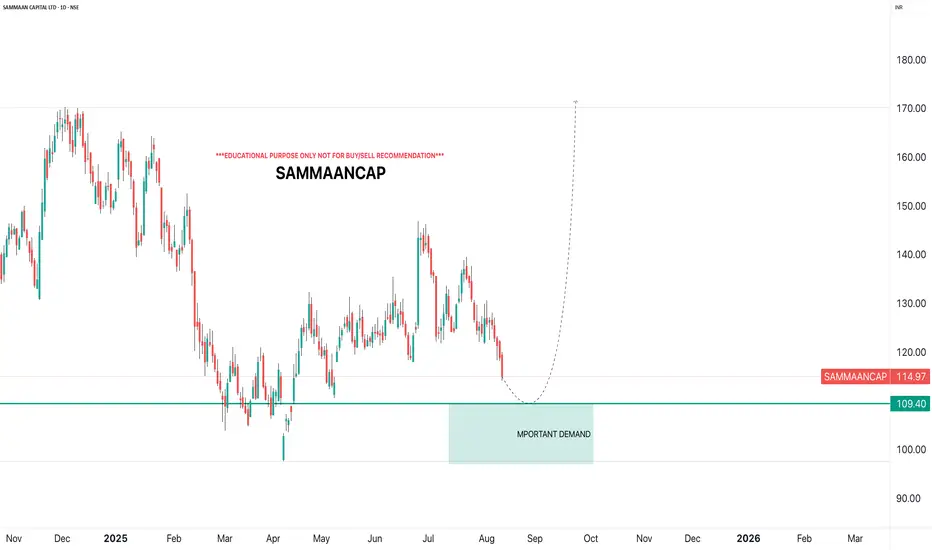
SAMMAANCAPi Observed these Levels based on Price Action and Demand & Supply which is my own Concept "PENDAM CONCEPTS"... Please don't take any trades based on this chart/post... Because this chart is for educational purpose only not for Buy or Sell Recommendation... Thank Q