Latest Gold Update Today!Hey traders,
As we kick off this new week, XAUUSD is holding steady, hovering around the 4,050-dollar level with barely any noticeable volatility.
This calm price action comes as the market keeps a close eye on what the Federal Reserve plans to do next. More and more participants are expecting the Fed to shift toward a more dovish stance and potentially move closer to a rate cut by the end of the year. With bond yields slipping, the dollar gradually losing strength, and safe-haven demand picking back up, gold is getting a solid foundation for a possible short-term push higher.
From a technical standpoint, XAUUSD is tightening inside a triangle pattern — a classic setup that usually signals accumulation before a stronger impulsive move. If price manages to break above the upper boundary, the next target could stretch toward the 4,500-dollar region, supported by the strength of the previous bullish leg.
From my perspective, market sentiment is slowly leaning toward the buyers, especially if upcoming U.S. data continues to ease pressure on gold.
What about you? How do you see things playing out? Are you expecting more upside, or do you think a correction is coming?
Wishing you a smooth, confident, and profitable trading week ahead.
Buy!!

HPQ HP Options Ahead of EarningsIf you haven`t sold HPQ before the previous earnings:
Now analyzing the options chain and the chart patterns of HPQ HP prior to the earnings report this week,
I would consider purchasing the 23usd strike price Puts with
an expiration date of 2025-12-19,
for a premium of approximately $0.74.
If these options prove to be profitable prior to the earnings release, I would sell at least half of them.

IMPP Imperial Petroleum Options Ahead of EarningsIf you haven`t bought IMPP before the rally:
Now analyzing the options chain and the chart patterns of IMPP Imperial Petroleum prior to the earnings report this week,
I would consider purchasing the 7usd strike price Calls with
an expiration date of 2026-4-17,
for a premium of approximately $0.85.
If these options prove to be profitable prior to the earnings release, I would sell at least half of them.

DE Deere & Company Options Ahead of EarningsAnalyzing the options chain and the chart patterns of DE Deere & Company prior to the earnings report this week,
I would consider purchasing the 510usd strike price Calls with
an expiration date of 2025-12-19,
for a premium of approximately $8.95.
If these options prove to be profitable prior to the earnings release, I would sell at least half of them.

XAUUSD: Stuck Above 4,000, Just Waiting for the Next DropThe current context shows gold being “squeezed” between two forces : on one side, improving risk appetite as markets expect the Fed to cut rates; on the other, ongoing geopolitical and global financial concerns . As a result, price is holding above 4,000 but finding it hard to break higher.
On the H1 chart, XAUUSD is moving sideways with a slight downside tilt, spending most of the time inside or below the Ichimoku cloud . The latest bounce only reached the 4,100 area before being sold off again, showing that the cloud and the top of the channel are still acting as a lid on the downtrend. In the middle of the range, price is hovering around the temporary support at 4,050 – which is also the level highlighted on the chart as a potential breakdown point.
Trading idea: if price fails to hold 4,100 and we get a clear H1 close confirming weakness, the intraday bearish trend could resume and drag gold back toward the 4,050 zone.
Good luck and trade safe!

CADJPY Will Go Up! Long!
Please, check our technical outlook for CADJPY.
Time Frame: 3h
Current Trend: Bullish
Sentiment: Oversold (based on 7-period RSI)
Forecast: Bullish
The market is trading around a solid horizontal structure 111.244.
The above observations make me that the market will inevitably achieve 112.283 level.
P.S
Overbought describes a period of time where there has been a significant and consistent upward move in price over a period of time without much pullback.
Like and subscribe and comment my ideas if you enjoy them!

USD/CHF BULLS ARE GAINING STRENGTH|LONG
Hello, Friends!
USD/CHF is trending up which is clear from the green colour of the previous weekly candle. However, the price has locally plunged into the oversold territory. Which can be told from its proximity to the BB lower band. Which presents a classical trend following opportunity for a long trade from the support line below towards the supply level of 0.806.
Disclosure: I am part of Trade Nation's Influencer program and receive a monthly fee for using their TradingView charts in my analysis.
✅LIKE AND COMMENT MY IDEAS✅

#EURUSD , BuySide QuickScalp ?📌 Market Insight: {#EURUSD }
⚠️ Risk Assessment: {High}
🚀 Approach:
Same as UJ , Not a perfect setup
We can take it ONLY and ONLY by LTF Entry sign ... No rush on it .
#Ash_TheTrader #Forex #GBPJPY #MarketAnalysis #TradingSetup #RiskManagement #GOLD #Scalper #NQ #EURUSD

Bitcoin Drops Sharply – Is This Bounce Only Temporary?Hello everyone, Bitcoin continues to show weakness on the 4H chart: the bearish structure remains intact, with overlapping red FVGs above and nearly every rebound being rejected quickly. After the sharp fall from the 100,000 USD region, the price is now hovering around 85,000 USD — a level that clearly reflects persistent selling pressure.
Digging deeper into the technicals, BTC remains below the Ichimoku cloud and under several unfilled FVG zones, especially the 87,500–89,000 USD region. This forms a “lower ceiling” where any upward attempt is met with immediate selling pressure. Volume also leans heavily toward the sellers, reinforcing the view that the short-term trend is still firmly bearish. Just beneath the price, the 84,500–84,000 USD area is acting as temporary support; it’s also the nearest liquidity pocket, suggesting a technical rebound may occur.
The broader environment is not helping Bitcoin either. The USD has strengthened following a series of stronger-than-expected US economic reports, from employment data to Big Tech performance. This has pulled capital away from risk assets. US equities continue to attract speculative money, while the Fed has yet to provide any clear signal about rate cuts. Market sentiment isn’t extremely risk-off, but it is discouraging enough to limit Bitcoin’s chances of staging a meaningful reversal.
With all these factors combined, I lean toward one main scenario: Bitcoin may see a technical rebound toward the 87,000–88,000 USD region, where the nearest FVG and an unfinished supply–demand balance lie. However, I still expect this bounce to act merely as a liquidity-grab move before BTC faces renewed selling pressure and revisits the 84,000–82,500 USD zone.
What do you think — is this rebound just a trap before the next leg down?

BTC Is Falling Freely – Every Pullback Is Just a Trap!Bitcoin is currently entering a phase where every bounce is seen as a selling opportunity . Market sentiment has turned cautious as news continues to lean negative: BTC has broken its lowest level in six months around $86,000 , and reports indicate that a major whale has exited a position worth $1.3 billion . When big money pulls out, the market struggles to stay stable.
Observing price action, BTC is moving steadily downward with lower highs forming continuously . Every time the price attempts to rise, it gets pushed down immediately, showing that sellers are fully in control of the market. Upper price zones are consistently rejected, proving that buying pressure is not strong enough to create any meaningful reversal.
The most reasonable scenario now is that BTC may stage a technical bounce toward $93,700 , but it is likely to encounter strong selling again and continue falling toward the major target around $76,800. Any upward move during this period is just a pullback to sell , not a signal of a real trend reversal.
In short, negative news + bearish technical structure are strongly aligned, so for short-term traders, it’s best to sell with the trend , wait for price to pull back before entering, and avoid catching bottoms when the market has no clear reversal signals yet.
BITCOIN BULLISH BIAS RIGHT NOW| LONG
BITCOIN SIGNAL
Trade Direction: long
Entry Level: 84,546.32
Target Level: 101,066.22
Stop Loss: 73,559.02
RISK PROFILE
Risk level: medium
Suggested risk: 1%
Timeframe: 1D
Disclosure: I am part of Trade Nation's Influencer program and receive a monthly fee for using their TradingView charts in my analysis.
✅LIKE AND COMMENT MY IDEAS✅

Understanding Forex Money Flow: Risk-on & Risk-offWhen it comes to Forex, most traders focus on technicals, chart patterns, or indicators. But “money flow” — the force that truly moves price — is often overlooked. If you want to read the market like a pro, you must understand Risk-on and Risk-off: the two sentiment states that drive global capital.
Today, let’s break them down clearly, practically, and in a way you can apply immediately.
🔥 What Is Risk-on?
“Risk-on” appears when the market is optimistic, investors seek risk, and money flows strongly into high-return assets.
Signals of a Risk-on Environment:
Strong stock market rallies
Capital shifts into riskier assets
Bond yields rise
Positive economic news or geopolitical easing
Assets That Benefit in Forex:
AUD, NZD, CAD (commodity currencies)
GBP, EUR (when the economy is stable)
Bitcoin, oil, and equities also tend to rise
Risk-on = “The market is excited → money flows into high-yield assets”.
💥 What Is Risk-off?
“Risk-off” occurs when the market fears uncertainty, causing money to move toward safe-haven assets.
Signals of a Risk-off Environment:
Stock markets fall sharply
Money exits risky assets
Gold spikes
USD and JPY strengthen
Negative economic news, war, inflation, or political instability
Assets That Benefit in Forex:
USD, JPY, CHF
Gold (XAUUSD)
U.S. government bonds
Risk-off = “The market is scared → money runs to safety”.
❓ Why Forex Traders MUST Understand Risk-on / Risk-off
No matter what indicator you use, the market ultimately reacts to major capital flow.
Understanding these two states helps you:
Trade with market sentiment → dramatically increases win rate
Avoid entering trades against the money flow → fewer “pointless stop-loss hits”
Identify strong/weak currencies → choose high-probability setups
Many perfect technical setups fail simply because they go against global money flow.
📌 How to Apply This Immediately in Your Forex Trading
1. Check the News → Identify Sentiment
Good news? Strong GDP? Stable markets? → Risk-on
Bad news? War? Inflation? Hawkish Fed? → Risk-off
2. Compare Currency Strength
Simple formula:
Risk-on → prioritize BUY AUD, NZD, CAD
Risk-off → prioritize BUY USD, JPY, CHF
3. Follow the Trend — Avoid Fighting Money Flow
The strongest trends often come from shifts between Risk-on and Risk-off.
Examples:
Bad news → JPY strengthens → XXXJPY pairs fall hard
Risk-on returns → USD weakens → gold rises quickly
Follow the money flow, and you’re already ahead of 80% of traders.
🧠 Conclusion – If You Want to Trade Smart, Trade With the Money Flow
Risk-on and Risk-off aren’t just theory — they’re the compass that reveals market psychology, which is the foundation of every trend.
Want to trade like Smart Money?
→ Watch where the money is moving, not just where the candles are going.

Gold Returns to a Sensitive Zone – Is the Downtrend Already DoneHello everyone, gold is undergoing a rather deliberate correction after dropping from 4,110. Price is now moving around 4,078–4,066 — low enough to make buyers cautious, yet not deep enough to trigger panic. I want to share my personal view on the most likely bearish scenario at the moment.
1. What is the market showing us?
On the H2 chart, price is sitting right at the edge of the Ichimoku cloud, supported by a green FVG and a thin buffer zone at 4,045–4,035. The sequence of small red candles last night resembles profit-taking rather than a trend reversal. It feels like the market is “offloading for comfort”, not capitulating.
The most notable area is the 4,045–4,035 support cluster:
this zone overlaps the nearest FVG and also marks the accumulation base from 19–20 November. It behaves like a natural stopping point — where price tends to return to gather liquidity before choosing its next direction.
2. The news factors pressuring gold
September’s NFP came in at 119k (vs 50k forecast), pushing rate-cut expectations lower. The USD strengthened, and the Fed gained more reasons to stay cautious as October’s report was combined into November.
At the same time, US and EU equities strengthened thanks to Big Tech leaders, with Nvidia’s strong earnings pulling capital out of safe-havens. The 10Y yield hovering around 4.1% and oil dropping to 59.5 USD further reduced gold’s appeal.
Overall, this is a news-driven pullback — a familiar “sentiment reset” after a heated rally.
3. The highest-probability bearish scenario (in my view)
I lean toward the scenario where price continues drifting toward 4,045–4,035 to gather liquidity and tap the FVG, then forms a rejection wick and rebounds toward the resistance zone at 4,095–4,115.
This is a technical rebalance after news, not a signal of a long-term trend reversal. As long as 4,000 holds, the market still has enough momentum for the next bullish leg.

USD/JPY Surges Strongly as Early Signs of Correction AppearHello everyone, USD/JPY has just gone through a rather “excited” rally, climbing straight from 153 to 157 and is now slowing around 157.38. Looking at the market structure, I feel this is the phase where buyers begin to cool off — momentum remains, but the market’s breathing has shortened compared to previous days.
On the 4H chart, the sequence of green FVGs from the bottom shows buyers continuously absorbing every minor pullback. But as price approaches 157.50–157.80, candles start shrinking, wicks grow longer, and price begins to move sideways as if hesitating. This is often an early signal the market wants to “pause”, especially after an overly fast breakout.
The area I’m watching closely is 156.20–156.00. This zone contains a freshly formed green FVG overlapping the Ichimoku cloud — a type of “air cushion” the market often revisits to rebalance before continuing its move. It feels like the market is waiting for a small dip to refresh after the sharp run-up.
On the news side, U.S. 10Y yields remain around 4.1% and the Fed has not committed to the timing of rate cuts, which keeps the USD supported. Meanwhile, the BoJ remains firm on ultra-loose policy, keeping the Yen weak. Add to that strong gains in U.S. and European equities, capital is flowing out of safe havens, further removing support for the JPY. All of this builds a foundation for the long-term uptrend in USD/JPY, but also increases short-term profit-taking pressure after such an aggressive climb.
Given the current setup, I lean toward a corrective scenario: price pulling back to 156.20–156.00 to sweep liquidity and test the FVG, then if we see a rejection wick or returning buy pressure, USD/JPY could easily bounce back toward 157.50–158.00 in the next few sessions. The broader trend is still bullish, but the market needs a “breather” to regain energy.
What do you think — will USD/JPY dip to retest support first, or break straight through 157.80?

Ethereum Slides Deeper as Price Moves Toward 2,750 SupportHello everyone, Ethereum is facing a rather uncomfortable decline after its attempt to recover from the 3,000 USD region failed completely. The price is now hovering around 2,790 USD — the lowest level in over 10 days — and is trading firmly below the Ichimoku cloud, a familiar signal that sellers are still dominating the market.
Observing the price structure on the 4H chart, I see ETH repeatedly leaving red FVGs above, stretching from the 3,000 to 3,200 USD zone. This clearly shows one thing: every recent bounce has been quickly sold off. The market is showing a clear “sell the rally” sentiment, making the short-term downtrend smooth and consistent.
Ethereum is now sliding toward the 2,750 USD zone — a key support area that held price quite well in early November. This is also where liquidity thickens, a region where the market often reacts. But if this level is broken cleanly, the decline could extend toward 2,700–2,650 USD, right at the high-liquidity region and strong support on the D1 timeframe.
News flow also isn’t helping crypto at the moment. The USD is strengthening after September’s jobs report came in far above expectations, raising concerns that the Fed may not cut rates anytime soon. When the dollar becomes more attractive, capital tends to move away from risk assets — and crypto feels the pressure directly. Meanwhile, US equities are recovering strongly thanks to Big Tech and AI stocks, drawing speculative flows away from major coins like ETH.
From my perspective, the highest-probability scenario is that Ethereum continues dropping toward 2,750 USD to test demand. If this area fails to generate a strong enough reaction, price could easily extend lower toward 2,700 USD — a zone where technical buyers may become more active.
What do you think — will Ethereum defend 2,750 USD successfully, or will it need to drop further before recovering?

BUY GOLDGood day to everyone, in todays TRAP Friday we are monitoring GOLD for buys. Our entry is at 4037.33 and stops below 4012. Target 4093. Use proper risk management.

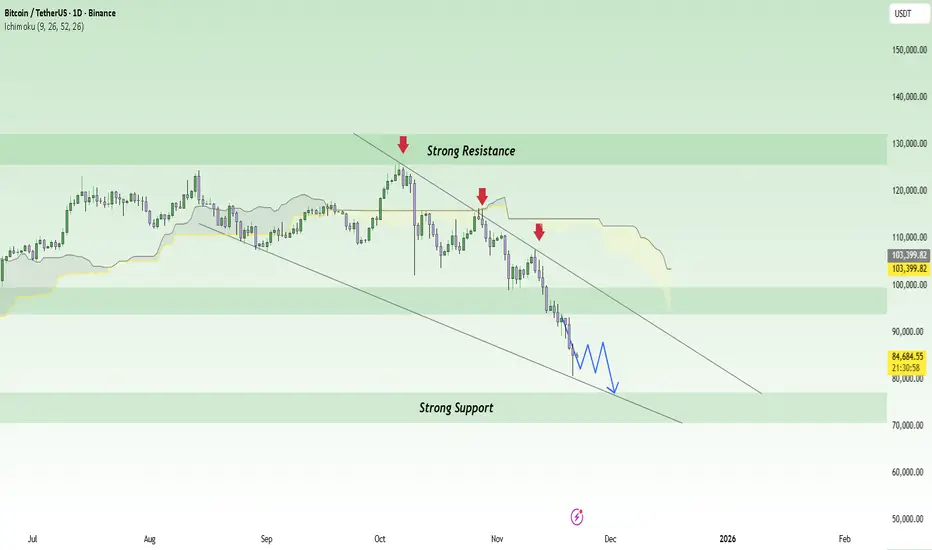
BTC Bitcoin Bear Market If you haven`t bought BTC before the recent rally:
Historically, Bitcoin has shown a tendency to retrace in December before starting a recovery around March. This pattern could repeat this season, with BTC facing selling pressure as year-end portfolio rebalancing and macro uncertainties weigh on the market.
While a brief Santa Claus rally might provide temporary relief, the bearish trend is expected to dominate until March. By then, BTC could trade below $84K before regaining momentum, aligning with its historical recovery trend as market conditions stabilize in spring.

EURGBP Potential UpsidesHey Traders, in today's trading session we are monitoring EURGBP for a buying opportunity around 0.88000 zone, EURGBP is trading in an uptrend and currently is in a correction phase in which it is approaching the trend at 0.88000 support and resistance area.
Trade safe, Joe.

Is Gold About to Fall? Strong USD Pressures XAUUSD DownThe gold market is entering a sensitive phase as buying momentum gradually weakens, while the USD strengthens again following a series of positive economic releases . There is a sense of “calm before the storm”, and XAUUSD is now tilting toward a bearish direction.
U.S. data shows a clear recovery in the labor market: NFP surged far above expectations , hourly earnings remained stable, and the Fed is expected to maintain a cautious stance. These factors combined have boosted the USD , putting direct pressure on gold.
From a technical perspective, XAUUSD keeps getting rejected at the 4,080 resistance zone . A rounding-top pattern is forming, Ichimoku signals are weakening, and each rebound is becoming smaller. The 4,000 support level has been tested repeatedly , suggesting a rising probability of a breakdown.
If price fails to break above 4,080, gold may continue pulling back toward 4,000, and could even extend the decline to 3,930, the next major support zone. This remains the most reasonable scenario as both fundamentals and technicals align to the downside.

EURUSD is preparing for a major reversal counterattack?There are phases when the market drops so deeply that everyone believes the downtrend is already sealed. Yet right in the quietest moments, buying pressure begins to accumulate the strongest. EURUSD is now sitting precisely at that “compression point”.
The latest economic data shows a clearly weakening USD: lower employment, rising unemployment, declining income, and the Fed signaling a softer stance. Meanwhile, Germany’s PMI came in better than expected, strengthening the EUR.
-> Combined together: Strong EUR – Weak USD → The bullish trend becomes significantly reinforced.
On the chart, EURUSD is forming a bottom around 1.15100 and moving into a highly attractive accumulation zone. The Ichimoku cloud is thinning, and price keeps bouncing from support — signaling an upcoming shift in momentum. The structure suggests a strong likelihood that EURUSD will retest 1.16000 within the next few sessions.
The ideal entry zone sits around 1.15100 – 1.15250, targeting 1.15700 and later 1.16000. When fundamentals and technicals align, the bullish move is often very strong and very fast.
EURUSD is “waking up” again, and unless unexpected volatility strikes, this breakout could happen sooner than most traders think.

GBPJPY: Weak Yen, Strong GBPGBPJPY is currently in a strong uptrend, thanks to the weakening of the Japanese yen . Japan's policies, especially those related to interest rates and financial plans , have put significant pressure on the yen. This has allowed the British pound (GBP) to maintain its strength, especially as investors shift to higher-yielding assets.
The H1 technical chart shows GBPJPY moving within a clear ascending wedge . The price is fluctuating between a solid support level at 205.00 and resistance at 205.80. The EMA indicators support this uptrend, indicating that the price will likely continue to rise as long as it stays above these support levels.
With the weakening yen and supportive factors from the chart , GBPJPY could continue to rise to higher levels, particularly 205.80 in the short term. Traders can look for buying opportunities when the price adjusts to near the 205.00 support level, creating a favorable entry point.
With the combination of fundamental and technical factors , GBPJPY has the potential to continue maintaining its uptrend. The next resistance level will be 205.80, and if it breaks through, the pair could continue to reach higher targets in the near future.

GBPJPY Will Move Higher! Buy!
Please, check our technical outlook for GBPJPY.
Time Frame: 9h
Current Trend: Bullish
Sentiment: Oversold (based on 7-period RSI)
Forecast: Bullish
The market is approaching a significant support area 205.634.
The underlined horizontal cluster clearly indicates a highly probable bullish movement with target 208.475 level.
P.S
Please, note that an oversold/overbought condition can last for a long time, and therefore being oversold/overbought doesn't mean a price rally will come soon, or at all.
Like and subscribe and comment my ideas if you enjoy them!

Gold Slides Sharply as Markets React to Fed Signals and AI RallyHello everyone, looking at XAU/USD on the 4H timeframe today, I can clearly feel that gold has just gone through a very “textbook” correction after major news. From the 4,130 USD peak, price dropped quickly to 4,079 USD, losing more than 50 USD in a single session. At the moment, gold is trading around 4,090 USD, sitting below the Ichimoku cloud and having just filled part of the FVG around 4,100 — showing that sellers are still in control.
Technically, gold failed to break through the 4,130–4,150 USD resistance cluster. Last night’s sharp drop broke below the short-term support at 4,100, triggering a wave of profit-taking from earlier long positions. Now, the area at 4,070–4,050 USD is the nearest support and the level gold must defend to avoid a deeper decline towards 4,020–4,000 USD. Conversely, to return to an upward move, gold needs to reclaim 4,110 decisively — otherwise any rebound will likely be temporary.
Fundamentally, the market was moved just as much by news as by technicals. The FOMC minutes showed the Fed is still divided: one side worried about weakening labour data, the other insisting inflation hasn’t behaved consistently. This dampened expectations for an early rate cut, strengthening the USD, pushing DXY above 104 — and immediately weighing on gold. At the same time, Nvidia’s blowout earnings sent US equities sharply higher as money rotated into AI stocks, reducing gold’s appeal during a “risk-on” wave.
In this context, I see this as a healthy correction within a broader uptrend — not a reversal. Based on the way price is reacting, gold will likely retest 4,070–4,050 USD before attempting a rebound. If buyers return at that zone, price may recover toward 4,110–4,130 USD, especially if the USD pauses. If 4,050 breaks, gold may drop deeper to 4,020–4,000 USD to attract liquidity.
