FCSC First Capital Securities Corporation LtdFCSC First Capital Securities Corporation Ltd 1D PSX
TECH: Price already retraced to our buy zone 0.6.18 and should move up to make new high.
FUNDAMENTALS
Growth: ⭐⭐⭐⭐⭐
Stability: ⭐⭐⭐⭐☆
Cashflows: ⭐⭐⭐⭐⭐
Valuation: ⭐⭐⭐⭐⭐
6️⃣ YoY & QoQ Check
YoY
✔ Revenue ↑
✔ Operating Profit ↑
✔ EPS ↑
✔ Cash Flows ↑
✔ Balance sheet strength ↑
→ Very positive turnaround
QoQ (From Q3 to Q4)
Quarterly EPS improved
Revenue slightly stable
Costs controlled
→ Neutral to slight positive
9️⃣ Final Verdict
FCSC is a strong BUY both for:
✔ Long-term investors (Value Investing)
and
✔ Swing Traders (Technical + Momentum)
It qualifies as a classic value stock with momentum building.
Buy!!

Fed Cuts Rates, USD Weakens — Gold’s Moment Has Arrived!Based on the current market landscape, XAUUSD is entering a phase where buyers hold a clear advantage , supported by both favorable macro conditions and a technical structure that reinforces a new bullish leg. This is a period where gold isn’t rising just because of news — it now has a solid foundation to sustain its trend.
To begin with, the Fed’s 0.25% rate cut — from 4.00% to 3.75% — immediately pressured the USD. Lower rates naturally drive capital away from USD-denominated assets and toward safe-haven assets like gold. In addition, J obless Claims are projected to rise to 220K, up from 191K, signaling a slowing labor market. A weaker labor market often pushes the Fed further into an easing stance — a key catalyst that helps gold maintain its upward momentum.
On the chart, price is rebounding from the 4,190 support zone, an area that has repeatedly shown strong buying interest. The structure remains above the Ichimoku cloud, signaling that the medium-term uptrend is still intact . The accumulation happening directly inside this support area further strengthens the scenario of XAUUSD retesting the 4,240 resistance. As long as 4,190 holds, the bullish momentum is essentially “open and ready” for buyers.
Combining both fundamentals and technicals, gold is standing in front of a clear opportunity to extend its bullish expansion. This is a phase where the market is less noisy, the bullish bias is clean and decisive , and monetary policy is providing a solid launchpad. If buyers keep control above 4,190, the 4,240 target becomes only a matter of time.

XAUUSD Ready to Break Out – Strong Uptrend Ahead!Hello traders! Today, we will analyze the XAUUSD currency pair.
Fundamental Factors Affecting XAUUSD:
Fed rate cut: The Fed is expected to cut interest rates in the December meeting, which will weaken the USD and make gold a more attractive safe-haven asset for investors.
Geopolitical situation: The tensions between Russia and Ukraine continue to escalate, creating global instability and driving demand for gold as a safe-haven asset.
Weak economic data: Weak ADP employment data and GDP data from the US have increased market expectations that the Fed will maintain or cut interest rates, making gold even more attractive.
Technical Analysis:
On the chart, XAUUSD is currently trading within a clear upward trendline, with strong support at 4.170 USD. This is a price level that has been tested and bounced multiple times in the past, showing stability and the potential for continued growth.
The immediate resistance level for XAUUSD is at 4.220 USD, where the price has encountered resistance before. If XAUUSD breaks through this resistance, the price could continue moving towards higher targets, such as 4.250 USD.
Thank you for listening to my analysis, and I wish you successful trading!

EURUSD Poised for a Breakout as the Fed Turns DovishWhen looking at EURUSD right now, we can clearly see the shift in momentum: the Fed has become more dovish , while Europe is not rushing into easing . The USD weakened after the rate-cut decision, and the ECB delivered a more optimistic outlook on economic growth — creating a solid foundation for the next bullish leg on the euro.
On the H4 chart, price is moving within a steady ascending structure, supported by the rising trendline and the Ichimoku cloud. The zone around 1.1680 acts as the nearest support — aligning with both the trendline and the base of the previous breakout. A clean scenario would be a mild pullback into this area, confirming demand before pushing higher again. The psychological resistance at 1.1770 becomes the natural upside target if the bullish trend continues.
As long as EURUSD holds above 1.1680, the bias remains bullish with a clear preference for a buy-on-dip strategy, following the capital flow shifting away from the USD toward the euro. What remains is to see how price approaches 1.1770 — through a smooth retest or an additional false break before the real breakout. Either way, it opens the door for high-quality entry opportunities in the sessions ahead.

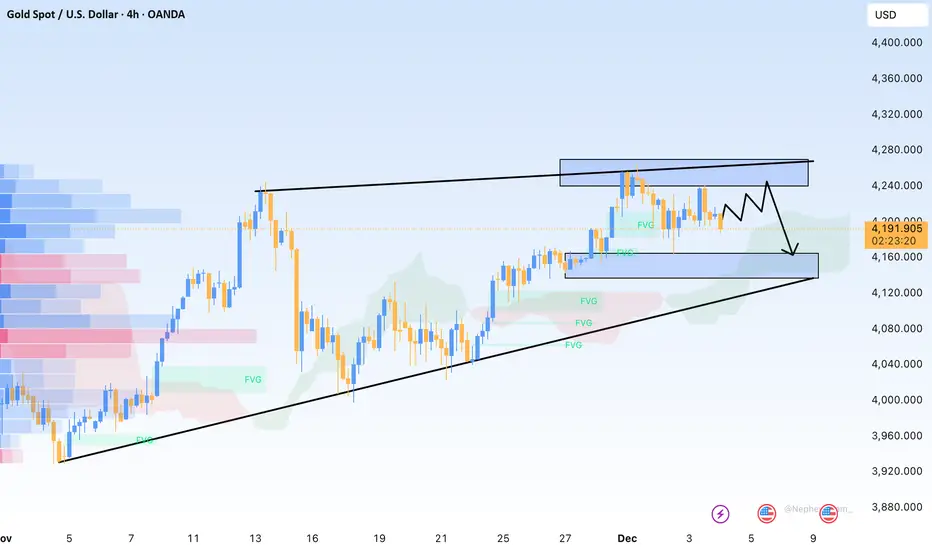
Clear Break & Retest: Gold Now Eyes a Push Toward $4,405Hello everyone, Helene here!
Right now, XAUUSD is a textbook example of a market trading inside a well-defined ascending channel, with price consistently respecting both the upper and lower boundaries of the structure.
We’ve just seen price break above a clear resistance zone and successfully retest it. This area also aligns with the “golden pocket” from the recent bullish leg, which makes it a highly critical zone to monitor. If this level continues to hold as support, it will act as a strong bullish structural confirmation, increasing the probability that price will extend toward 4,405, which is the upper boundary of the channel.
As long as price maintains above this support zone, the bullish setup remains valid. If not, then the short-term bullish outlook may be interrupted, potentially leading to a deeper corrective move.
Always remember to apply proper risk management.
Good luck, and trade safely.

USDCHF | Long IdeaUSDCHF tapped into Previous Weekly Low and showed a reaction.
I am bullish on this so these are the POI's I look for to make entry.
If price closes under this level, I will be looking for lower POI's to find a new entry points.
Let me know what you think.
Stay safe out there and do your own due diligence, this is not investment advise!

SAZGEW Sazgaar🚗 SAZEW – PSX- Weekly Trade Plan | Technical + Fundamental + Latest Sales Data
(Automobile Sector – Pakistan)
📉 Technical Outlook – Weekly Chart
SAZEW is completed a healthy retracement after its strong bullish run.
Key Technical Levels
🔵 Buy Area 1 (0.382 Fibonacci) → Already tested & respected → Early entry zone
🟡 Buy Area 2 (0.50 Golden Pocket) → High-probability support → Best entry zone
🔴 Buy Area 3 (0.618–0.65 deeper retracement) → Only if market pressure increases
Market Structure
Price continues to make Higher Highs (HH) & Higher Lows (HL) on weekly frame.
Retracement is healthy, not bearish – structure intact.
Strong bounce expected from 0.50 Golden Pocket. (if retraced furthe)
🎯 Technical Targets
Target 1: Previous High
Target 2: etimeated TBD TP2 shared. (To be Decided) later for final target.
🛑 Risk Management
Previous Highier Low (for traders) 1057
📊 Fundamental Overview (Strong Outlook)
Quarter-on-Quarter (QoQ) – Growth Confirmed
From the attached official PSX filing (Nov 2025 sales):
Latest:
🚙 FOUR-WHEELER
Production: 1,357
Sales: 1,109
Trend: Strong monthly sales, consistent demand
🛵 THREE-WHEELERS
Production: 1,742
Sales: 1,749
Trend: Sales > Production – inventory clearing = positive demand signal
➡ This shows solid operational efficiency, tight inventory control, and stable demand in both categories.
📈 Year-on-Year (YoY) Growth
(Based on latest quarterly & annual reports – verified)
EPS YoY: Strongly improving
Net profit YoY: Solid rebound
Revenue YoY: Increasing due to higher unit sales and better margins
Equity Growth: Healthy, consistent
Operational Profit: Margin expansion visible
SAZEW fundamentals indicate growth + stability, both essential for medium-term investors.
📰 Latest News Impact (From Attached Notice)
✔ New Sales Data Disclosure (November 2025)
Shows stable and rising demand in both 3-wheelers & 4-wheelers.
Indicates production consistency, meaning no supply chain disruption.
Market takes this as a positive operational indicator.
Overall Impact: POSITIVE
Supports medium-term price appreciation based on earnings and manufacturing strength.
🟢 Final Trading Plan – SAZEW
Buy Zones (Weekly)
1️⃣ Buy Area 1: Already tested (0.382 zone)
2️⃣ Buy Area 2: 💛 Best Buy – 0.50 Golden Pocket
3️⃣ Buy Area 3: Deep value zone (0.618–0.65)
A strong candidate for weekly swing trades & medium-longterm term investment.

GBPCHF Will Grow! Long!
Please, check our technical outlook for GBPCHF.
Time Frame: 1h
Current Trend: Bullish
Sentiment: Oversold (based on 7-period RSI)
Forecast: Bullish
The price is testing a key support 1.066.
Current market trend & oversold RSI makes me think that buyers will push the price. I will anticipate a bullish movement at least to 1.071 level.
P.S
The term oversold refers to a condition where an asset has traded lower in price and has the potential for a price bounce.
Overbought refers to market scenarios where the instrument is traded considerably higher than its fair value. Overvaluation is caused by market sentiments when there is positive news.
Like and subscribe and comment my ideas if you enjoy them!

GBPUSD Poised to Rally as USD Weakens Into December CutIn today's trading session we are monitoring GBPUSD for a buying opportunity around the 1.32900 zone.
GBPUSD remains in a clear uptrend, and is currently in a correction phase, approaching the 1.32900 support and resistance area, where buyers may step back in.
On the fundamental side, the US Dollar continues to weaken as the market increasingly prices in a December rate cut from the Federal Reserve. Recent US data has been softening, adding pressure on the Fed and reinforcing expectations for looser monetary policy.
A dovish Fed outlook = bearish USD, which naturally supports GBPUSD upside.
Trade safe,
Joe.

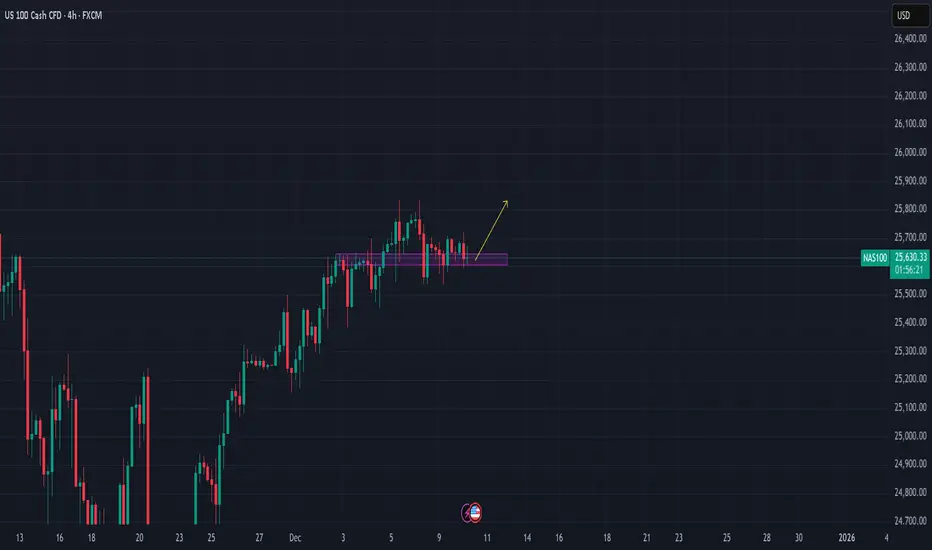
Dow Jones is approaching an important support! Hey Traders, in today's trading session we are monitoring US30 for a buying opportunity around 47,350 zone, Dow Jones is trading in an uptrend and currently is in a correction phase in which it is approaching the trend at 43.350 support and resistance area.
Trade safe, Joe.

XAUUSD: The Uptrend Is Gaining Momentum AgainGold traded cautiously yesterday as investors waited for this week’s FOMC meeting. But this very “quiet phase” is building the foundation for a new upward leg, as the fundamental factors still lean strongly toward the Bulls.
1. The Fed Is Nearing a Policy Shift – A Direct Boost for Gold
Lower interest rates are always a key catalyst for gold because the metal does not generate yield. When yields fall, gold immediately becomes more attractive. The market is now almost fully pricing in a potential rate cut from the Fed in early 2025 – a powerful driver for the medium-term uptrend.
2. Central Banks Continue to Buy – A Strong and Steady Support
Despite short-term pullbacks, central bank demand remains consistently strong. These institutions are long-term players, and their continued accumulation helps gold maintain its bullish tone across the entire market.
3. Geopolitical Tensions Stay Elevated – Gold Remains Well Supported
The unified support from the leaders of France, Germany, and the UK for Ukraine in London shows tensions are far from easing. Rising instability → more reasons for gold to stay strong.
4. Technical Outlook
Price is reacting around the strong resistance at 4250, but there is still no significant selling pressure.
Ichimoku shows Kumo providing solid support, with price staying above the cloud – confirming the dominant uptrend.
Current buy setup remains very reasonable:
SL: around 4173
TP: targeting 4253–4260
If price gives a mild retest and bounces, the probability of breaking above 4250 is very high.
Conclusion: The Trend Remains BULLISH
With supportive macro fundamentals + strong technical structure, XAUUSD continues to hold a clear bullish formation. As long as the Fed does not sound too hawkish, gold could easily break above 4250 and head toward higher levels in the coming days.

USDJPY Analysis UpdateHello traders, today let’s analyze the trend of the USDJPY currency pair!
In my opinion, USDJPY is likely to remain stable in the short term, with strong resistance at 157.000 and support at 156.000.
From a fundamental perspective, the Fed is maintaining its monetary policy with a high probability of no changes in interest rates in the near future. This helps the USD maintain its strength against other currencies, including the Japanese Yen. The market is expecting that the Fed will not take major actions to change interest rates, providing stability for the USD . Meanwhile, the BOJ continues with its loose monetary policy and has shown no signs of tightening, which keeps the Japanese Yen weak and supports the upward trend of USDJPY.
From a technical standpoint, USDJPY is trading near the strong support level at 156.000 . This is a price area that has been tested and bounced back several times, indicating stability and the potential for continued upward movement. If the price holds above this support level , moving towards the resistance at 157.000 is quite likely.
Additionally, external factors such as geopolitical tensions and global economic recovery may continue to impact USDJPY, providing stability for the USD and maintaining pressure on the Japanese Yen.
Thank you for listening, and I wish you successful trading!

BoE puts pressure, USD turns weak – who will win?As the Forex market anxiously awaits the final Fed decision , GBPUSD looks like a boat anchored in the middle of the river – not falling sharply, but not able to break out either. Today’s news shows that the BoE may cut rates soon , putting pressure on the pound, while the USD is weakening due to expectations that the Fed is also preparing to lower rates. As a result, the pair is moving in a sideways range, but still leaning slightly to the upside.
On the chart, GBPUSD is maintaining an uptrend structure , sticking to the rising trendline. The 1.3310 area acts as a near support; if price holds above this zone, the current fluctuations can be considered accumulation before moving towards the 1.3380 resistance.
My preferred scenario: price moves sideways around 1.3310 and then bounces toward 1.3380. The sensible strategy is to wait for a bullish signal at support and look for buys along the sideways-up structure, rather than selling against a market where neither fundamentals nor technicals favor the bears.

GOLD Will Go Higher! Buy!
Take a look at our analysis for GOLD.
Time Frame: 1h
Current Trend: Bullish
Sentiment: Oversold (based on 7-period RSI)
Forecast: Bullish
The market is testing a major horizontal structure 4,201.56.
Taking into consideration the structure & trend analysis, I believe that the market will reach 4,215.52 level soon.
P.S
Overbought describes a period of time where there has been a significant and consistent upward move in price over a period of time without much pullback.
Like and subscribe and comment my ideas if you enjoy them!

Break and retestnice little break and retest before open, and if it goes good and staable set sl closer, close off some size and ride the wave.
ps.
Iv been gone from trading for a while, iv spent 9 years learning, I got profitable after 3 years. I got so good that everytime i deposited i consistanly won, 1k, 600, 5k and so on. but one day i stopped and lost interest, but now im back and ready to take on 2026 with a iron bid. Follow for the come back of the kid who made it out of the garage.
Funds Are Coming Back – Will BTC Surge?Hello traders, wishing you a great day! Let’s take a look at BTCUSDT together.
If we had to name one asset that is recovering after a storm and starting to attract capital again, Bitcoin is definitely the leading candidate right now. Expectations that the Fed will soon cut interest rates are bringing risk appetite back , the USD is cooling down, and part of the capital flow is returning to crypto – therefore BTC has a solid chance to recover after the sharp drop at the end of November.
On the 12H chart, BTC remains inside a downward channel , but is moving steadily above the short-term support around 85,700, which is marked as Immediate support . The current pullback is mainly a pause to regain momentum after the first rebound, without breaking the latest lows , and is showing signs of forming a higher low.
If price continues to hold above 85,700 and forms an accumulation pattern as projected, the resistance zone 93,900 near the upper boundary of the channel and the Ichimoku cloud will be the next natural target.
Given that macro news is gradually supporting risk assets and technical signals show weakening selling pressure, I personally prefer the scenario where BTC continues to recover toward 93–94k , rather than breaking support immediately.

AUDUSD Set to Rally as Dollar Softens Ahead of Fed Cut!Hey Traders, in today's trading session we are monitoring AUDUSD for a buying opportunity around the 0.66000 zone.
AUDUSD is trading in an uptrend and is currently in a correction phase in which it is approaching the 0.66000 support and resistance area.
On the fundamental side, the U.S. Dollar continues to weaken as markets front-run the expected Fed rate cut, and traders increasingly price in a more dovish policy stance going into the next FOMC meeting.
This broad Dollar softness supports upside momentum on AUDUSD, especially as risk sentiment improves.
Trade safe,
Joe.

GOLD (XAU/USD): Consolidation ContinuesGold is currently consolidating within a horizontal parallel channel.
We spotted a notable bullish reaction to its support:
the price formed a small double bottom pattern and subsequently started to rise, violating its neckline with a bullish imbalance.
It is highly probable that the price will reach the 4220 level soon.

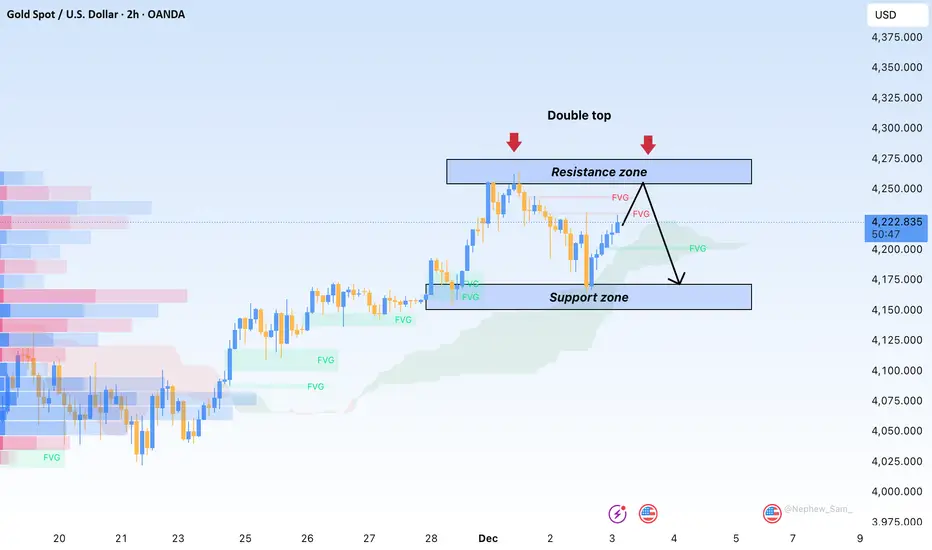
Gold Surges Strongly but Fails to Maintain MomentumHello everyone, the recent movement of gold reflects a market heavily influenced by “news-driven support overshadowed by selling pressure.” XAUUSD made an impressive breakout to 4,237 USD/ounce — the highest level in six weeks — as safe-haven flows returned on geopolitical tensions and expectations that the Fed will continue its rate-cut cycle. But only hours later, profit-taking rushed in, sending gold down more than 30 USD and pulling the metal back to the 4,207 USD region this morning.
This weakness mainly stems from improving risk sentiment: US equities rebounded, with the S&P 500 turning green and the Nasdaq pushing higher as tech stocks led the move. Japanese markets also stabilised as bonds cooled, reducing demand for safety. And with the DXY climbing to 99.18, downward pressure on gold became even more evident — a stronger USD rarely favours the precious metal.
From a technical perspective, the 4,180–4,190 FVG zone helped lift price again after the sharp drop, but gold remains capped beneath the upper FVG resistance. The Ichimoku cloud on the 2H timeframe shows price approaching the Kijun–Senkou intersection — an area that historically attracts selling pressure. This keeps the current price action more aligned with a supply retest rather than the beginning of a genuine bullish trend.
In summary, gold is facing an important test. The 4,235–4,245 region remains the key barrier: a breakout could quickly extend momentum toward 4,260–4,285, while another rejection could push XAUUSD back toward 4,190 to collect liquidity before deciding on its next direction.
Gold Surges on Weak US Data but Momentum FadesHello everyone,
Last night, spot gold on the international market saw a sharp rally of several dozen dollars per ounce after the US released a series of economic reports that came in weaker than expected — particularly labour market data, which strengthened expectations that the Fed may accelerate its rate-cutting path. This is generally positive for gold, as lower interest rates reduce the opportunity cost of holding non-yielding assets.
However, shortly after the breakout, the market witnessed a large wave of profit-taking from institutional investors, causing gold to reverse and drop sharply.
The downside pressure did not come solely from profit-taking; it was also reinforced by a US economic backdrop showing mixed and increasingly unstable signals: weak employment data, slowing growth prospects, and rising expectations of imminent Fed rate cuts. These factors have left capital flows uncertain — torn between holding gold for safety or shifting toward risk assets as US equities recover slightly.
From my perspective, gold is now standing at a critical crossroads:
Weak US data could support another upward leg.
A dovish Fed remains a strong underlying foundation.
But persistent profit-taking may prolong the short-term correction.
Gold’s next move will depend heavily on upcoming US economic releases this week and how the market reacts to shifting expectations around the Fed’s monetary policy.
Wishing everyone a clear-headed and successful trading day ahead!
Gold: Bullish Fundamentals, but Technicals Still Blocking the BOHello everyone, gold continues to gain support from macro data after the ADP report showed a surprise loss of 32,000 private-sector jobs, strengthening expectations of a 0.25% Fed rate cut in the December meeting. This normally benefits gold as USD and yields cool down.
However, the chart still refuses to confirm any breakout. Price remains compressed inside 4,195–4,205 with low volume, sitting right on the Ichimoku cloud. Overhead resistance/FVG 4,215–4,225 and support at 4,180 keep price locked in a tight 4,180–4,225 range.
Ahead of today’s PCE data, gold is likely to stay boxed in until the market receives a stronger catalyst from PCE or the Fed.

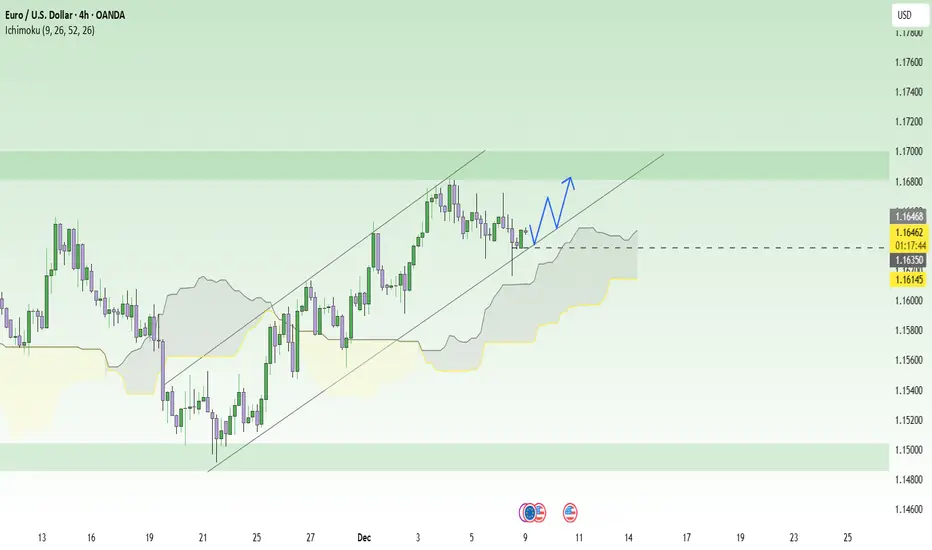
Waiting for the Fed: EURUSD set to explode!When the entire market is focused on the upcoming Fed meeting , EURUSD looks like an athlete that has fully warmed up and is just waiting for the starting whistle. The current context slightly favors the euro, as the Fed is expected to cut rates soon after a series of weakening labor data, while Eurozone GDP and inflation remain relatively stable. With U.S. interest rates trending lower and the ECB not too dovish, conditions are quite supportive for the euro to regain strength against the USD.
On the H4 chart, price has repeatedly bounced from the lower boundary of the ascending channel and the Ichimoku cloud, showing that the main trend is still upward. The area around 1.1630 acts as a near support level, aligning with the trendline and the upper edge of the cloud, meaning any pullback here is more of a buying opportunity rather than a reversal signal.
The preferred scenario is that if price holds above 1.1630 and forms a strong bullish candle, EURUSD may continue climbing towards 1.1680, which is the previous high and a short-term resistance zone. In short, with both fundamentals and technicals aligned, the sensible strategy right now is to wait for a retest of support to buy with the trend, instead of trying to call a top in a market still driven by bullish fundamentals .
ETH Pauses as Market Awaits Fed SignalETH on the H4 timeframe is moving sideways between 3,080–3,130 after a strong rebound from 2,750–2,800, signaling a shift into consolidation rather than continuation. The current zone overlaps a previous high-volume distribution area, while a flat Ichimoku cloud reflects indecision. Price hasn’t broken past the last high, and the lower FVG at 2,980–3,050 may still attract a retest. A clean breakout above 3,150–3,200 is needed to confirm upside momentum; until then, ETH remains in wait-and-see mode ahead of the Fed.
