GOLD (XAUUSD) – Decision Zone Ahead | Bulls Holding DemandTVC:GOLD
Market Overview
Gold has shown repeated rejections from the demand base, confirming aggressive buyer interest.
Every retest of the yellow box created higher lows, showing accumulation before a potential expansion toward new highs.
If bulls hold above 4 200, continuation toward the 4 228–4 235 zone (previous all-time-high region) is expected.
Key Scenarios
✅ Bullish Case 🚀 → 🎯 Target 1 4 218 | 🎯 Target 2 4 230 | 🎯 Target 3 4 240
❌ Bearish Case 📉 → Rejection from decision zone → Retest of 4 185 then 4 165
Current Levels to Watch
Resistance 🔴 4 218 – 4 230
Support 🟢 4 185 – 4 165
⚠️ Disclaimer: This analysis is for educational purposes only. Not financial advice.
Buy-setup

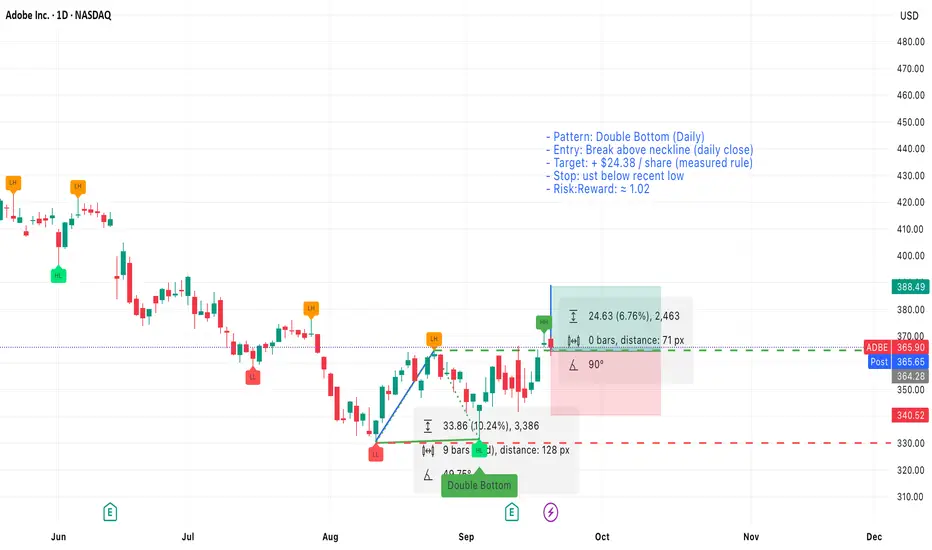
Adobe (ADBE) — Daily — Double BottomSetup
Pattern: Double bottom on the daily chart with two clear lows and a visible neckline.
Timeframe: Daily
Measuring rule (target)
Measure the vertical distance from the bottoms to the neckline and add it to the breakout point. Using this method the measured target equals +$24.38 per share from the breakout.
Entry & trigger
- Enter long on a confirmed close above the neckline (daily close above neckline).
- If you prefer an earlier entry, a volume-backed intraday break above the neckline can be used, but prefer a daily close for confirmation.
Stop loss
- Place stop loss just below the recent low (the second bottom). Use a few cents/pips buffer below that low to avoid noise.
Position sizing & risk
- Risk per share = entry price − stop loss price.
- With the stop placed just below the recent low, risk per share is small and gives a risk/reward ratio ≈ 1.02 .
Given the measured target of +$24.38, ensure your entry and stop sizing produce the stated R:R — example calculations below.
Notes & trade management
- Prefer a daily close above the neckline with increased volume for higher probability.
- If price returns to retest the neckline, consider adding only if support holds and risk remains acceptable.
- Trail stop to breakeven after a significant portion of the measured move is achieved (for example, after +50% of the $24.38 move).
BTCUSDT.P | 110kHello everyone, this is The Dark Analysis, let's have a look at BTCUSDT.P together.
I suggested you open a long position on BTCUSDT.P after 1m breakout.
you can see the result on the picture above.
NEW ENTRY
If you have missed this opportunity, you can open a buy position on BTC at this area:
5m-15m Order Block at 107428.7-106936.8
- SL :106887.8
- TP : Previous high
CONDITIONS
-The price most reach this zone with weak momentum.
-There must be a dogi or engulf candle after touching that very zone.
Don't be shy and feel free to tell me your ideas in comments.

EUR-USD Strong Support Ahead! Buy!
Hello,Traders!
EUR-USD keeps falling down
And the pair is locally oversold
So after it hits the horizontal
Support level of 1.0647 I think
That we will see a local rebound
Buy!
Like, comment and subscribe to help us grow!
Check out other forecasts below too!

GBPAUD BuyThis Pair has much potential to become a Buy setup and hit around the 1.99000 area.
The previous Daily candle was a Break of Structure for the 4-hour timeframe, but we'll know to buy if it closes above 1.97282. (As is doing as I'm writing this.)
I'll get on this trade after it closes so I'll probably wait an hour, we need a solid close.
SL would be around 1.96666(spooky)
TP would be 1.98250

DXY - Bullish until FED announcement?LTF entries are still valid if you missed a long entry upon daily liquidity sweeps.
I anticipate DXY to remain bullish until the rates are announcement on July 26th.
Inflation rates are expected to rise, which would attract a bearish order-flow. Nearer the end of July, I will be looking for bearish indications and re-evaluate my current bias.

EURUSD - Buy Setup PendingAwaiting 1.081 sell-side liquidity to be swept.
I anticipate bullish momentum from there with targets of Asian/London highs.
This will partially fulfil fair value gaps in the process.
DXY is currently losing bullish momentum.
This is not financial advice. Do your own due diligence!

DXY Local Long! Buy!
Hello,Traders!
DXY will go up I think
Because the index is
Somewhat oversold and
Has retested a horizontal
Support of 102.1 so a local
Bullish correction is likely
Buy!
Like, comment and subscribe to help us grow!
Check out other forecasts below too!

✅DAX NEXT MOVE UP|LONG🚀
✅DAX is trading in an uptrend
And is still consolidating above
The horizontal support line of 15.600
But I am bullish biased so I think
That it will go up eventually
LONG🚀
✅Like and subscribe to never miss a new idea!✅

✅NZD_USD BUYING OPPORTUNITY|LONG🚀
✅NZD_USD will be retesting a support level of 0.609 soon
From where I am expecting a bullish reaction
With the price going up but we need
To wait for a reversal pattern to form
Before entering the trade, so that we
Get a higher success probability of the trade
LONG🚀
✅Like and subscribe to never miss a new idea!✅

EUR-USD First Down Then Up! Buy!
Hello,Traders!
EUR-USD is trading in an
Uptrend and the pair made
A strong move up last week
From the rising support
And we are now seeing a
Local correction which
Might take the price back
Down to retest the rising
Support from where I believe
We will see further growth
And a retest of the local
Resistance above at 1.107
Buy!
Like, comment and subscribe to help us grow!
Check out other forecasts below too!

✅NATGAS WAIT FOR BREAKOUT FROM THE RANGE|LONG🚀
✅NATGAS was trading in a
Downtrend but then the pair hit
The support level of 2$ and
Formed a parallel range
So IF we see a bullish
Breakout from the range
I think we will see further growth
LONG🚀
✅Like and subscribe to never miss a new idea!✅

AUD-NZD Breakout Long! Buy!
Hello,Traders!
AUD-NZD broke the falling
Resistance line and the
Breakout is confirmed
Thus, a bullish continuation
Is to be expected
(Please don't risk more than 0,5% per trade today)
Buy!
Like, comment and subscribe to boost your trading!
See other ideas below too!

✅DXY LONG FROM SUPPORT🚀
✅DXY is approaching a demand level
So according to our strategy
We will be looking for the signs of the reversal in the trend
To jump onto the bullish bandwagon just on time to get the best
Risk reward ratio for us
LONG🚀
✅Like and subscribe to never miss a new idea!✅

✅EUR_USD POTENTIAL LONG🚀
✅EUR_USD is going up currently
And the pair broke the key structure level
Which is now a support, and has made a pullback
And the retest, so I think the price will keep going up now
LONG🚀
✅Like and subscribe to never miss a new idea!✅

✅NZD_JPY BULLS WILL WIN|LONG🚀
✅NZD_JPY is about to retest a key structure level
Which implies a high likelihood of a move up
As some market participants will be taking profit from short positions
While others will find this price level to be good for buying
So as usual we will have a chance to ride the wave of a bullish correction
LONG🚀
✅Like and subscribe to never miss a new idea!✅

GBP-CHF Bullish Rebound Ahead! Buy!
Hello,Traders!
GBP-CHF is already growing
Because a strong horizontal
Support was retested so
I think that the price
Will grow a bit more
Buy!
Like, comment and subscribe to boost your trading!
See other ideas below too!

✅EUR_NZD GROWTH AHEAD|LONG🚀
✅EUR_NZD will keep growing
Because the pair is in the uptrend
And recently broke the key level
So we will be expecting
Bullish continuation
LONG🚀
✅Like and subscribe to never miss a new idea!✅

✅AUD_NZD BREAKOUT|LONG🚀
✅AUD_NZD is going up currently
And the pair broke the key structure level
Which is now a support, and after the pullback
And the retest, I think the price will go up
LONG🚀
✅Like and subscribe to never miss a new idea!✅

✅NZD_USD ELEGANT LONG🚀
✅NZD_USD has been falling recently
And the pair seems locally oversold
So as the pair has approached a horizontal support
Price growth is to be expected
LONG🚀
✅Like and subscribe to never miss a new idea!✅

✅EUR_CAD POTENTIAL LONG🚀
✅EUR_CAD went down to retest a horizontal support
Which makes me locally bullish biased
And I think that a move up
From the level is to be expected
Towards the target above
LONG🚀
✅Like and subscribe to never miss a new idea!✅

GALAUSDT might moon very soonSo far so good. We can see some bullish consolidation at 0.0427 — 0.0428 and now keep going straight up.
Breaking a large fractal of 0.0558 will affect up movement to lead us in the area of 0.0728
Anyway, the market decides. But after we reach 0.0728 there is a very powerful resistance and we should be very patient at this point.
If we break 0.0728 next station is 0.09

✅NZD_CHF POTENTIAL LONG🚀
✅NZD_CHF is trading in an uptrend
Along the rising support line
Which makes me bullish biased
And the pair is about to retest the rising support
Thus, a rebound and a move up is expected
With the target of retesting the level above
LONG🚀
✅Like and subscribe to never miss a new idea!✅
