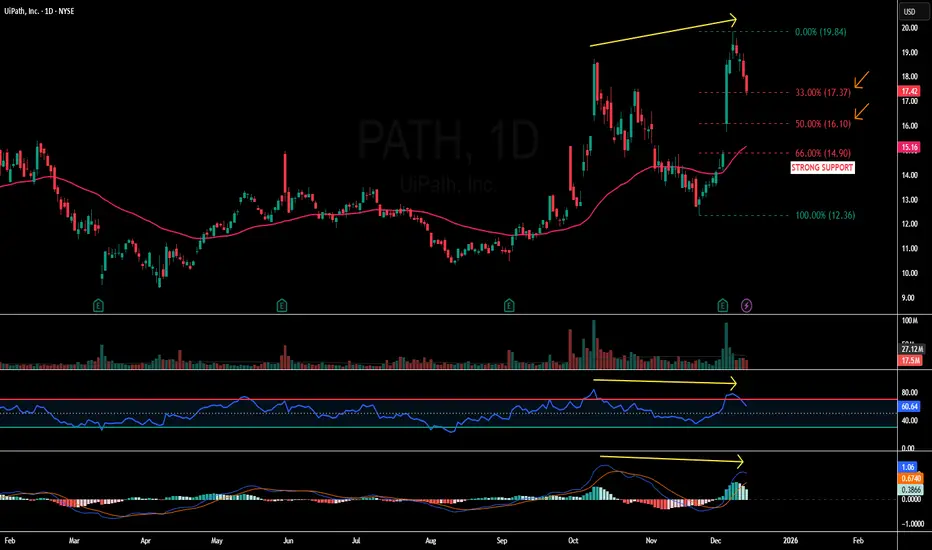
PATH - 14.90 – The Line That MattersPATH - CURRENT PRICE : 17.42
UiPATH (PATH) – Previous Targets Achieved, Buy-on-Dips Setup After Healthy Pullback
The previous technical buy call on UiPATH has successfully achieved all stated upside targets (refer to the earlier analysis via the shared link for reading context). Following this strong rally, the stock has now entered a pullback phase, which is technically expected after an extended upside move.
The current retracement is accompanied by a bearish divergence between price and momentum indicators (RSI & MACD) , as highlighted by the yellow arrows on the chart. Bearish divergence occurs when price makes a higher high while momentum indicators fail to confirm with higher highs, often signaling short-term exhaustion and a corrective move rather than a trend reversal. This explains the ongoing pullback and supports the view that the decline is corrective in nature.
From a structural perspective, the pullback remains constructive and healthy. Price has retraced approximately 33% of the prior advance, which aligns well with Dow Theory, where strong trends commonly retrace one-third or one-half before resuming the primary trend. Importantly, price continues to trade above the 50-day EMA, while both RSI and MACD remain in bullish territory, indicating that the broader bullish momentum is still intact despite near-term consolidation.
A critical level to watch is 14.90, which serves as STRONG SUPPORT. This level represents a two-thirds (≈66%) retracement under Dow Theory, coincides with a previous gap-up demand zone, and is located near the rising 50-day EMA, creating a strong confluence of technical support.
Trading Plan (Buy-on-Dips Approach):
At current levels, traders may consider initiating HALF of the intended position.
If price retraces further toward the 50% retracement level, the remaining half position may be added, as this remains a healthy pullback within an uptrend.
A decisive break below 14.90 (66% level) would invalidate the setup and should be treated as a cut-loss level.
As long as price holds above this support zone, the pullback can be viewed as a buy-the-dip opportunity, with the potential for the primary uptrend to resume.
FIRST TARGET : 18.50
SECOND TARGET : 19.80
SUPPORT : 14.90
Buyondips
IQV - BUY ON DIPS IQV - CURRENT PRICE : 184.08
From May to July, IQVIA (IQV) staged a strong upward rally, supported by rising volume. Following this advance, the stock underwent a healthy retracement, consolidating recent gains without breaking its long-term uptrend. Take note that the up trendline is still intact.
Currently, price action shows signs of support around the Fibonacci 38.2% retracement level , coinciding with both the Ichimoku Cloud and the 50-day EMA . This confluence suggests the retracement phase may be complete, presenting a good opportunity to apply a Buy on Dips strategy as the stock prepares for its next upward leg.
ENTRY PRICE : 183.50 - 184.50
TARGET : 205.00 and 215.00
SUPPORT : 166.00

Weekly Market Outlook | Nifty · BankNifty · S&P 500Nifty closed 25,285 (+390 pts) after making 25,330 / 24,881 — once again perfectly respecting my range of 25,300–24,500! 💪
As expected, BankNifty confirmed its W-pattern breakout, jumping 2% — strength clearly visible in the PSU bank pack.
Next week focus
• Above 25,450 → breakout toward 25,700+
• Below 25,130 → selling pressure till 25,000 / 24,850
Range for the week: 25,700–24,850
Shorters, stay patient — only if BankNifty cracks 55,700 does weakness confirm. Till then, it’s buy-on-dips for me.
Global cue: Trump’s proposed 100% China tariff shook US & crypto markets — watch its spillover effect on sentiment.
S&P 500 closed 6,552 (-160 pts). Holding above 6,360 = buy-on-dips;
Above 6,625 → uptrend resumes.
Below 6,360 → correction toward 6,225 / 6,142 / 6,100.
Exciting week ahead for both momentum traders & option sellers!

Buy on DipsShort to Medium Term ULTIMATE TARGETS CAN BE 25 - 26
& Then 40 -45
Best Buying Price would be around 11 - 12 (if it comes).

DBCORP: Positive Trend with Buy Opportunity on DipsNSE:DBCORP : Positive Trend with Buy Opportunity on Dips
NSE:DBCORP is exhibiting a positive trend, but careful attention is needed around key levels due to possible trapped trader zones. A buy-on-dip strategy near support may provide an optimal entry point.
Support Zone: 335 – This is a strong area to consider buying on dips, with the last stop-loss set at 325 for risk management.
Resistance Levels: 375 / 396 – Resistance here could lead to temporary pullbacks. Watch for a breakout above 396 to confirm strong bullish continuation.
Price Action: The stock's behavior suggests some trapped traders, so it's essential to monitor price action closely for false breakouts. A buy-on-dip strategy near the 335 support could offer good risk-reward opportunities if the trend holds.
Disclaimer: I am not a SEBI-registered Research Analyst. This analysis is for educational purposes only. Please perform your own research or consult a financial advisor before taking any trading decisions.

Bank Nifty Taking SupportBank Nifty taking exact support from my support level 39424. BUT Still Sell on rice present.

Nykaa down 50% from highs, good buy on dips stockNykaa is one of India's leading specialty beauty and personal care companies and also forayed into the fashion segment, which is now a significant part of the Nykaa business.
It has acquired 6.6 million new customers this year .
Nykaa is working on faster delivery of packages to the customers by opening new regional warehouses, making investments in rolling out new stores, and also spending heaving on customer acquisition marketing.
Nykaa is also invetsing in new business like EB2B business as Nykaa Man.
Coming to technicals
The Current price of NYKAA is Rs. 1401.45.
Nykaa has fallen approx 50% from its all-time high, but still manages to trade above its IPO price
The stock took support near 1219 levels once in Feb 2022 and in May 2022 making it a double bottom formation.
Double bottom - Forms at the bottom and indicates the end of the falling price.
Stock is holding comfortably above 1200 levels and any dips towards it can be an opportunity to go long in the stock.
.

CHPT Buy on DipsNYSE:CHPT
Enter Criteria
1) MA Shade Green = Uptrend
2) Share Price Above EMA 50 Bullish
3)FiFT +ve Strong Bull
4)Faster Turtle Buy
5)MCDX Banker 63% (Banker in Control)
6)Atom bounce from middle of river
7)Risk 6 to 7 %
8)Buy on Dips Type 1 Strategy

WCT Holdings Berhad - Buy on DipAfter reach its first 52WH at 0.650, it went for a short term pullback and resting at previous resistance at 0.620.
New support 0.620.
Start my entry at 0.630 and now reaches 0.680. = 7.8%
classic technique on Buy on Dip.
X to X TP = 0.90
Complete Cup and Handle. Now on its way to Mark up phase.

(EL) Trend Rider 131. Weekly in wave 4, reversal signal spotted at D1/H4. Wave 2 quite long expecting Wave 4 sharp.
2. Price action at EMA 10>EMA40>EMA 200.
3. Bursa Marketplace rating 7 (Mom 10), isaham 8.7, i3 ATP 1.48.
4. From "Simple EMA 30 cross" screener.


MINDTREE - BREAKOUT CANDIDATE/BUY ON DIPSStock finally broke the resistance that it had been resisting for weeks.
Now the 915-930 is an important support levels, if the stock sustains above those levels, it might be moving towards 1020-1030 levels
CMP 949
Buying zone : 915-930
Stop : 885
Trade type : Swing
Risk/Reward : 3R
Do not follow blindly and If my Posts are useful to you , please also share it with others as an appreciation.

BHARAT FORGE - Self Explanatory chartsBHARAT FORGE - Self Explanatory charts
If the stock has reversed , then any dips/correction in the stocks will be absorbed in the 280 - 310 zone.
Trade type : Positional
if Breaks out - above 400
if Corrects - in the range of 280-310
This view will be negated below 260 levels.

BANKNIFTY - Levels for TomorrowThere is a probability of Bat pattern on the banknifty Intracharts and the bat pattern prz is aligned with the major resistance of banknifty around 21060 levels
The support for index is around 20200 levels , hence watch price action near those levels, if we any correction in tomorrow session.
As per charts, if any correction if so happens in the index would most likely get absorbed.

NIFTY - 10450- 10550 still on the cardsAs long as nifty is holding 10140 -10120 levels , the probability of its moving towards 10450-10550 is still on the cards
hence its buy on dips as long as its holding 10120 on intraday basis and 9940 on weekly basis.

DABUR - Time to BounceThe Trendline breakout has been seen on the dabur intra charts and the said breakout is followed by the trendline retest.
The Trendline which was earlier working as resistance are now supposed to be working as support.
The said trenline support is aligned with the harmonic cypher pattern support@ 460 levels.
This is small risk trade with a stop at 452 levels, with a initial target of 475 and 490 levels.

Nifty Pharma - Bull Territory - BTFD - Above 9400 levelsNSE:CNXPHARMA has come into the bull territory, one may use the opportunity to buy on dips whenever it happens.

HDFCBANK - Buy on Dipsif stocks sustains 9060-9030, its probably heading towards 1060 levels on the upside.

DABUR - BUY ON DIPSDABUR - BUY ON DIPS
Currently overextended, immediate resistance at 470.
Looks like it will consolidate for a while, to relax its overbought readings.
Watch price action in the range of 460 to 440 for timing the entry.
The said view will be negated below 430 levels.
