WCTAlgo TradingSystem by Remisier CheDin
The current market conditions, as identified by my algorithmic system, indicate potential upward signals. These signals include increased trading volume, an upward trend with prices above the EMA20 and EMA50. Consequently, the present conditions suggest a possi
Next report date
—
Report period
—
EPS estimate
—
Revenue estimate
—
−0.16MYR
−254.15 MMYR
1.73 BMYR
847.21 M
About WCT HOLDINGS BERHAD
Sector
Industry
CEO
Tuck Fook Lee
Website
Headquarters
Petaling Jaya
Employees (FY)
2.24 K
Founded
1981
ISIN
MYL9679OO001
FIGI
BBG000DZ8NN3
WCT Holdings Bhd. is an investment holding company, which engages in the provision of management services to the subsidiaries, joint ventures, and associates. It operates through the following segments: Engineering and Construction; Property Development; and Property Investment and Management. The Engineering and Construction segment includes engineering works specializing in earthworks, highway construction, and related infrastructure works. The Property Development segment is involved in the development of residential and commercial properties. The Property Investment and Management segment focuses on holding and managing assets for capital appreciation and rental income. The company was founded by Chwee Lai Wong, Sewe Wing Wong, Soon Huat Chan, and Kim Hwa Taing on January 14, 1981 and is headquartered in Petaling Jaya, Malaysia.


WCT, Uptrend based on AlgoSignal Strategy The current point exhibits upward signals according to my algorithmic system, meeting various criteria. These include rising trading volume, an upward trend indicated by prices above EMA20 and EMA50, and the closing price surpassing VWAP. As a result, the present conditions suggest a potential upwa

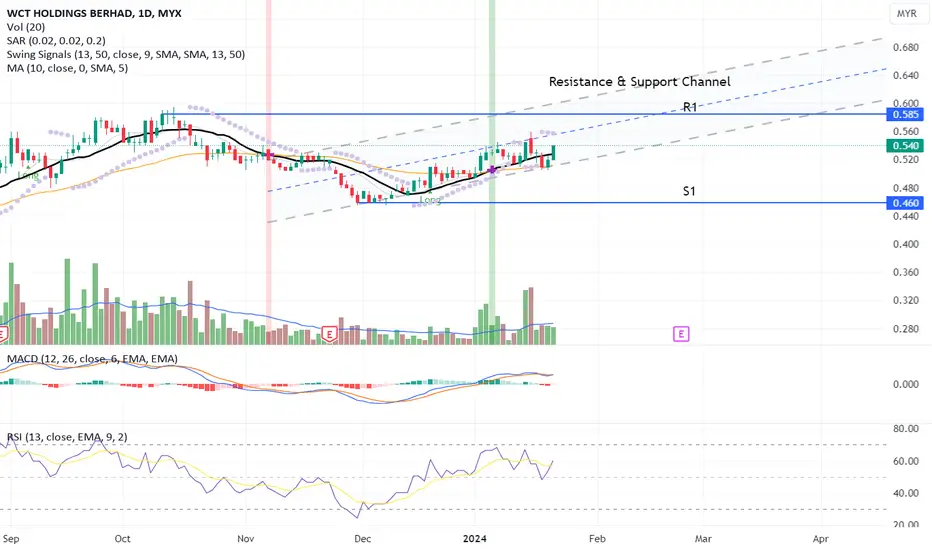
Consistent Uptrend Momentum!The candlestick indicates a price fluctuating between consistent highs and lows as indicated by the resistance and support channel whereas the channel benefits as a guideline to predict price peaks and troughs. The price is within the lower channel and provides a buying opportunity.
From the previ
WCT, come back or...?>> Possible for it to break above FVG?
>> Need to break the Parallel Channel too.
>> Stochastics is OB. May pullback and find strong support around 470 are.
When the market moves where, and how, and if - these are all unknown. The only thing which we can control is our risk. Focus on risk managemen

WCT - TA1. Price candle break out MA 200 on 29 Mar '23 give strong signal the price movement may change direction to bullish soon.
2. Price candle testing MA 200 on 9 May '23 to 3 July '23 to shake out weak retailers. Price candles break out MA 200 again on 4 July '23.
3. GC (Golden Cross) MA 50 & MA 20 hap


long WCT head and shoulder breakout in weekly chart. long the counter at this right timing. monitor the volume carefully, need more volume to push up.

WILL WCT FORM A BUTTERFLY PATTERN?Wathout if price BO from point B.
It will formed Bearish Butterfly Pattern when price achieve at point D and price should not below from point C.
#TAYOR MYX:WCT

<TradeVSA> Breakout is coming for Syscorp ?Sign of Strength in the chart:
1. Pocket Pivot with low volume pullback
2. Reaccumulation stage
3. Green Pentagon in Weekly Chart
Disclaimer
This information only serves as reference information and does not constitute a buy or sell call. Conduct your own research and assessment before deciding to

See all ideas
An aggregate view of professional's ratings.
Trade directly on the supercharts through our supported, fully-verified and user-reviewed brokers.


Frequently Asked Questions
The current price of WCT is 1.25 MYR — it has decreased by 0.79% in the past 24 hours. Watch WCT HOLDINGS BERHAD stock price performance more closely on the chart.
Depending on the exchange, the stock ticker may vary. For instance, on MYX exchange WCT HOLDINGS BERHAD stocks are traded under the ticker WCT.
WCT stock has fallen by 2.34% compared to the previous week, the month change is a 56.25% rise, over the last year WCT HOLDINGS BERHAD has showed a 171.74% increase.
We've gathered analysts' opinions on WCT HOLDINGS BERHAD future price: according to them, WCT price has a max estimate of 1.52 MYR and a min estimate of 0.95 MYR. Watch WCT chart and read a more detailed WCT HOLDINGS BERHAD stock forecast: see what analysts think of WCT HOLDINGS BERHAD and suggest that you do with its stocks.
WCT stock is 2.44% volatile and has beta coefficient of 2.42. Track WCT HOLDINGS BERHAD stock price on the chart and check out the list of the most volatile stocks — is WCT HOLDINGS BERHAD there?
Today WCT HOLDINGS BERHAD has the market capitalization of 1.79 B, it has increased by 5.69% over the last week.
Yes, you can track WCT HOLDINGS BERHAD financials in yearly and quarterly reports right on TradingView.
WCT HOLDINGS BERHAD is going to release the next earnings report on Aug 27, 2024. Keep track of upcoming events with our Earnings Calendar.
WCT earnings for the last quarter are 0.00 MYR per share, whereas the estimation was 0.00 MYR resulting in a 138.47% surprise. The estimated earnings for the next quarter are 0.01 MYR per share. See more details about WCT HOLDINGS BERHAD earnings.
WCT HOLDINGS BERHAD revenue for the last quarter amounts to 467.40 M MYR, despite the estimated figure of 467.40 M MYR. In the next quarter, revenue is expected to reach 559.23 M MYR.
WCT net income for the last quarter is 16.14 M MYR, while the quarter before that showed −245.92 M MYR of net income which accounts for 106.56% change. Track more WCT HOLDINGS BERHAD financial stats to get the full picture.
Yes, WCT dividends are paid annually. The last dividend per share was 0.00 MYR. As of today, Dividend Yield (TTM)% is 0.40%. Tracking WCT HOLDINGS BERHAD dividends might help you take more informed decisions.
As of Jul 27, 2024, the company has 2.24 K employees. See our rating of the largest employees — is WCT HOLDINGS BERHAD on this list?
EBITDA measures a company's operating performance, its growth signifies an improvement in the efficiency of a company. WCT HOLDINGS BERHAD EBITDA is −41.72 M MYR, and current EBITDA margin is −0.84%. See more stats in WCT HOLDINGS BERHAD financial statements.
Like other stocks, WCT shares are traded on stock exchanges, e.g. Nasdaq, Nyse, Euronext, and the easiest way to buy them is through an online stock broker. To do this, you need to open an account and follow a broker's procedures, then start trading. You can trade WCT HOLDINGS BERHAD stock right from TradingView charts — choose your broker and connect to your account.
Investing in stocks requires a comprehensive research: you should carefully study all the available data, e.g. company's financials, related news, and its technical analysis. So WCT HOLDINGS BERHAD technincal analysis shows the buy rating today, and its 1 week rating is buy. Since market conditions are prone to changes, it's worth looking a bit further into the future — according to the 1 month rating WCT HOLDINGS BERHAD stock shows the buy signal. See more of WCT HOLDINGS BERHAD technicals for a more comprehensive analysis.
If you're still not sure, try looking for inspiration in our curated watchlists.
If you're still not sure, try looking for inspiration in our curated watchlists.