Accumulate for uptrend ! ETH September 01💎 ETH WEEKLY PLAN UPDATE (09/01 )
Medium-term ETH Plan & Trend Outlook
ETH has completed the test of the resistance zone at 4,800 (4k8 resistance DONE) and is currently in a corrective move.
The price is still holding above the 4,200 – 4,215 support zone, which coincides with EMA89, showing that this is an important medium-term demand area.
As long as ETH stays above 4,200, the main trend remains bullish, with the next target aiming toward 6,000 (Fib 2.618 resistance + strong supply zone).
Key Support Zones:
• 4,200 – 4,215 → short-term demand, main support pillar.
• 3,600 – 3,620 → medium-term support (EMA200 + previous breakout).
• 3,200 – 3,216 → deeper support if 4,200 breaks.
• 2,500 – 2,520 → long-term support, major base zone.
Key Resistance Zones:
• 4,800 – 4,825 → short-term resistance, recently tested.
• 6,000 – 6,050 → medium-term bullish target, strong supply zone.
Trend Outlook:
ETH is currently undergoing a healthy correction after a 5-wave rally.
• The positive scenario: price holds above 4,200, then rebounds to retest 4,800, and if it breaks, the uptrend could extend to 6,000.
• The negative scenario: if 4,200 breaks, the market could retrace to deeper support levels at 3,600 or 3,200 before forming the next bullish wave.
Buysignal

Uptrend in EURUSDYesterday, EURUSD continued its rise and maintained the bullish trend.
The target remains a breakout above the recent highs after a correction.
On Monday, the U.S. observes Labor Day, which usually means lower liquidity and limited market moves.
All positions should remain in line with the trend!

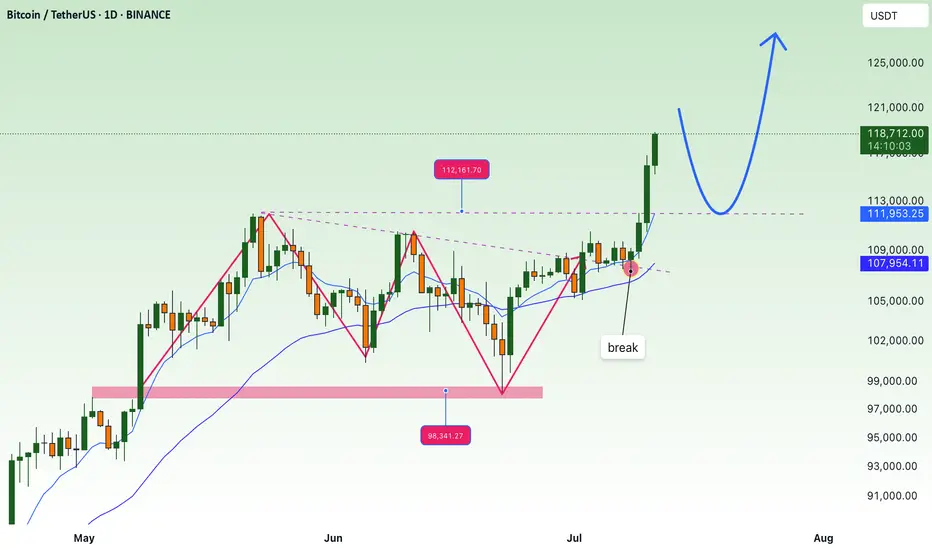
BTC is correcting down, accumulating around 110k💎 MID-WEEK BTC PLAN UPDATE (27/08)
📌 BTC Plan Update
BTC has followed the expected scenario:
We successfully shorted at the 117K resistance zone – where the Fibonacci 0.236 level aligned with a strong previous resistance area.
After that, price dropped sharply to the key support zone at 108K, where we successfully longed thanks to the confluence of Fibonacci 0.618 – EMA200 – and the demand zone.
Currently, price is reacting around the 111K – 112K range. Although it hasn’t broken out clearly yet, this is a signal that the market may gradually start accumulating again.
➡️ The important thing now is to hold positions and patiently wait for stronger bullish signals at the next resistance zones (114K – 117K) to confirm a recovery trend.
Gold price in uptrend, up to 3405⭐️GOLDEN INFORMATION:
Gold (XAU/USD) slips during Wednesday’s Asian session, retreating from a two-week high near $3,395 amid profit-taking and a modest US Dollar rebound. However, downside risks remain limited by concerns over Fed independence after President Trump intensified efforts to remove a Fed governor, reinforcing Gold’s safe-haven appeal.
Markets now focus on the Russia-Ukraine situation and Friday’s US PCE inflation data. A hotter-than-expected reading could temper Fed rate-cut hopes, while geopolitical tensions may continue to support the yellow metal
⭐️Personal comments NOVA:
Gold price continues to increase in price according to stable trend line. Price range 3352 - 3405
⭐️SET UP GOLD PRICE:
🔥SELL GOLD zone: 3404- 3406 SL 3411
TP1: $3395
TP2: $3383
TP3: $3370
🔥BUY GOLD zone: $3350-$3352 SL $3345
TP1: $3360
TP2: $3370
TP3: $3380
⭐️Technical analysis:
Based on technical indicators EMA 34, EMA89 and support resistance areas to set up a reasonable BUY order.
⭐️NOTE:
Note: Nova wishes traders to manage their capital well
- take the number of lots that match your capital
- Takeprofit equal to 4-6% of capital account
- Stoplose equal to 2-3% of capital account

LONG ON USD/CADUSD/CAD is in a Major Demand Zone and has rejected it nicely.
I will be buying USD/CAD looking for price to reach the previous high for about 100 pips.

USDJPY BUY SETUP 5 MIN TIMEFRAME4 HR, price is above 10 20 EMA. 30 min price is hitting off EMA. There is also a trend breakout. Waiting for 5 min timeframe price to fill imbalance and move in uptrend. closing half trade at imbalance 148.919 and rest at 1:4rr.

AIRLINKAIRLINK – Daily Chart: Descending Channel Breakout Setup 📉➡📈
Technical Picture
Price has been respecting a downward-sloping channel for several weeks
The lower highs and lower lows defined the downtrend until recently. breaking out!
Now,
Breakout confirmation: 🚀
Upper Cap done!
Volume expansion on breakout day
Buy on retracement or use buy stop order 140 150 or buy agressively from CRP (current market price)
Retest buy zone: PKR 138–140 after breakout 🛡
Short-term target: PKR167 🎯
Medium-term target: PKR 180 and 186 if momentum holds ⛰
Medium-term target: PKR 200 and 228 if momentum holds ⛰
Fundamentals Still Solid & Confirmed
Xiaomi Smart TVs: Local assembly started Jan 2025 via subsidiary Select Technologies.
Earnings: FY24 Revenue +162%, PAT +242%, EPS Rs 7.74, Dividend Rs 6.
Product Range: Samsung, Xiaomi, Apple, Tecno, Acer, wearables — keeps diversification strong.

D-Mart Breakout 📢 PJV FINANCIAL – 1-2 DAYS TECHNICAL CALL 📢
🔷 SCRIPT: DMART
🔷 Action: BUY above ₹4260
🔷 Stop Loss: ₹4180 (📉 -1.88%)
🔷 Target: ₹4420 (📈 +3.76%)
🔷 Risk–Reward Ratio: 1 : 2.00 ✅
📌 Short-term momentum trade idea – strictly follow SL.
🚀 #PJVSignals | 💼 #TechnicalCall

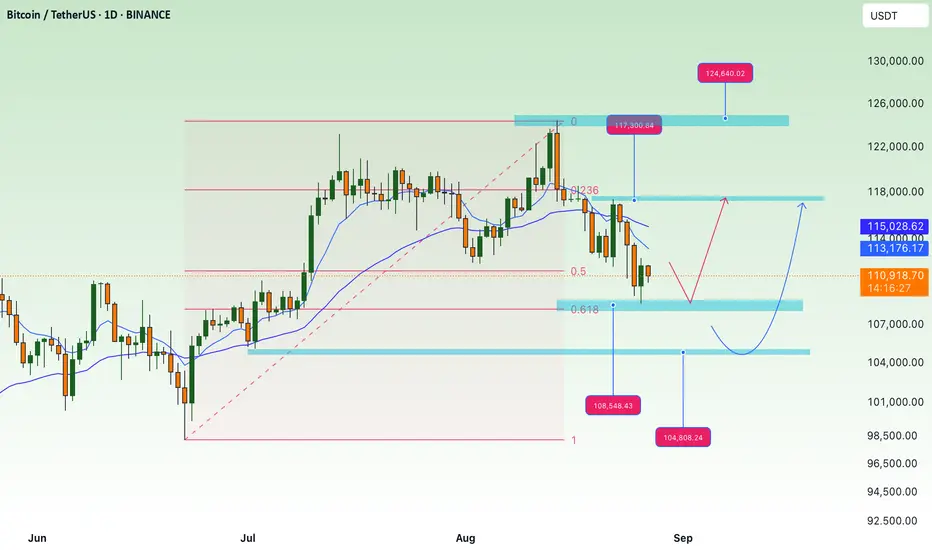
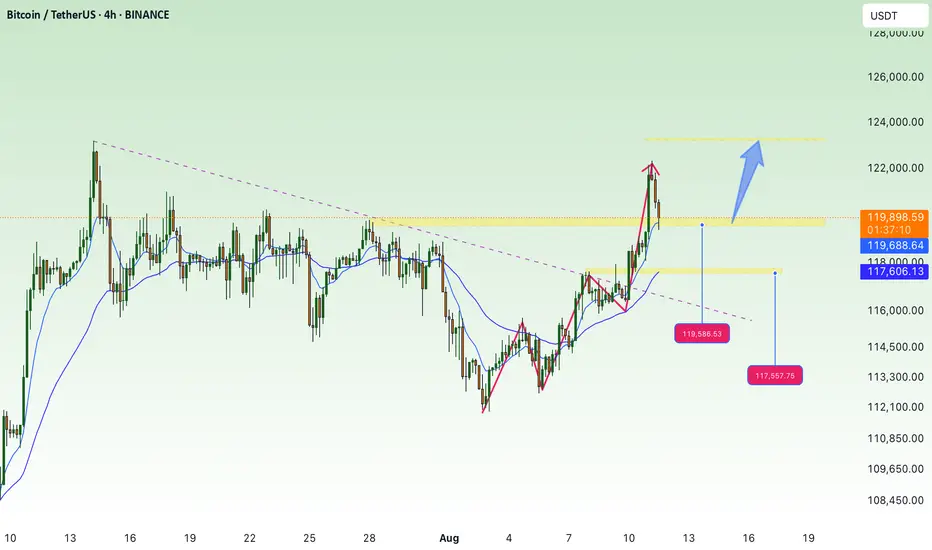
continue to increase in price, towards old ATH💎 BTC WEEKLY PLAN UPDATE (11/08)
1. Overall Trend:
BTC has completed a 5-wave Elliott impulse and is currently in a corrective phase after wave (5).
The main trend remains bullish, as the wave structure has not broken and price is still above key EMA lines.
2. Fibonacci Levels:
The current correction may retrace to the following Fibonacci support levels:
• 0.382 Fibo: ~118,800 USD (aligns with strong support)
• 0.5 Fibo: ~117,800 USD (close to EMA and trendline)
These are potential price zones where the market may rebound.
3. Support & Resistance Zones:
• Near-term Support: 118,000 – 117,500 USD (combination of Fibo + EMA + broken trendline).
• Near-term Resistance: 120,000 USD (previous high).
• Next Resistance: 122,000 – 123,000 USD (Fibo extension target 2.618).
4. Main Scenario:
BTC retraces to 118K – 117.5K → rebounds → breaks 120K → moves towards 122K – 123K.
5. Trading Notes:
• Prioritize entries when price reacts well at 118K – 117.5K support zone.
• Stop loss if H4 closes below 117K.
• Stay patient, as corrections are normal before the next upward move.
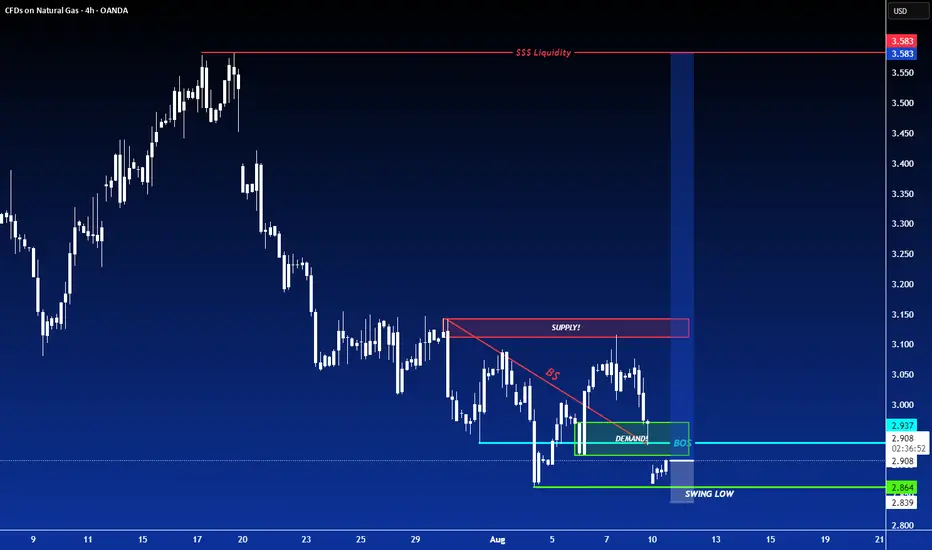
LONG ON NATURAL GASNatural gas has given us a nice CHOC (change of character) to the upside to start a upward move from a major demand zone.
I will be buying natural gas to the next level of supply.
Gold price continues to increase above 3400, next week✍️ NOVA hello everyone, Let's comment on gold price next week from 08/11/2025 - 08/15/2025
⭐️GOLDEN INFORMATION:
Spot gold held steady on Friday, while futures surged to a record high of $3,534 following reports that the United States will impose tariffs on imported gold bars. Traders also continued to digest recent U.S. economic data as they looked ahead to next week’s key inflation release. XAU/USD last traded near $3,397, little changed on the day.
Overnight, the price spread between New York COMEX futures and spot prices widened by more than $100, Reuters reported, after the Financial Times revealed that the U.S. had levied tariffs on one-kilo gold bars, citing a letter from U.S. Customs & Border Protection.
⭐️Personal comments NOVA:
Gold price accumulates around 3400, buying power remains good as interest rate cut expectations approach
🔥 Technically:
Based on the resistance and support areas of the gold price according to the H4 frame, NOVA identifies the important key areas as follows:
Resistance: $3418, $3437, $3500
Support: $3344, $3310
🔥 NOTE:
Note: Nova wishes traders to manage their capital well
- take the number of lots that match your capital
- Takeprofit equal to 4-6% of capital account
- Stoplose equal to 2-3% of capital account
- The winner is the one who sticks with the market the longest

3rd Wave About to Start in Ingersoll Rand (IR)Good looking Elliott Wave setup in NYSE:IR
Stock rose in clean 5 waves impulse wave followed by 3 waves down in ABC to almost exactly at 61.8% level around 75. If the wave C low 73.87 holds then we can expect another 5 wave rise in larger (3) or (C) on the upside. As per wave equality principle, we can expect it to be same in size as the previous 5-wave rise seen in the chart. That gives a potential target of 98.7 for current levels. 1.618 times of the move is at 114.04 which could be second (extended) target.
Note that invalidation level for this setup is wave C low at 73.87.

USDCHF 5 MIN TIMEFRAME BUY POTENTIALImpulse correction impulse trading. 4hr 10 and 20 EMA on uptrend, 30 min timeframe hitting off the emas. Currently on correction on 5 minute timeframe waiting for price to fill imbalance before breaking up. 1:4RR trade!

LONG ON EUR/USDEUR/USD is currently at a major demand level after sweeping sell side liquidity.
The Dxy (Dollar) is overall bearish. I expect the dollar to fall and EUR/USD to rise to the previous high / supply level for over 200-300 pips.
News most likely will affect this pair in terms of volatility.

LONG ON NZD/USDNZD/USD is at a major demand level.
Dollar is bearish. Economic News this afternoon should assist and pushing this pair up.
Looking to catch 200 pips to the previous high.

Short term buying opportunity Silver Futures ComexRecent weakness in silver futures could be an buying opportunity on 3 hour candel chart.
Wait for both indicators below to reach oversold levels like it is showing now. Long term 1 day chart showing long term bull trend with much higher upside. I expect silver prices to remain in uptrend. All time highs could be reached in 6 to 1 year period from now.

LONG ON GBP/AUDGA has given us a CHOC (change of character) to the upside after making a new low.
Price has since pulled back to the demand area that created that change leaving us with a possible double bottom forming.
I expect GA to rise to sweep buy side liquidity at the equal highs then reaching the previous supply level / previous High.
Looking to catch 200-300 pips.

LONG ON GBP/CADGBP/CAD is now at a major key area/demand zone after completing its pullback phase.
I expect price to now rise to the next level of supply or previous high.
looking to catch 200-400 pips throughout the week.

LONG ON USOIL OIL has just completed a sweep of sell side liquidity, leaving behind lots of BUY side liquidity.
DXY is falling on top of economic news stating trump will possibly fire Jerome Powell.
All this with OPEC increase oil production.
I expect oil to make a $5-$10 move throughout the rest of the week.
That's 500-1000 pips!

3380 gold price recovered at the beginning of the week⭐️GOLDEN INFORMATION:
Gold prices (XAU/USD) trade with modest gains around $3,350 in early Asian hours on Monday, supported by persistent uncertainty surrounding global trade negotiations as the US tariff deadline approaches. Lingering concerns over fresh levies are likely to sustain demand for the safe-haven metal. Investors now look ahead to comments from Federal Reserve (Fed) Chair Jerome Powell, scheduled for Tuesday, for clearer policy direction.
On Sunday, US Commerce Secretary Howard Lutnick confirmed that August 1 remains the firm deadline for countries to comply with Washington’s tariff demands. While President Trump’s earlier announcements saw shifting deadlines, the White House now insists this date is final. This cloud of uncertainty continues to bolster gold’s appeal as a hedge in volatile markets.
⭐️Personal comments NOVA:
Gold prices continued to recover last weekend, mainly still accumulating above 3300.
⭐️SET UP GOLD PRICE:
🔥SELL GOLD zone: 3380- 3382 SL 3387
TP1: $3370
TP2: $3360
TP3: $3350
🔥BUY GOLD zone: $3322-$3320 SL $3315
TP1: $3333
TP2: $3345
TP3: $3356
⭐️Technical analysis:
Based on technical indicators EMA 34, EMA89 and support resistance areas to set up a reasonable BUY order.
⭐️NOTE:
Note: Nova wishes traders to manage their capital well
- take the number of lots that match your capital
- Takeprofit equal to 4-6% of capital account
- Stoplose equal to 2-3% of capital account

LONG ON GBP/USDGU is currently in its pullback phase of its uptrend.
We have a nice sell side Liquidity sweep being completed at this moment.
Price should now tap into previous demand that broke a high to repeat history and rise again.
Very Nice Setup over 300 pips on the table to the previous high/supply zone.

Golden Bitcoin Signal: A Great Investment Opportunity🔔 Our Bitcoin Investment Bot has issued an exclusive signal! This signal, backed by 15 years of historical data analysis, marks the perfect time to enter the market. 🎯 Take Profit Target: $120,975 (equivalent to a potential 50.5% profit)
⚖️ Professional Risk Management: This signal comes with a Stop Loss at $66,835 (16.8% risk), offering an ideal balance of profit and risk. Our bot, with its advanced and data-driven strategies, identifies the most valuable investment opportunities.
⏳ Opportunities don’t last forever! This signal could be the start of a significant move. Now is the best time to act and take advantage of this precise analysis. With our bot, you’re one step closer to sustainable profitability. 🌟

FOMO price increase, create new ATH💎 Update Plan BTC weekend (July 11)
Continuously creating a new ATH, preparing to have a short sale?
The reinforcement of Bitcoin price around the upper boundary of the previous consolidation area was broken at $ 108,355, which ended on Wednesday. The price has soared to the highest level of the new time of $ 116,868 on Thursday. At the time of writing on Friday, the price is fluctuating above $ 116,600.
When BTC entered the price exploration regime and if the trend of increasing continues, the price can expand the momentum to an important psychological level of $ 120,000.
Technical analysis angle
Our community has continuously chose the trend of increasing as the mainstream for all previous transactions and currently preparing to welcome 120k as forecast.
The relative power index (RSI) on the daily chart reaches 71, higher than the excess buying 70, showing a sharp increase. However, traders should be cautious because the ability to adjust the decrease is very high due to over -purchase. Meanwhile, the average divergence dynamic indicator (MACD) has shown a price intersection at the end of June. The indicator also shows that green histograms are increasing on neutral zero, showing that the rising momentum is being strengthened and continues to increase.
However, if BTC must be adjusted, the price may extend the decline to search and support around the upper boundary of the unified area that has been broken earlier at $ 108,355.
Plan has been constantly accurate in the past 2 months, which is the positive signal of the channel that brings value to the community.
Please follow the channel to receive accurate scenarios about gold and BTC
==> Comments for trend reference. Wishing investors successfully trading