Breaking; Beyond Meat, Inc. (NASDAQ; BYND) Spike 20% TodayBeyond Meat, Inc. (NASDAQ; BYND) Spike 20% Today albeit market turmoil.
The stock is gearing for a move to the $30 resistant should it break the $2 ceiling acting as the falling wedge.
Stock soared as much as 20% this morning. So it may come as a surprise to learn that the company has just been hit with a $38.9 million legal defeat in a trademark infringement case.
Shares pared those gains, but remained higher by 8% as of 12:58 p.m. ET.
Jury verdict vs. short squeeze
The trademark violation verdict stems from a lawsuit filed for infringing on a Vegadelphia Foods trademark covering the phrase "Where Great Taste Is Plant-Based." Vegadelphia sued Beyond Meat, as well as the coffee and doughnut company Dunkin', in 2022, alleging that the defendants' advertising slogan, "great taste, plant-based," infringed on Vegadelphia's federally registered trademark. Dunkin' settled its portion of the claims against it last year.
The $38.9 million verdict is significant for Beyond Meat. Consider that the plant-based meat substitute company reported revenue of $70.2 million in its third quarter. So why did the stock soar today?
It is likely retail investors at work. Beyond Meat became a meme stock driven by social media hype last month. Shares soared more than 300% in about a week before giving back most of those gains.
Financial Performance
In 2024, Beyond Meat's revenue was $326.45 million, a decrease of -4.93% compared to the previous year's $343.38 million. Losses were -$160.28 million, -52.60% less than in 2023.
Byndmeat

What’s Happening with Beyond Meat (BYND) SharesWhat’s Happening with Beyond Meat (BYND) Shares
Beyond Meat (BYND) shares have been experiencing extreme volatility today, with price swings measured in hundreds of per cent — turning the stock into a textbook example of a meme asset. Here’s a brief overview of the situation.
Drop Below $0.50
Throughout 2025 (and in the preceding years), the share price of the plant-based meat producer had been locked in a long-term downtrend, reflecting its financial difficulties.
Facing a substantial debt load due for repayment in 2027, Beyond Meat restructured its liabilities — extending maturity to 2030 at a higher interest rate in exchange for issuing more than 316 million new shares. This dilution of shareholder equity was viewed as a deeply negative signal.
The market reacted instantly: BYND plunged to point A, falling below $0.50 per share (a striking contrast to its peak above $200 less than five years ago). The steep drop also attracted a surge of new short sellers.
Spike Above $7
Spotting the low price and the high short interest (around 10.5% of total shares), retail traders began coordinating mass purchases through social media platforms. The result was a classic short squeeze, as forced short-covering combined with speculative buying propelled BYND above $7 per share (point B).
What’s Next?
Despite the spectacular rebound from point A to point B, the company’s fundamentals remain weak. Beyond Meat’s upcoming earnings report (scheduled for 4 November) may continue the trend of falling revenue — as seen in Q2 2025, when sales dropped by nearly 20% year-on-year.
The company is still loss-making, and high-profile partnerships — such as McPlant with McDonald’s — have yet to deliver meaningful results.
In the short term, market hype could push BYND towards the $10 psychological level, but it’s unlikely to change the broader picture. The company’s long-term outlook remains overshadowed by deteriorating financials.
This article represents the opinion of the Companies operating under the FXOpen brand only. It is not to be construed as an offer, solicitation, or recommendation with respect to products and services provided by the Companies operating under the FXOpen brand, nor is it to be considered financial advice.

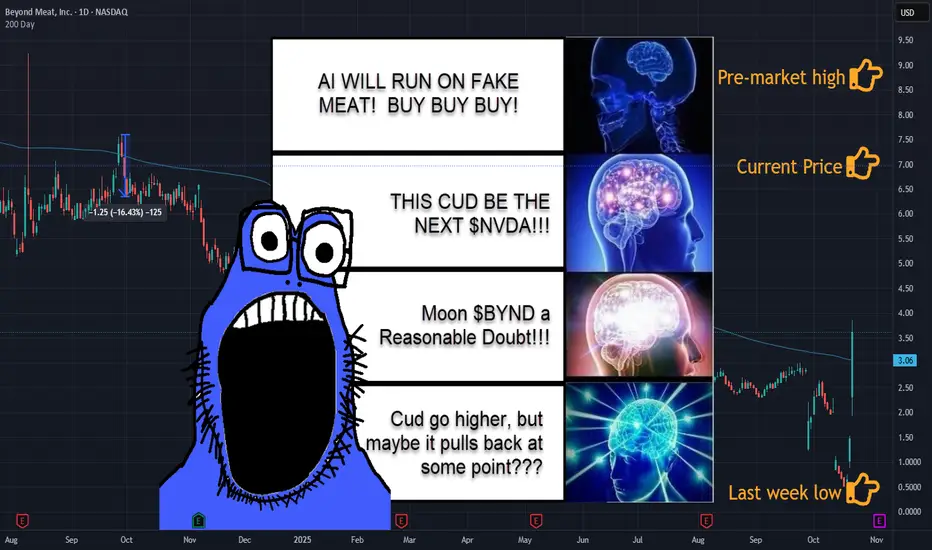
To Infinity and $BYND | Beyond MeatYes, I herd Beyond Meat NASDAQ:BYND has a deal to fuel data centers with fake meat.
Yes, I herd Beyond Meat's AI models have achieved ASI, skipping AGI entirely.
Yes, I herd Bill Gatez loves fake meatz.
Yes, I herd Beyond Meat nanomachines will eliminate the need to consume food orally.
Yes, I herd Beyond Meat destroys cancer cells.
Yes, I herd Beyond Meat will provide free healthcare and childcare to all.
--
The Beyond Meat stock might pump like a roided 80s professional wrestler, but I'm not buying the sizzle on this fake steak.
I'm lookin' to PUT some options on it, Nov 7 expiration or later, before this fake meat sizzle leaves me with nothin' but gristle!
Breaking: Beyond Meat, Inc. (NYSE: $BYND) Spike 54% Today The price of Beyond Meat, Inc. (NASDAQ: NASDAQ:BYND ) Spike 54% in Monday's premarket trading with the asset gearing a move to the $1 resistant zone.
Technically, there's still room to achieve this fit as the stock is trading below key moving averages.
Similarly, the Relative strength index (RSI) is at 25 which is obviously oversold and giving it room to capitalize on the dip.
In recent news, Beyond Meat’s stock collapsed to near $1 a share on Tuesday after the embattled plant-based meat maker finalized a debt exchange deal that handed bondholders hundreds of millions of new shares — effectively wiping out most existing investors.
Shares plunged almost 50% on Monday to close around $1.10 and hovered between $1.03 and $1.10 in Tuesday trading, down more than 76% this year and deep in penny stock territory.
In the summer of 2019, the stock neared $240 a share — its peak price. Since then, the stock has lost more than 99% of its value.

Farewell Beyond Meat, Welcome Real BeefCME: Live Cattle Futures ( CME:LE1! )
Last week, Beyond Meat ( NASDAQ:BYND ) pushed back against rumors that it has filed for bankruptcy, calling recent media reports “unequivocally false.” The denial comes after several headlines suggested the company was headed for Chapter 11 bankruptcy.
It was only six years ago when Beyond Meat was the hottest game in town. It ran on a high-flying hope to revolutionize what we eat and make us healthier. Shares of BYND went public at $25 on May 2, 2019, and were up 163% on the first day.
A confession: I was under its magical spell too and went on national TV in 2019 to discuss the potential of plant-based meat in China. My optimism wasn’t ungrounded. Beyond Meat entered the Chinese market in 2020 with partnerships with Starbucks and Alibaba. The Company opened its first factory near Shanghai in 2021.
NASDAQ:BYND reached its all-time high (ATH) of $234.90 on July 26, 2019. As of Monday, the shares are trading at $2.60, down 33% year-to-date, and down 98.9% from the ATH.
Many reasons caused the downfall of the former market darling. High cost and unnatural flavor are among the most lethal. When a slice of plant-based meat costs twice as much as ground beef, consumers would think twice before they pick it up.
Back at the television program in 2019, I was asked to participate in a blind test. It wasn’t hard for me to tell the difference between the juicy McDonald’s breakfast sausage and the dryness in the plant-based meat.
Beyond Meat closed its Chinese factory in February and completely exited the Chinese market by the end of Q2, according to the Company’s announcement.
In the past few years, consumers have gradually woken up to the fact that, when it comes to meat, real beef tastes the best. On Monday, CME live cattle futures are trading at $231 per hundred pounds, up 19% YTD and up 112% in five years.
August WASDE Report
On August 12th, the US Department of Agriculture (USDA) published its latest updates on World Agriculture Supply and Demand Estimates, also known as the WASDE report.
August WASDE is bullish on beef and cattle:
• The forecast for 2025 beef production is lowered on reduced fed and non-fed cattle slaughter and lighter dressed weights.
• For 2026, beef production is lowered due to reduced expected placements in the second half of 2025, as well as reduced cow slaughter in 2026.
• Beef imports for 2025 are lowered to reflect reported trade data through the first half of the year, as well as reduced shipments due to higher tariff rates, particularly from Brazil. The reduction is carried into beef imports for 2026. The beef export forecast is reduced for 2025, reflecting tighter domestic supplies. The reduction is carried into lower exports for the first half of 2026.
• Cattle price forecasts for 2025 are raised for both the third and fourth quarters based on recent price strength and resilient demand for beef. The higher cattle price forecasts are carried into 2026.
Trading with CME Live Cattle Futures
Futures market shows bullish sentiment. CFTC’s Commitments of Traders report shows that, as of August 12th, CME live cattle futures ( NASDAQ:LE ) have total open interest (OI) of 382,088 contracts.
• “Managed Money” holds 151,580 Long contracts, 31,587 Short contracts, and 43,598 contracts at spread positions.
• The long/short ratio of 4.8-to-1 shows that “Smart Money” is bullish on Live Cattle.
A trader sharing a similar bullish view could explore CME Live Cattle futures.
Live Cattle futures have a notional value of 40,000 pounds (~18 metric tons). At Monday quote of $232 (per 100 pounds), the lead October contract LEV5 is worth $92,800. To buy or sell one contract, a trader is required to post an initial margin of $3,100.
The futures contract has built-in leverage of 30:1 (= 92800 / 3100).
• If LEV5 goes up 5% to $243.6, a long position will gain $4,640 (= (243.6-232) * 400). This will be a hypothetical return of 150% (= 4640 / 3100).
• If LEV5 declines, the trader will see large losses due to leverage. To avoid unlimited exposure, the trader could enter the long position with a stoploss.
• For illustration, a stoploss at 225 for the 232 long order will cap the loss at $2,800 (=(232-225) * 400)
Happy Trading.
Disclaimers
*Trade ideas cited above are for illustration only, as an integral part of a case study to demonstrate the fundamental concepts in risk management under the market scenarios being discussed. They shall not be construed as investment recommendations or advice. Nor are they used to promote any specific products, or services.
CME Real-time Market Data help identify trading set-ups and express my market views. If you have futures in your trading portfolio, you can check out on CME Group data plans available that suit your trading needs www.tradingview.com

Beyond Meat (NASDAQ:BYND) Stock Surged 20% on Memestocks Craze Beyond Meat (NASDAQ:BYND) stock is experiencing a rally on Tuesday, with investors hoping for a squeeze on the meat-alternative company's shares. With 25,356,827 shares shorted, that's roughly 40.97% of the company's float, NASDAQ:BYND has an outstanding short interest position of over 40% of the total float. This could be a sign that traders have added NASDAQ:BYND to their list of meme stocks to squeeze.
The recent interest in pumping up shorted stocks and the return of Roaring Kitty, who initiated the meme stock rally of 2021, are contributing to the rally. If 2024 can mimic 2021, it will be good news for meme traders as several meme stocks rise as they work to push shorts out of them. Today's movement could be a sign that these traders have added NASDAQ:BYND to their list of meme stocks to squeeze.
NASDAQ:BYND stock is experiencing heavy trading today, with more than 12 million shares being traded, above its daily average trading volume of about 3.7 million shares. NASDAQ:BYND stock is up 20.1% as of Tuesday morning and 17.5% since the start of the year.
Beyond Meat (BYND) has an outstanding short interest position on it of over 40% of the total float, which could be in harm's way if the meme rallies across the market continue. The company reported an 18% drop in sales and its 15th consecutive quarterly loss, both of which were worse than what Wall Street expected.

BYND Beyond Meat Options Ahead of EarningsAnalyzing the options chain and the chart patterns of BYND Beyond Meat prior to the earnings report this week,
I would consider purchasing the 10usd strike price in the money Puts with
an expiration date of 2024-4-19,
for a premium of approximately $3.85.
If these options prove to be profitable prior to the earnings release, I would sell at least half of them.

Beyond Meat Chance for more Turmoil ExistsHi Guys! This is a Technical Analysis on Beyond Meat (BYND) on the 3 Day Timeframe.
Ive been following BYND for a long time, trying my best to scope out a BOTTOM. This is an UPDATE to my ongoing analysis. So check out my other charts below for more context.
**Note: Our Current Candle has just begun today 08/14/23 and will close on 08/17/23
We were doing well until we got rejected by the MAJOR RESISTANCE ZONE (Red zone)
Even after we got rejected we did well staying ABOVE the 50 SMA.
But we were not able to sustain SUPPORT and fell through.
We also broke back down below the MAJOR RESISTANCE Trendline from June 2021.
Until proven otherwise, the breakout ABOVE this trendline is now a FAKEOUT.
It is absolutely CRUCIAL we get ABOVE this TRENDLINE this WEEK to continue our Trend change attempt.
And also get back above and confirm SUPPORT on 50 SMA.
The Longer we stay below the chance of further PRICE DECLINE is more PROBABLE.
This can be a Good and Bad thing. Bad especially for those who have bought BYND at higher prices.
But very good in the sense that it would create a sense of no return. This can lead to a necessary capitulatory event where people basically give up, laying the foundation for prices to finally start increasing.
The next levels to watch are the labeled SUPPORT areas:
1. RED Support TrendLine
2. Black Resistance tuned SUPPORT trendline
3. MOST IMPORTANT -> Horizontal Support line labeled MAJOR SUPPORT
4. Last defence = Dashed Red Support Line
-> If we do break & CONFIRM below the RED Dashed line, this would be the Capitulation event where everyone gives up. COuld be a potential scenario to go LONG.
It also would, provided the indicators match/support the pattern, STRENGTHEN the BULLISH DIVERGENCE thats forming. (For more info on the DIVERGENC, look at my previous charts on BYND BELOW)
Now with our Indicators, there are clues in the history that indicate and support further turmoil.
Notice our STOCH RSI
We are currently in a BEARish move down to 20 level.
The last 2 times we reached here, we stayed below the 20 level for 59 days and 56 days.
This caused prices to drop significantly.
We would need to have a quick BULLISH cross and move back upwards or not stay below for extended period of time.
Along with the STOCH RSI, pattern in the RSI when found in correlation with identified pattern in STOCH RSI supports the PRICE DECLINES.
-> The pattern is when the Orange RSI line crosses below the BLACK line and stays below for extended periods can hint at price DECLINES.
Stay level headed, wait till the end of the Week for Clarity. There is always a chance we get back above and continue upwards.
__________________________________________________________________________________
Thank you for taking the time to read my analysis. Hope it helped keep you informed. Please do support my ideas by boosting, following me and commenting. Thanks again.
Stay tuned for more updates on BYND in the near future.
If you have any questions, do reach out. Thank you again.
DISCLAIMER: This is not financial advice, i am not a financial advisor. The thoughts expressed in the posts are my opinion and for educational purposes. Do not use my ideas for the basis of your trading strategy, make sure to work out your own strategy and when trading always spend majority of your time on risk management strategy.

BYND - bottoming out/ buy opportunityHi guys. So BYND is something ive been observing along with LMND and CVNA. WHich i believe these 3 have similar patterns, especially the BULLISH DIVERGENCE on large timeframes like the weekly.
This analysis of Beyond Meat is also on the WEEKLY. Im using the Weekly timeframe as i believe these stocks are good investments (holding for more than couple months) for this current bullish activity, which i believe is the beginning stages of a Bull run that will extend into 2024. Look for more info on upcoming ideas i post, as i will attempt to analyze MACRO stuff.
But anyway lets jump into BYND - Beyond Meat.
Keeping it simple. Ive outlined major levels on the Price Action.
White lines, Yellow Lines and Green Lines.
The 2 white lines are VERY IMPORTANT.
1. From bottom up, this 1st white line is showing a BULLISH DIVERGENCE when compared to my top 2 indicators (RSI and MACD). This is when the price action has a low, followed by a lower low. WHile indicators are printing higher lows (indicated by upward sloping white lines on the RSI and MACD).
2. The second white line, is this downward sloping Resistance line that depicts the bear move from BYND top price. We've have many interactions with this line but could not break above it and therefore it has pushed the price down to our current prices. Expect in upcoming days to weeks to test this white line again.
Remember the more times, price interacts with lines, the weaker the lines get so probabilities of breaking the white line are becoming more likely. Thats also why i believe BYND could have bottomed. And if we do break above this line, it will indicate trend change and probability of upside potential.
Yellow lines.
1. First one from bottom up, is major support level that was created Sept to december 2022. Last 3 weeks we've confirmed below it however, if you look on the MONTHLY timeframe, we have not yet confirmed below this line and are currently fighting to be above this. I see this as safe until proven otherwise. We are also currently on the weekly, trying to get above this line.
This also can mean we are forming or have formed a DOUBLE BOTTOM, which is a powerful bottoming pattern. Indicated by the 2 green curved lines.
2. Second yellow line from bottom up, is our next Resistance area.
# 3 and 4 from bottom up. Long ways to go till we reach these 2 yellow lines but just to give perspective. These are major major levels.
Green line
If we reach the green horizontal line, This is my 1st zone if it starts acting as support, where i say OKAY now we are ON and the next level would be the #3 yellow line. Things start to look GOOD here.
In relation to LMND and CVNA, which have played out. I believe Beyond meat will follow.
Especially if we close tomorrows candle above the 1st yellow horizontal line from bottom to top. I believe the bottom is and will be in.
INDICATORS:
1. RSI - Upsloping white line indicates BULLISH DIVERGENCE in relation to white line in Price action. Double bottom and having a DIVERGENCE is always a nice bottoming indicator. As my predictions for LMND were hit, i believe BYND will follow suit. Money is being made, itll move into these smaller cap plays.
WATCH the white horizontal resistance line. If RSI gets above this, the bullish divergence will start playing out and we will probably start breaking through yellow and green resistance lines drawn.
2. MACD - Histogram indicates stalling momentum but the lines indicate an uptrend of momentum, and convergence for the BULLISH DIVERGENCE.
2 indicators supporting the bullish divergence is better than 1.
3. Wave trend oscillator - Is showing a bottoming signal, though on this particular chart its not a great indicator due to false signals. I believe that along with double bottom possibly playing out, the Bullish divergence. This is current print is a psitive signal.
CONCLUSION:
Overall, BYND has been on a downtrend for 2 years now. Though that doesnt mean BYND can't go lower. ALong with Bullish Divergence showing in 2 indicators, a potential double bottom forming and volume picking up somewhat. I believe the worst has passed for BYND. The bottom is probable to be in. You can compare the movement of BYND to LMND in my post below or CVNA which has had a signficant move recently. In my opinion, this could be a nice area for buy or long entries.
If you liked what you read on this post, please do boost, follow and absolutely comment on what you thought or what you are thinking if you agree or disagree. Thank you.
DISCLAIMER:
The information posted in this idea is not financial advice, I am NOT a Financial advisor. This is my opinion only and for educational purposes. Please do take the time to think about strategies and to focus most of it on risk management. Never trade without stop losses. Thank you.

Above and beyondBeyond Meat will be huge in the coming years IMO as the transition from us humans eating meat as our primary source of protien will ultimatly be made harder and most likly very expensive (check W H O there plenty of documents on agenda 2030 to go with what im saying)
Alternatives/subtritutes to actual meat should see the growth as it becomes the norm, weve already seen in 2022 beyond meat in mcdonalds and other fast food chains and also in most of the big name supermarkets across the globe.
Like other risk on asset BYND has alos seen a 90+% rejection from all time highs, during these high is when beyond meat launched, it was when the partnerships with mcdonalds was seen and also when we started to see it on tv and shelves in these stores.
Anyone who listens to what i talk about will know price moves before the news and during the time above price was getting ready to reject with very clean bearish reversal pattern (check chart below) during which retial investers and the majority of traders who follow retial logic was buying into this asset beliveing it will rocket on launch, this is how these big banks and intituions get paid by drawing in the hurd and shitting down their necks.
What we do in here we change that, we take from the cherry at the very top and filter it all the way down.!!!!
Long term hold and buying here at $16 with the potential of us seeing BYND above $150 in the near future.
First level of resistance here is $33 breaker, once we recliam this we can most defiently be comftable with " the bottom is in" and we sit back and watch.
Also note we may see two draws on liquidty at $54/$74 with a possible correction after, here we can add to our postion.

BYND is still bind in a range.Beyond Meat - 30d expiry - We look to Sell at 16.18 (stop at 17.45)
The primary trend remains bearish.
This stock has seen poor sales growth.
Price action continued to range between key support & resistance (12 - 16) and we expect this to continue.
Preferred trade is to sell into rallies.
16 continues to hold back the bulls.
The bias is to break to the downside.
Our profit targets will be 13.01 and 12.51
Resistance: 14.30 / 15.50 / 16.30
Support: 13.10 / 12.10 / 11.56
Disclaimer – Saxo Bank Group.
Please be reminded – you alone are responsible for your trading – both gains and losses. There is a very high degree of risk involved in trading. The technical analysis , like any and all indicators, strategies, columns, articles and other features accessible on/though this site (including those from Signal Centre) are for informational purposes only and should not be construed as investment advice by you. Such technical analysis are believed to be obtained from sources believed to be reliable, but not warrant their respective completeness or accuracy, or warrant any results from the use of the information. Your use of the technical analysis , as would also your use of any and all mentioned indicators, strategies, columns, articles and all other features, is entirely at your own risk and it is your sole responsibility to evaluate the accuracy, completeness and usefulness (including suitability) of the information. You should assess the risk of any trade with your financial adviser and make your own independent decision(s) regarding any tradable products which may be the subject matter of the technical analysis or any of the said indicators, strategies, columns, articles and all other features.
Please also be reminded that if despite the above, any of the said technical analysis (or any of the said indicators, strategies, columns, articles and other features accessible on/through this site) is found to be advisory or a recommendation; and not merely informational in nature, the same is in any event provided with the intention of being for general circulation and availability only. As such it is not intended to and does not form part of any offer or recommendation directed at you specifically, or have any regard to the investment objectives, financial situation or needs of yourself or any other specific person. Before committing to a trade or investment therefore, please seek advice from a financial or other professional adviser regarding the suitability of the product for you and (where available) read the relevant product offer/description documents, including the risk disclosures. If you do not wish to seek such financial advice, please still exercise your mind and consider carefully whether the product is suitable for you because you alone remain responsible for your trading – both gains and losses.

BYND S/R Map : 1D ChartBYND is sitting at key support line (green).
If the support line holds - price will go re-test the orange line above and try to breakthrough.
If the support line fails - price will go down to test the orange line below for support. If the orange line holds as support - the green line will become resistance.

BYND monthly at the bottom stop loss $0 take profit $136.36BYND monthly at the bottom stop loss $0 take profit $136.36 at point of control.

BYND quick bounce playKeeping it short and simple. Temporarily removed all indicators, just trendlines and Support/Resistance.
Oversold, pushing upwards, will stabilize a little before the monthly close. Quick 20% is our goal here.
For the meme lords: 39% Float Shorted.
Disclaimer:
I personally am a non-believer of the company. BYND is an absolute shitshow + retarded management so far.
Quick in and out. Manage your risks accordingly.

BYND: Double or nothingI’ve been feeling the hurt from having bought BYND after publishing my previous BYND idea. See linked chart. However, since then I’ve increased my position 3-fold and decreased my dollar-cost-average by $60+/share.
To the Bulls who, like me, have been feeling the wrath of the Bears: I think it’s our time to shine. Now is the time to go big or go broke, especially if you’re a fan trading based on analysis of EW, patterns, market cycles, and Wyckoff.
Based on chart, within the next 3-4 months we should expect to see 3+ intense rallies.
Chart: Dates and time scale will likely be inaccurate. Focus on the price action.
Black: past-present EW and Fib.
Green: forecast EW and Fib.
Blue: patterns (parallel channels).
Orange: Wyckoff and market cycle.
Purple: price targets.
Red: pullback targets.
Comments welcome. Good luck to all.

Beyond MeatThis is just an observation: Beyond Meat (BYND) is breaking above its 4h EMA exp ribbon. It also just broke above its displaced daily EMA. These are two very bullish trend reversal signals. Regardless of fundamentals, these indicators are showing that there are no more sellers left and the trend may soon reverse. When everyone is still super negative about an asset, but the asset's chart shows that it is beginning to outperform the market, that's when you buy. Charts never lie. It is a fact that BYND has been outperforming the broader market since May making higher highs and higher lows. Now it's showing signs of an actual breakout. Only time will show if this will become a sustained breakout. Huge congrats to @Chartguru1 for calling the bottom on this several weeks back!

Two scenarios for beyond meat It's two scenarios for beyond meat ,
1) start from $19-$20 for $37 and then down to this area again , it's terminal pattern and it's gonna reach above $200
2) if it's start from $19-$20 and break 37 , it will go to $160 dollar , it's triangle

Not beyond all hope but beyond a lot of hope (BYND)Beyond Meat
Short Term
We look to Sell at 27.76 (stop at 29.59)
Further downside is expected and we prefer to set shorts in early trade. The medium term bias remains bearish. Previous resistance located at 28.50. There is scope for mild upward pressure at the open but we look for selling interest to resist gains.
Our profit targets will be 21.80 and 15.40
Resistance: 26.50 / 28.50 / 52.00
Support: 22.25 / 15.00 / 10.00
Disclaimer – Saxo Bank Group. Please be reminded – you alone are responsible for your trading – both gains and losses. There is a very high degree of risk involved in trading. The technical analysis, like any and all indicators, strategies, columns, articles and other features accessible on/though this site (including those from Signal Centre) are for informational purposes only and should not be construed as investment advice by you. Such technical analysis are believed to be obtained from sources believed to be reliable, but not warrant their respective completeness or accuracy, or warrant any results from the use of the information. Your use of the technical analysis, as would also your use of any and all mentioned indicators, strategies, columns, articles and all other features, is entirely at your own risk and it is your sole responsibility to evaluate the accuracy, completeness and usefulness (including suitability) of the information. You should assess the risk of any trade with your financial adviser and make your own independent decision(s) regarding any tradable products which may be the subject matter of the technical analysis or any of the said indicators, strategies, columns, articles and all other features.
Please also be reminded that if despite the above, any of the said technical analysis (or any of the said indicators, strategies, columns, articles and other features accessible on/through this site) is found to be advisory or a recommendation; and not merely informational in nature, the same is in any event provided with the intention of being for general circulation and availability only. As such it is not intended to and does not form part of any offer or recommendation directed at you specifically, or have any regard to the investment objectives, financial situation or needs of yourself or any other specific person. Before committing to a trade or investment therefore, please seek advice from a financial or other professional adviser regarding the suitability of the product for you and (where available) read the relevant product offer/description documents, including the risk disclosures. If you do not wish to seek such financial advice, please still exercise your mind and consider carefully whether the product is suitable for you because you alone remain responsible for your trading – both gains and losses.

Beyond Hope? Beyond Meat
Short Term
We look to Sell at 21.99 (stop at 23.88)
Further downside is expected and we prefer to set shorts in early trade. The medium term bias remains bearish. Trades with a bearish descending triangle formation. A break of the short-term upward trending support at 22.00 should encourage selling.
Our profit targets will be 17.18 and 13.30
Resistance: 26.50 / 31.00 / 45.00
Support: 20.00 / 15.00 / 10.00
Disclaimer – Saxo Bank Group. Please be reminded – you alone are responsible for your trading – both gains and losses. There is a very high degree of risk involved in trading. The technical analysis, like any and all indicators, strategies, columns, articles and other features accessible on/though this site (including those from Signal Centre) are for informational purposes only and should not be construed as investment advice by you. Such technical analysis are believed to be obtained from sources believed to be reliable, but not warrant their respective completeness or accuracy, or warrant any results from the use of the information. Your use of the technical analysis, as would also your use of any and all mentioned indicators, strategies, columns, articles and all other features, is entirely at your own risk and it is your sole responsibility to evaluate the accuracy, completeness and usefulness (including suitability) of the information. You should assess the risk of any trade with your financial adviser and make your own independent decision(s) regarding any tradable products which may be the subject matter of the technical analysis or any of the said indicators, strategies, columns, articles and all other features.
Please also be reminded that if despite the above, any of the said technical analysis (or any of the said indicators, strategies, columns, articles and other features accessible on/through this site) is found to be advisory or a recommendation; and not merely informational in nature, the same is in any event provided with the intention of being for general circulation and availability only. As such it is not intended to and does not form part of any offer or recommendation directed at you specifically, or have any regard to the investment objectives, financial situation or needs of yourself or any other specific person. Before committing to a trade or investment therefore, please seek advice from a financial or other professional adviser regarding the suitability of the product for you and (where available) read the relevant product offer/description documents, including the risk disclosures. If you do not wish to seek such financial advice, please still exercise your mind and consider carefully whether the product is suitable for you because you alone remain responsible for your trading – both gains and losses.

BYND - Did you forget about Beyond Meat?Potential triangle/inverse head and shoulders forming as well as weekly bullish divergence. These sort of stocks like to run while the market is choppy which i expect into March. Breakout above 80

To Infinity and Beyond (Meat)?Beyond Meat - Short Term - We look to Buy at 60.97 (stop at 55.50)
Previous support located at 60.00. The bullish engulfing candle on the daily chart is positive for sentiment. We look for a temporary move higher. This provides an excellent risk/reward opportunity to fade the current bearish move.
Our profit targets will be 85.29 and 94.12
Resistance: 90.00 / 100.00 / 115.00
Support: 60.00 / 50.00 / 45.00
Disclaimer – Saxo Bank Group. Please be reminded – you alone are responsible for your trading – both gains and losses. There is a very high degree of risk involved in trading. The technical analysis, like any and all indicators, strategies, columns, articles and other features accessible on/though this site (including those from Signal Centre) are for informational purposes only and should not be construed as investment advice by you. Such technical analysis are believed to be obtained from sources believed to be reliable, but not warrant their respective completeness or accuracy, or warrant any results from the use of the information. Your use of the technical analysis, as would also your use of any and all mentioned indicators, strategies, columns, articles and all other features, is entirely at your own risk and it is your sole responsibility to evaluate the accuracy, completeness and usefulness (including suitability) of the information. You should assess the risk of any trade with your financial adviser and make your own independent decision(s) regarding any tradable products which may be the subject matter of the technical analysis or any of the said indicators, strategies, columns, articles and all other features.
Please also be reminded that if despite the above, any of the said technical analysis (or any of the said indicators, strategies, columns, articles and other features accessible on/through this site) is found to be advisory or a recommendation; and not merely informational in nature, the same is in any event provided with the intention of being for general circulation and availability only. As such it is not intended to and does not form part of any offer or recommendation directed at you specifically, or have any regard to the investment objectives, financial situation or needs of yourself or any other specific person. Before committing to a trade or investment therefore, please seek advice from a financial or other professional adviser regarding the suitability of the product for you and (where available) read the relevant product offer/description documents, including the risk disclosures. If you do not wish to seek such financial advice, please still exercise your mind and consider carefully whether the product is suitable for you because you alone remain responsible for your trading – both gains and losses.

Beyond ~ BYNDHuge reversal today in beyond meats. Could see this potentially go on and fill the gap in the lower 90's!

Beyond Meat Investment Price TargetBuy Order set between the 1.786 macro fib and the 3.618 micro fib.
Oversold so why not + Bullish Trendline Div
Fundamentals aren't that good - Losing money (source: Balance Sheet). The company's product is in many supermarkets. Betting on this being the leader of alternative meats.
