CADJPY RISING TRENDLINE|LONG|
✅CADJPY holds a clean bullish structure with price pulling back into a rising trendline. This looks like a textbook ICT retracement into dynamic support before continuation higher toward premium targets. Time Frame 12H.
LONG🚀
✅Like and subscribe to never miss a new idea!✅
CADJPY

CAD-JPY Local Short! Sell!
Hello,Traders!
CADJPY has tapped into a well-defined horizontal supply area after a buy-side liquidity sweep. Smart money distribution is evident, and price is expected to retest the supply zone before continuing lower toward resting sell-side liquidity below. Time Frame 5H.
Sell!
Comment and subscribe to help us grow!
Check out other forecasts below too!
Disclosure: I am part of Trade Nation's Influencer program and receive a monthly fee for using their TradingView charts in my analysis.

CAD-JPY Free Signal! Buy!
Hello,Traders!
CADJPY breaks decisively above a well-defined horizontal demand zone after absorbing sell-side liquidity. Strong bullish displacement confirms smart-money participation, suggesting continuation higher as price targets the next liquidity pool resting above recent highs.
--------------------
Stop Loss: 114.26
Take Profit: 114.80
Entry: 114.50
Time Frame: 2H
--------------------
Buy!
Comment and subscribe to help us grow!
Check out other forecasts below too!
Disclosure: I am part of Trade Nation's Influencer program and receive a monthly fee for using their TradingView charts in my analysis.

CADJPY BULLISH BREAKOUT|LONG|
✅CADJPY breaks and holds above a well-defined key level, confirming bullish intent after sustained accumulation. The impulsive displacement signals institutional participation, with price now trading in a premium expansion phase. As long as structure remains intact above the breakout zone, continuation toward higher liquidity pools is favored. Time Frame 2H.
LONG🚀
✅Like and subscribe to never miss a new idea!✅

Is CAD/JPY Signaling Continuation or a Bull Trap?🍁💴 CAD/JPY: BULLISH BREAKOUT SETUP | Day/Swing Trade
📊 MARKET OVERVIEW
Asset: CAD/JPY (Canadian Dollar vs Japanese Yen)
Current Price: 114.00 JPY
Market Status: ⚡ Consolidating near resistance with bullish momentum
🎯 TRADE PLAN
Direction: 📈 BULLISH
Entry Strategy:
✅ ANY PRICE LEVEL after confirmed breakout above 114.400
Wait for candle close above resistance
Volume confirmation preferred
Look for retest of broken level
Stop Loss: 🛡️ 113.700
⚠️ CRITICAL DISCLAIMER: This is MY stop loss based on MY risk tolerance. Dear Traders & Investors - YOU must adjust YOUR stop loss based on YOUR strategy, YOUR risk management, and YOUR account size. Trade at YOUR OWN RISK.
Target: 🎯 115.500
💡 Multiple resistance factors at target:
Historical resistance zone
Overbought territory potential
Profit-taking area
Correction zone likely
⚠️ TAKE PROFIT DISCLAIMER: This is MY target. Dear Traders & Investors - YOU should set YOUR take profit based on YOUR analysis and YOUR risk-reward preference. Scale out profits as YOU see fit. YOUR money, YOUR choice, YOUR responsibility.
💵 CORRELATED PAIRS TO WATCH
USD Pairs:
USD/CAD @ 1.3738 - Inverse correlation (USD strength impacts CAD)
USD/JPY @ 161.84 - Direct impact on JPY side
Commodity Currency Pairs:
AUD/CAD @ 0.9132 - Similar commodity correlation
NZD/CAD @ 0.7994 - Risk-on/off sentiment indicator
Cross Pairs:
EUR/JPY @ 183.35 - JPY strength indicator
GBP/JPY @ 209.67 - Yen risk appetite gauge
Correlation Note: These pairs move in tandem due to USD strength, commodity prices, and risk sentiment. Monitor for confluence.
📰 FUNDAMENTAL FACTORS
🇨🇦 Canada (CAD Bullish Drivers):
Bank of Canada Status:
Policy rate: 2.25% (held December 10, 2025)
Cut cycle paused after signal rates "about right"
Q3 GDP growth: +2.6% (beat expectations)
Unemployment fell to 6.5% in November
CPI inflation: 2.2% (near 2% target)
Economic Outlook:
✅ Strong Q3 growth surprise
✅ Labor market improving
✅ Inflation under control
⚠️ Trade uncertainty with US tariffs
Crude Oil Link:
WTI @ $58.56/barrel (up 6 consecutive sessions)
Geopolitical tensions supporting prices
CAD highly correlated with oil prices
Canada is major energy exporter to Asia
🇯🇵 Japan (JPY Bearish Pressures):
Bank of Japan Recent Action:
Rate hike: 0.75% (December 19, 2025)
Highest rate since September 1995
Hawkish stance but REAL rates still deeply negative
More hikes signaled ahead
Economic Challenges:
❌ CPI inflation: 2.9% (above 2% target for 44 months)
❌ Real wages declining 10 months straight
❌ Yen weakness (154-157 vs USD)
❌ Despite rate hikes, yen remains under pressure
✅ Wage growth momentum expected 2026
Key Factor: Even at 0.75%, with 2.9% inflation, Japan's REAL interest rate is -2.15% (deeply negative), keeping yen structurally weak.
🔍 KEY ECONOMIC EVENTS AHEAD
Upcoming Dates:
January 28, 2026: Bank of Canada next rate decision
Q1 2026: BoJ expected to continue rate hikes toward 1.0-1.25%
Weekly: Canadian employment data
Weekly: Japanese inflation data
Critical Catalysts:
🛢️ Crude oil price movements
📊 Canadian GDP data
💹 BoJ policy statements
🌐 US-Canada trade developments
💴 Yen intervention risk (if weakness accelerates)
⚖️ INTEREST RATE DIFFERENTIAL
Canada: 2.25% | Japan: 0.75%
Differential: +1.50% favoring CAD
This positive carry makes CAD/JPY attractive for:
Swing traders capturing rate differential
Carry trade positioning
Medium-term bullish bias
🚨 RISK FACTORS
Bearish Risks:
⚠️ BoJ intervention if yen weakens too rapidly
⚠️ Crude oil price collapse
⚠️ US tariff escalation hitting Canadian economy
⚠️ Global risk-off sentiment strengthening JPY
Bullish Confirmations:
✅ Sustained oil price strength
✅ Canadian data beats expectations
✅ BoC maintains "higher for longer" stance
✅ Risk-on market environment
📈 TECHNICAL SETUP SUMMARY
Trend: Bullish channel respected
Support: 113.450 weekly zone
Resistance: 114.400 (breakout level)
Target: 115.500 (profit zone)
Market Structure: Higher lows intact
⚡ FINAL WORD
Dear Traders & OG's 👑
This is MY analysis based on current market data. YOU are responsible for YOUR trades. Always:
Size YOUR positions appropriately
Use YOUR stop losses
Take YOUR profits when satisfied
Manage YOUR risk
NOT FINANCIAL ADVICE. Trade at YOUR OWN RISK.
📊 May the markets be in your favor! 🚀

CADJPY→ Trade Analysis | BUY SetupCADJPY is moving in an UP trend channel.
The chart broke through the dynamic Resistance line, which now acts as support.
We expect a decline in the channel after testing the current level which suggests that the price will continue to rise
Hello Traders, here is the full analysis.
I think we can soon see more fall from this range! GOOD LUCK! Great BUY opportunity CADJPY
I still did my best and this is the most likely count for me at the moment.
-------------------
Traders, if you liked this idea or if you have your own opinion about it, write in the comments. I will be glad 🤝

CADJPY FREE SIGNAL|LONG|
✅CADJPY is compressing inside a tightening range after a sell-side sweep, with structure holding above higher-low support. ICT model suggests accumulation within the wedge, targeting a breakout toward buy-side liquidity resting above recent highs.
—————————
Entry: 113.99
Stop Loss: 113.82
Take Profit: 114.24
Time Frame: 1H
—————————
LONG🚀
✅Like and subscribe to never miss a new idea!✅

CADJPY Is Going Down! Sell!
Here is our detailed technical review for CADJPY.
Time Frame: 1h
Current Trend: Bearish
Sentiment: Overbought (based on 7-period RSI)
Forecast: Bearish
The market is approaching a significant resistance area 114.142.
Due to the fact that we see a positive bearish reaction from the underlined area, I strongly believe that sellers will manage to push the price all the way down to 113.390 level.
P.S
The term oversold refers to a condition where an asset has traded lower in price and has the potential for a price bounce.
Overbought refers to market scenarios where the instrument is traded considerably higher than its fair value. Overvaluation is caused by market sentiments when there is positive news.
Like and subscribe and comment my ideas if you enjoy them!

USDJPY: continuation move🛠 Technical Analysis: On the 4-hour (H4) timeframe, USDJPY remains firmly in a long-term Ascending Channel, demonstrating a sustained bullish structure.
A significant technical development has occurred: the price has successfully breached a "Broken resistance line" (the descending trendline from previous highs) and is now consolidating above the horizontal resistance zone at 157.271. The moving averages—SMA 50, 100, and 200—are all trending upward and acting as a dynamic support cluster below the current price. The current price action points to a potential breakout of resistance near 158, especially after the price consolidates near this zone.
———————————————
❗️ Trade Parameters (BUY)
———————————————
➡️ Entry Point: Buy after the breakout resistance (approx. 157.916)
🎯 Take Profit: 161.50 – 162.00 (Upper boundary of the Ascending Channel)
🔴 Stop Loss: Below the recent consolidation and SMA cluster (approx. 156.152)
⚠️ Disclaimer: This is a potential trade idea based on current analysis; market conditions and price direction are subject to change based on news factors and volatility.

USDCAD: 2-week horizon🛠 Technical Analysis: On the 4-hour timeframe, USDCAD has invalidated its ascending channel structure, triggering a "Global bearish signal" confirmed by the death cross of the SMA 50 below the SMA 100 and 200. The pair is currently under strong selling pressure but is approaching a major support zone near 1.3730, which aligns with previous accumulation levels. The projected trade setup anticipates a stabilization at this support floor, followed by a corrective rally targeting the breakdown point and the SMA cluster around 1.3980 - 1.4000.
———————————————
❗️ Trade Parameters (BUY)
———————————————
➡️ Entry Point: Buy Limit at the support zone (approx. 1.3730 – 1.3750)
🎯 Take Profit: 1.3980 – 1.4015 (Resistance)
🔴 Stop Loss: Below the support structure (approx. 1.3600)
⚠️ Disclaimer: This is a potential trade idea based on current analysis; market conditions and price direction are subject to change based on news factors and volatility.

How to Trade Reversals Like a Pro | CADJPY Wave 5 Entry hey Traders,
This is a live example of reversal trading using completed bullish wave structure. Entry executed, currently +10 pips, targeting 113.36 38:1 risk: reward.
🌊 Wave Structure Analysis:
Pattern Identified: Completed Bullish Wave Structure
What This Gives Us:
When a wave structure completes, it provides absolute clarity. We know exactly what our options are—no guessing, no confusion.
Our Two Options:
Sell the reversal (what we did)
Do nothing (if conditions aren't perfect)
That's it. No ambiguity. No emotional decision-making.
💡 The Power of WavesOfSuccess:
This is what proper wave counting provides:
✅ Objectivity - Remove emotion, follow structure
✅ Clarity - Know exactly what to do (or not do)
✅ Flawless Execution - Enter at precise levels
Important Reality Check:
Having clarity doesn't mean we never lose. Losing is an essential part of trading. We teach traders to accept losses quickly and immediately move to the next opportunity. The edge plays out over time, not on every single trade.
📊 Trade Execution Breakdown:
Focus Area: Last leg of bullish wave structure
Entry Method:
Counted the internal bar structures within the major Wave 5 swing. Precise entry at the 2nd Higher High (HH) bar of the internal wave count.
Entry: 114.42
Stop Loss: 114.46 (4Pips)
Why This Level:
The 2nd HH bar of Wave 5's internal structure represents peak momentum—the final push before exhaustion. This is where reversals should begin.
⚠️ Advanced Execution Warning:
This is NOT for novice traders.
Requirements for this type of execution:
Flawless wave counting ability
No guessing on wave positions
Internal bar structure recognition
Precise entry timing
When you master this:
Trading becomes effortless. You're not predicting—you're reading structure and executing mechanically. All you need to control is risk through proper stop placement.
✅ Trade Outcome (So Far):
Status: Success - Risk-free position
What Happened:
Price broke below the internal Wave 4 structural bar within the Wave 5 swing. This created immediate downside momentum and allowed us to move the stop to break-even (risk-free).
Current Profit: +10 pips (and counting)
Current Risk: 0 pips (break-even stop)
👍 Boost if you want more reversal trade breakdowns
👤 Follow for advanced wave structure execution
💬 Can you count internal waves? Comment below

USDJPY: before BoJ🛠 Technical Analysis: On the 4-hour timeframe, USDJPY is maintaining a strong long-term bullish posture within a large ascending channel. The price has recently found solid support near the SMA 100 and SMA 200 confluence. The critical development will be the breakout above the descending resistance line that has been constraining price action since the November peak. Currently, the pair try to test the horizontal resistance zone around 157.00 – 158.00. A successful consolidation above this area, as indicated by the "Resistance line" breakout, confirms a trend continuation. With the moving averages trending upward and the price remaining in the upper half of the channel, the path of least resistance is toward the channel's upper boundary.
———————————————
❗️ Trade Parameters (BUY)
———————————————
➡️ Entry Point: Buy on a confirmed break of the resistance line (approx. 156.733 – 157.00).
🎯 Take Profit: 161.50 – 162.00 (Upper boundary of the Ascending Channel).
🔴 Stop Loss: Below the recent swing low and SMA support (approx. 155.162).
⚠️ Disclaimer: This is a potential trade idea based on current analysis; market conditions and price direction are subject to change based on news factors and volatility.

Bullish bounce off 38.2% Fibonacci support?CAD/JPY is moving lower toward the pivot, which is acting as pullback support and aligns with the 38.2% Fibonacci retracement. Price could find support here and bounce toward the first resistance.
Pivot: 112.21
1st Support: 111.60
1st Resistance: 113.30
Disclaimer:
The opinions given above constitute general market commentary and do not constitute the opinion or advice of IC Markets or any form of personal or investment advice.
Any opinions, news, research, analyses, prices, other information, or links to third-party sites contained on this website are provided on an "as-is" basis, are intended to be informative only, and are not advice, a recommendation, research, a record of our trading prices, an offer of, or solicitation for, a transaction in any financial instrument and thus should not be treated as such. The information provided does not involve any specific investment objectives, financial situation, or needs of any specific person who may receive it. Please be aware that past performance is not a reliable indicator of future performance and/or results. Past performance or forward-looking scenarios based upon the reasonable beliefs of the third-party provider are not a guarantee of future performance. Actual results may differ materially from those anticipated in forward-looking or past performance statements. IC Markets makes no representation or warranty and assumes no liability as to the accuracy or completeness of the information provided, nor any loss arising from any investment based on a recommendation, forecast, or any information supplied by any third party

CAD-JPY Rebound Ahead! Buy!
Hello,Traders!
CADJPY shows a clean reaction from a well-defined demand zone, with sell-side liquidity already swept and displacement confirming bullish intent. Current structure favors a continuation higher toward the next liquidity pool above, as price holds in premium mitigation and demand remains respected. Time Frame 4H.
Buy!
Comment and subscribe to help us grow!
Check out other forecasts below too!
Disclosure: I am part of Trade Nation's Influencer program and receive a monthly fee for using their TradingView charts in my analysis.

CADJPY: Long Signal with Entry/SL/TP
CADJPY
- Classic bullish formation
- Our team expects growth
SUGGESTED TRADE:
Swing Trade
Buy CADJPY
Entry Level - 112.73
Sl - 112.61
Tp - 112.96
Our Risk - 1%
Start protection of your profits from lower levels
Disclosure: I am part of Trade Nation's Influencer program and receive a monthly fee for using their TradingView charts in my analysis.
❤️ Please, support our work with like & comment! ❤️

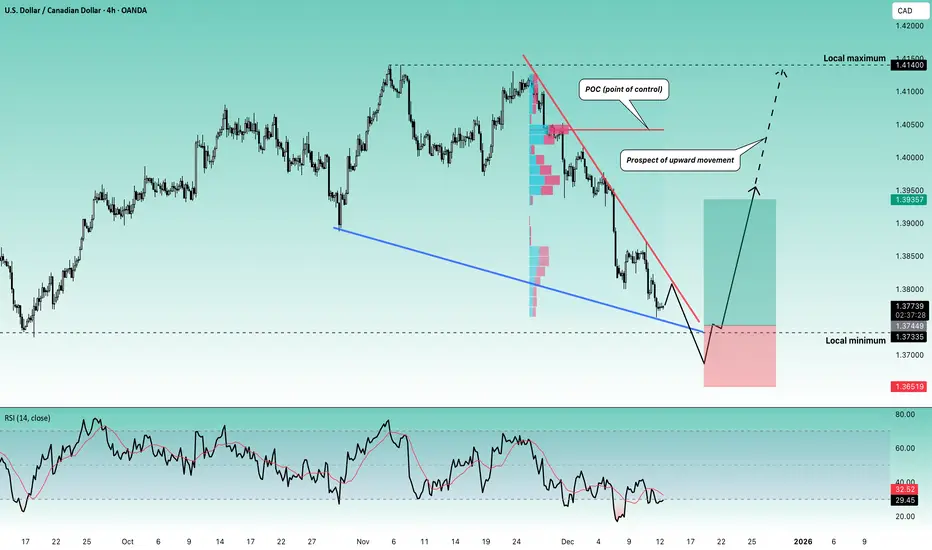
Stop!Loss|Market View: USDCAD🙌 Stop!Loss team welcomes you❗️
In this post, we're going to talk about the near-term outlook for the USDCAD currency pair☝️
Potential trade setup:
🔔Entry level: 1.37449
💰TP: 1.39357
⛔️SL: 1.36519
"Market View" - a brief analysis of trading instruments, covering the most important aspects of the FOREX market.
👇 In the comments 👇 you can type the trading instrument you'd like to analyze, and we'll talk about it in our next posts.
💬 Description: Further weakening of the US dollar is likely to be expected in the near future. Against this backdrop, USDCAD is approaching support at 1.37335 (short-term selling could be looked for). At the same time, a promising upward reversal is expected from this area, with a preliminary target of 1.39000. A longer-term move could continue toward 1.40000 and 1.41000.
Thanks for your support 🚀
Profits for all ✅
CADJPY: Trend Continuation
Daily TF indicates continued uptrend after two weak bearish bars
Price on H1 TF is crossing above descending trend line (DTL)
Price above EMA60 also indicates relatively stronger upside potential

USDJPY: ascending channel continuation🛠 Technical Analysis: On the 4-hour timeframe, USDJPY is trending within a well-defined ascending channel, recently finding support at the confluence of the channel's lower boundary and the 200 SMA. Price action has formed a falling wedge pattern near this support zone, which is a classic bullish continuation setup suggesting the correction is over. A breakout above the wedge's upper trendline is currently in progress, signaling a potential rally toward the channel's upper resistance levels.
———————————————
❗️ Trade Parameters (BUY)
———————————————
➡️ Entry Point: Buy on the confirmed breakout of the wedge (approx. 154.90 – 155.10)
🎯 Take Profit: 158.08 (key resistance), extended target at 160.00 (channel top)
🔴 Stop Loss: Below the recent support structure and SMA cluster (approx. 153.50 – 153.70)
⚠️ Disclaimer: This is a potential trade idea based on current analysis; market conditions and price direction are subject to change based on news factors and volatility.

CADJPY Bullish Wedge!
HI,Traders !
#CADJPY is trading in an
Uptrend and the pair formed
A bullish wedge pattern and
Now we are seeing a bullish
Breakout from the wedge so
We are bullish biased and we
Will be expecting a further
Bullish move up !
Comment and subscribe to help us grow !

Bullish momentum to extend?CAD/JPY could fall to the pivot and could bounce to the 1st resistance.
Pivot: 112.21
1st Support: 111.60
1st Resistance: 113.86
Disclaimer:
The opinions given above constitute general market commentary and do not constitute the opinion or advice of IC Markets or any form of personal or investment advice.
Any opinions, news, research, analyses, prices, other information, or links to third-party sites contained on this website are provided on an "as-is" basis, are intended to be informative only, and are not advice, a recommendation, research, a record of our trading prices, an offer of, or solicitation for, a transaction in any financial instrument and thus should not be treated as such. The information provided does not involve any specific investment objectives, financial situation, or needs of any specific person who may receive it. Please be aware that past performance is not a reliable indicator of future performance and/or results. Past performance or forward-looking scenarios based upon the reasonable beliefs of the third-party provider are not a guarantee of future performance. Actual results may differ materially from those anticipated in forward-looking or past performance statements. IC Markets makes no representation or warranty and assumes no liability as to the accuracy or completeness of the information provided, nor any loss arising from any investment based on a recommendation, forecast, or any information supplied by any third party

CAD/JPY BEST PLACE TO SELL FROM|SHORT
Hello, Friends!
CAD/JPY pair is in the uptrend because previous week’s candle is green, while the price is clearly rising on the 4H timeframe. And after the retest of the resistance line above I believe we will see a move down towards the target below at 111.569 because the pair overbought due to its proximity to the upper BB band and a bearish correction is likely.
Disclosure: I am part of Trade Nation's Influencer program and receive a monthly fee for using their TradingView charts in my analysis.
✅LIKE AND COMMENT MY IDEAS✅

CADJPY – Final Diagonal Before the Drop!We’ve been tracking CADJPY for years, and price continues to follow Elliott Wave structure with precision.
The major decline in 2024 completed wave (1) and triggered a higher-timeframe correction. Since then, price has developed a clear W–X–Y structure.
- W topped in late 2024
- X completed after a clean ABC decline
- Price is now in wave Y, unfolding as a zigzag (5-3-5)
Within Y, waves (A) and (B) have completed, and price is now pushing through the final 5-wave structure of wave (C). This final diagonal is what will complete the entire W–X–Y correction before the next major bearish leg begins.
Our focus is now on the ending diagonal forming in wave (C). Once this diagonal structure breaks, it will confirm that wave Y has completed and that the higher-timeframe downtrend is ready to resume.
Trade Idea:
Entry: Break of the diagonal
Stops: Above the break candle / above the final high of the diagonal
Targets:
TP1: 101.50 (1200 pips)
TP2: 95.00 (1850 pips)
Optional runner: Keep a portion open for long-term continuation
Goodluck and as always, trade safe!
See below for our previous CADJPY analysis:
Swing 1:
Swing 2:
Swing 3:
Swing 4:

Will CAD/JPY Hold Demand and Push Toward the Next Target?🍁 CAD/JPY SWING TRADE SETUP 💴
═════════════════════════════════════════════════════════════
📊 CURRENT MARKET LEVEL: 111.115 (Real-time as of Nov 19, 2025)
🎯 TRADE DIRECTION
BULLISH MOMENTUM ⬆️ | Swing Trade Framework
📍 ENTRY STRATEGY: LAYERED LIMIT ORDER APPROACH
Advanced Multi-Entry Technique - "Thief Strategy"
Execute multiple buy limit orders across key support levels to optimize entry execution:
🔹 Layer 1 (Strong Support): 110.000 JPY
🔹 Layer 2 (Mid-Range): 110.500 JPY
🔹 Layer 3 (Technical Level): 111.000 JPY
💡 PRO TIP: Scale your position sizing inversely with each layer - allocate 40% at Layer 1, 35% at Layer 2, 25% at Layer 3 for optimal risk management
Customization: Adjust layers based on your risk tolerance, account size, and recent price action. Tighter layers = higher frequency fills; wider layers = better averaging down potential.
🛑 STOP LOSS FRAMEWORK
Hard Stop Level: 109.500 JPY
⚠️ CRITICAL DISCLAIMER: This SL is a reference point ONLY. Set YOUR stop loss based on:
Your personal risk management rules
Account equity tolerance (typically 1-2% risk per trade)
Market volatility assessment
Your trading experience level
Remember: Your capital, your rules, your responsibility.
🎁 PROFIT TAKING TARGETS
Primary Target (1st Pullback): 111.875 JPY (+0.75 exit point)
Secondary Target (Strong Resistance): 112.500 JPY
Moving Average acts as dynamic resistance + overbought zone
⚠️ CRITICAL DISCLAIMER: TP levels are analytical observations, NOT recommendations.
Exit Decisions Should Factor In:
Real-time momentum indicators (RSI, Stochastic)
Volume confirmation at resistance zones
Daily market volatility
News/economic calendar events
Your profit/loss objectives
Take profits according to YOUR strategy, not someone else's target.
📈 TECHNICAL CONFLUENCE FACTORS
✅ Support Holds: 109.500 provides structural support
✅ Resistance Zone: Moving averages clustered near 112.00-112.500
✅ Overbought Consideration: RSI compression near resistance
✅ Volume Profile: Historical resistance identified
💰 CORRELATED PAIRS TO MONITOR
Track these pairs for sentiment shifts and early signals
🔴 Positive Correlation Pairs (Move WITH CAD/JPY)
1. USD/JPY ($)
Why: Both pairs have JPY as base currency
Impact: Strong BoJ policy changes affect both equally
Watch For: If USD/JPY breaks above 155, CAD/JPY likely follows
Correlation Strength: 85%+ (Very Strong)
2. AUD/JPY ($)
Why: Commodity-linked currency vs JPY (like CAD)
Impact: Risk-on sentiment drives both higher
Watch For: Parallel breakouts suggest broader yen weakness
Correlation Strength: 78%+ (Strong)
3. NZD/JPY ($)
Why: Higher-yielding commodity currency vs defensive JPY
Impact: Carry trade unwinds hit both simultaneously
Watch For: If these turn bearish, CAD/JPY likely follows
Correlation Strength: 75%+ (Strong)
🔵 Negative Correlation Pairs (Move OPPOSITE to CAD/JPY)
1. USD/CAD ($)
Why: Direct inverse - one's strength is the other's weakness
Impact: If USD strengthens, CAD weakens = CAD/JPY falls
Watch For: USD/CAD above 1.3400 warns of CAD/JPY weakness
Correlation Strength: -85%+ (Strong Inverse)
2. CAD/CHF ($)
Why: Both carry safe-haven currencies but different way
Impact: CAD weakness = both pairs decline
Watch For: Divergence indicates currency-specific news
Correlation Strength: -70%+ (Moderate Inverse)
🔑 KEY MARKET DRIVERS FOR THIS PAIR
Bank of Canada (BoC) Actions: Interest rate decisions & forward guidance - bullish for CAD
Bank of Japan (BoJ) Stance: Keeps JPY weak; defensive policies support the pair
Crude Oil Prices: 80% correlation - oil strength = CAD strength
US/Canada Economic Data: Employment, GDP, inflation prints (CPI)
Risk Sentiment: Periods of risk-on favor higher-yielding CAD over safe-haven JPY
⏰ OPTIMAL TRADING WINDOWS
Best Liquidity: 16:00-20:00 GMT (Overlap of Asian-American sessions)
Second Choice: 08:00-12:00 GMT (London-Asian overlap)
Avoid: 20:00-08:00 GMT (Low liquidity, wide spreads)
📋 PRE-TRADE CHECKLIST
Check BoC & BoJ calendar for upcoming events (48-72 hour window)
Verify USD/JPY direction - confirms broader yen momentum
Confirm AUD/JPY & NZD/JPY for carry sentiment
Check crude oil price action (impacts CAD bias)
Assess current RSI levels - avoid entries in extreme zones
Confirm entry limits are BELOW current price (limit orders only)
Position sizing = (Account Risk %) / (Entry to SL pips)
Set alerts on all layer entry points + alert on SL breach
⚡ IMPORTANT LEGAL & TRADING DISCLAIMERS
🔺 This analysis is educational and observational only - NOT financial advice
🔺 You assume 100% responsibility for all trading decisions
🔺 Past performance ≠ Future results
🔺 Forex trading carries substantial risk of loss
🔺 Never risk more than you can afford to lose
🔺 Adjust ALL levels (Entry, SL, TP) per YOUR risk tolerance
🔺 Consult a licensed financial advisor for personal guidance
Happy Trading & Manage Risk First! 📊✅
