CADJPY Will Grow! Long!
Please, check our technical outlook for CADJPY.
Time Frame: 12h
Current Trend: Bullish
Sentiment: Oversold (based on 7-period RSI)
Forecast: Bullish
The market is approaching a significant support area 106.659.
The underlined horizontal cluster clearly indicates a highly probable bullish movement with target 107.622 level.
P.S
We determine oversold/overbought condition with RSI indicator.
When it drops below 30 - the market is considered to be oversold.
When it bounces above 70 - the market is considered to be overbought.
Disclosure: I am part of Trade Nation's Influencer program and receive a monthly fee for using their TradingView charts in my analysis.
Like and subscribe and comment my ideas if you enjoy them!
CADJPY

Yen Pairs Falter at Technical Junctures Several yen pairs have stalled around resistance levels, despite solid rallies into them. But whether this could indicate the beginning of a deep pullback or eventual bullish breakout likely hinges on whether incoming data points towards a hard or soft landing in the US. Today I look out EUR/JPY, GBP/JPY, CHF/JPY and CAD/JPY crosses, and update analysis on USD/JPY.
Matt Simpson, market Analyst at City Index

CADJPY Rejection at Key Supply Zone – Bearish Move Ahead?Hello Traders! 👋
CADJPY is showing signs of weakness after testing the 107.478 – 108.504 supply zone. Price broke below the ascending trendline and is now retesting it as resistance. If this rejection holds, we could see strong bearish momentum pushing price toward the 104.644 support zone.
🔑 Key Levels to Watch:
Resistance Zone: 107.478 – 108.504
Current Price: 106.85
Next Bearish Target: 104.644
⚡ Bias: Bearish if rejection holds below 107.478. A clean close above 108.504 would invalidate this setup.
📌 Technical Confluence:
Trendline break ✅
Supply zone retest ✅
Lower highs forming ✅
What do you think? Will CADJPY respect this supply zone and drop, or will the bulls reclaim control?
💬 Drop your thoughts below & let’s discuss!
👍 Don’t forget to like, share, and follow for more setups. ❤️

CAD/JPY SENDS CLEAR BULLISH SIGNALS|LONG
Hello, Friends!
CAD/JPY pair is trading in a local downtrend which we know by looking at the previous 1W candle which is red. On the 6H timeframe the pair is going down too. The pair is oversold because the price is close to the lower band of the BB indicator. So we are looking to buy the pair with the lower BB line acting as support. The next target is 107.013 area.
Disclosure: I am part of Trade Nation's Influencer program and receive a monthly fee for using their TradingView charts in my analysis.
✅LIKE AND COMMENT MY IDEAS✅

XAU/USD | Gold at Record Highs – Can NFP Stop the Rally?By analyzing the gold chart on the 12-hour timeframe, we can see that the price continued its rally today, reaching $3,578 and printing a new all-time high (ATH)! After hitting this level, gold made a slight pullback to $3,510. Right now, the price has bounced back and is trading around $3,550.
So far, there are no clear signs on the higher timeframes that gold is ready to reverse from here. For that, we would need to see stronger bearish moves. The current momentum still supports further upside unless proven otherwise. That’s why it’s better to stay patient and wait for a real break or shift in market structure before looking for attractive trade setups.
Also, tomorrow we have the NFP report, which could trigger a drop in gold if the data comes in stronger than expected. Until then, we’ll wait — and if you guys strongly support this post, I’ll share my updated personal analysis a few hours before the release. Stay tuned!
Please support me with your likes and comments to motivate me to share more analysis with you and share your opinion about the possible trend of this chart with me !
Best Regards , Arman Shaban

CADJPY Is Bearish! Sell!
Take a look at our analysis for CADJPY.
Time Frame: 2h
Current Trend: Bearish
Sentiment: Overbought (based on 7-period RSI)
Forecast: Bearish
The market is approaching a key horizontal level 107.345.
Considering the today's price action, probabilities will be high to see a movement to 106.396.
P.S
We determine oversold/overbought condition with RSI indicator.
When it drops below 30 - the market is considered to be oversold.
When it bounces above 70 - the market is considered to be overbought.
Disclosure: I am part of Trade Nation's Influencer program and receive a monthly fee for using their TradingView charts in my analysis.
Like and subscribe and comment my ideas if you enjoy them!

CAD/JPY BULLISH BIAS RIGHT NOW| LONG
CAD/JPY SIGNAL
Trade Direction: short
Entry Level: 106.355
Target Level: 107.547
Stop Loss: 105.559
RISK PROFILE
Risk level: medium
Suggested risk: 1%
Timeframe: 9h
Disclosure: I am part of Trade Nation's Influencer program and receive a monthly fee for using their TradingView charts in my analysis.
✅LIKE AND COMMENT MY IDEAS✅

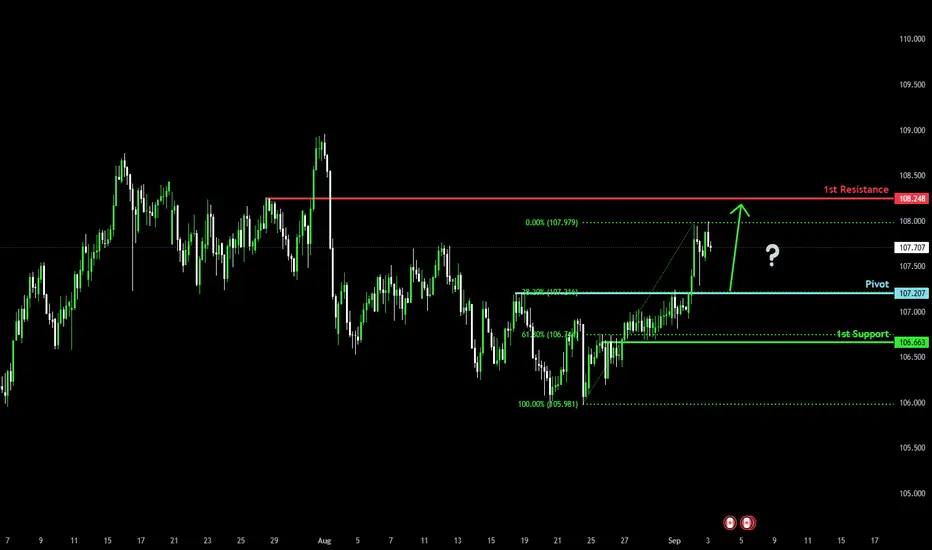
Bullish momentum to extend?CAD/JPY has bounced off the pivot, which acts as a pullback support that aligns with the 38.2% Fibonacci retracement and could bounce to the 1st resistance.
Pivot: 107.20
1st Support: 106.88
1st Resistance: 108.24
Disclaimer:
The above opinions given constitute general market commentary, and do not constitute the opinion or advice of IC Markets or any form of personal or investment advice.
Any opinions, news, research, analyses, prices, other information, or links to third-party sites contained on this website are provided on an "as-is" basis, are intended only to be informative, is not an advice nor a recommendation, nor research, or a record of our trading prices, or an offer of, or solicitation for a transaction in any financial instrument and thus should not be treated as such. The information provided does not involve any specific investment objectives, financial situation and needs of any specific person who may receive it. Please be aware, that past performance is not a reliable indicator of future performance and/or results. Past Performance or Forward-looking scenarios based upon the reasonable beliefs of the third-party provider are not a guarantee of future performance. Actual results may differ materially from those anticipated in forward-looking or past performance statements. IC Markets makes no representation or warranty and assumes no liability as to the accuracy or completeness of the information provided, nor any loss arising from any investment based on a recommendation, forecast or any information supplied by any third-party.

CADJPY ON SKYROCCADJPY about to ruthlessly go bullish, Its a late entry but the reward is worth taking!
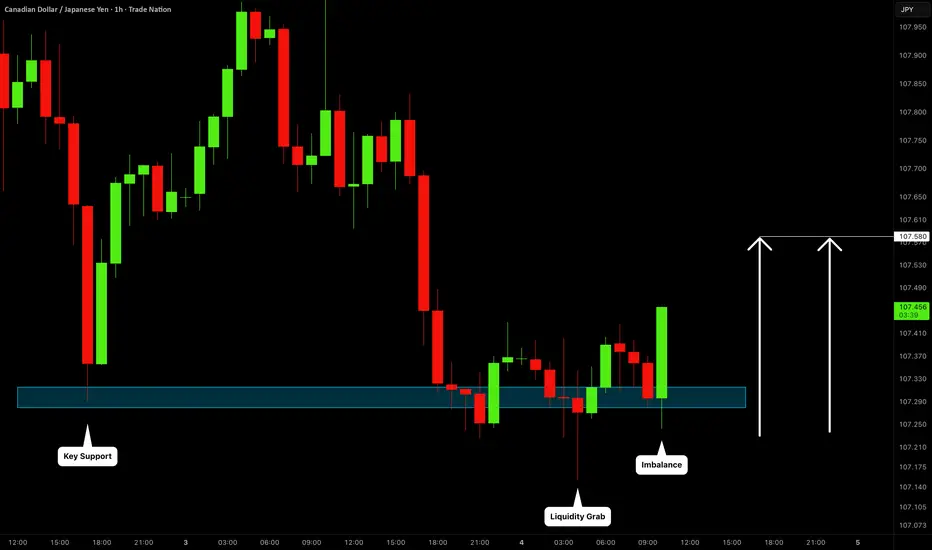
CADJPY: Bullish Move After Liquidity Sweep 🇨🇦🇯🇵
It looks like we have a confirmed bear trap after a test
of a key intraday horizonta support on CADJPY.
A formation of a bullish imbalance candle indicates
a strong bullish sentiment now.
I expect a bullish move to 107.58
❤️Please, support my work with like, thank you!❤️
I am part of Trade Nation's Influencer program and receive a monthly fee for using their TradingView charts in my analysis.
CAD_JPY LOCAL LONG|
✅CAD_JPY is going down now
But a strong support level
Is ahead around 107.200
Thus I am expecting a rebound
And a move up towards
The target of 107.400
LONG🚀
✅Like and subscribe to never miss a new idea!✅

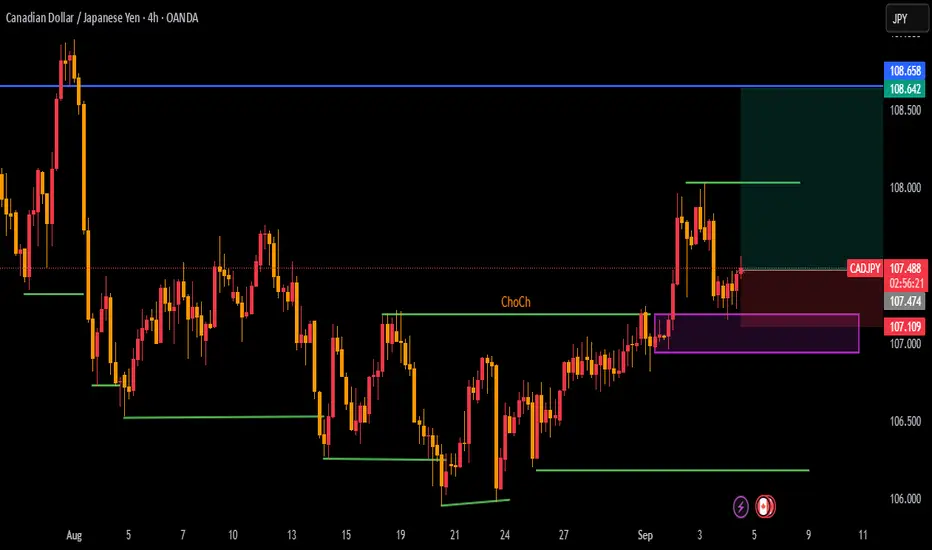
CADJPY (1H) - Swing Trading PlanThis trading plan outlines a swing trade opportunity on the CAD/JPY 1-hour chart, leveraging Smart Money Concepts to identify optimal entry points for a pending long position.
Market Structure Analysis:
The CADJPY pair has recently shown a strong upward trend, indicating a bullish bias. I observe a clear break of structure (BOS) to the upside, confirming the continuation of the bullish momentum. The market is currently undergoing a retracement, presenting an opportunity to enter at a discounted price within the overall bullish trend.
Key Entry Zones (Smart Money Concepts):
- HTF Order Block (Demand Zone): A significant Higher Time Frame (HTF) Order Block is identified around the 106.900 area. This zone represents an area where institutional buying occurred, making it a high-probability reversal point.
- Fair Value Gap (FVG): There is a Fair Value Gap (FVG) present just above the HTF Order Block, aligning with our potential entry zone. FVGs indicate an imbalance in the market, often attracting price back to fill the gap.
- 50% Discount (Equilibrium): The 50% retracement of the recent price swing (often referred to as equilibrium) aligns closely with the identified HTF Order Block and FVG, adding confluence to our entry area, signifying a discounted price.

CADJPY - Expecting Bullish Continuation In The Short TermH1 - Strong bullish momentum.
No opposite signs.
Until the two Fibonacci support zones hold I expect the price to move higher further.
If you enjoy this idea, don’t forget to LIKE 👍, FOLLOW ✅, SHARE 🙌, and COMMENT ✍! Drop your thoughts and charts below to keep the discussion going. Your support helps keep this content free and reach more people! 🚀
--------------------------------------------------------------------------------------------------------------------

Potential CADJPY downside
🚨 Potential Forex trade: CADJPY short 🚨
TA:
The weekly chart is forming lower swing highs
The daily has broken diagonal support and is testing the area as resistance
FA:
The BOC's rate cutting may continue. Unemployment remains high and is continuing to rise, while GDP growth is low.
The yen may strengthen if stock markets continue to fall, or if the bond yield crisis continues, due to its safe-haven status.
I'm looking for confirmation on lower time-frames.

Bullish bounce?CAD/JPY is falling towards the pivot and could bounce to the 1st resistance.
Pivot: 107.20
1st Support: 106.66
1st Resistance: 108.24
Risk Warning:
Trading Forex and CFDs carries a high level of risk to your capital and you should only trade with money you can afford to lose. Trading Forex and CFDs may not be suitable for all investors, so please ensure that you fully understand the risks involved and seek independent advice if necessary.
Disclaimer:
The above opinions given constitute general market commentary, and do not constitute the opinion or advice of IC Markets or any form of personal or investment advice.
Any opinions, news, research, analyses, prices, other information, or links to third-party sites contained on this website are provided on an "as-is" basis, are intended only to be informative, is not an advice nor a recommendation, nor research, or a record of our trading prices, or an offer of, or solicitation for a transaction in any financial instrument and thus should not be treated as such. The information provided does not involve any specific investment objectives, financial situation and needs of any specific person who may receive it. Please be aware, that past performance is not a reliable indicator of future performance and/or results. Past Performance or Forward-looking scenarios based upon the reasonable beliefs of the third-party provider are not a guarantee of future performance. Actual results may differ materially from those anticipated in forward-looking or past performance statements. IC Markets makes no representation or warranty and assumes no liability as to the accuracy or completeness of the information provided, nor any loss arising from any investment based on a recommendation, forecast or any information supplied by any third-party.
CADJPY Bullish Breakout!
HI,Traders !
#CADJPY made a bullish
Breakout of the falling resistance
And the breakout is confirmed
So we are bullish biased
And we will be expecting
A further bullish move up !
Comment and subscribe to help us grow !

CADJPY Bullish After CADJPY broke the trendline and the 20 sma is holding it up, it is now in a consolidation.
We will look to enter as soon as it breaks the consolidation to the upside.

CAD/JPY BEARISH BIAS RIGHT NOW| SHORT
Hello, Friends!
CAD/JPY is trending down which is clear from the red colour of the previous weekly candle. However, the price has locally surged into the overbought territory. Which can be told from its proximity to the BB upper band. Which presents a great trend following opportunity for a short trade from the resistance line above towards the demand level of 105.850.
Disclosure: I am part of Trade Nation's Influencer program and receive a monthly fee for using their TradingView charts in my analysis.
✅LIKE AND COMMENT MY IDEAS✅

CADJPY Will Go Higher From Support! Long!
Please, check our technical outlook for CADJPY.
Time Frame: 1D
Current Trend: Bullish
Sentiment: Oversold (based on 7-period RSI)
Forecast: Bullish
The market is approaching a significant support area 106.995.
The underlined horizontal cluster clearly indicates a highly probable bullish movement with target 108.913 level.
P.S
Overbought describes a period of time where there has been a significant and consistent upward move in price over a period of time without much pullback.
Disclosure: I am part of Trade Nation's Influencer program and receive a monthly fee for using their TradingView charts in my analysis.
Like and subscribe and comment my ideas if you enjoy them!

CAD/JPY - Channel Breakout (29.08.2025)The CAD/JPY Pair on the M30 timeframe presents a Potential Selling Opportunity due to a recent Formation of a Channel Breakout Pattern. This suggests a shift in momentum towards the downside in the coming hours.
Possible Short Trade:
Entry: Consider Entering A Short Position around Trendline Of The Pattern.
Target Levels:
1st Support – 106.47
2nd Support – 106.30
🎁 Please hit the like button and
🎁 Leave a comment to support for My Post !
Your likes and comments are incredibly motivating and will encourage me to share more analysis with you.
Best Regards, KABHI_TA_TRADING
Thank you.
Disclosure: I am part of Trade Nation's Influencer program and receive a monthly fee for using their TradingView charts in my analysis.

CADJPY Massive Short! SELL!
My dear subscribers,
CADJPY looks like it will make a good move, and here are the details:
The market is trading on 106.90 pivot level.
Bias - Bearish
Technical Indicators: Both Super Trend & Pivot HL indicate a highly probable Bearish continuation.
Target - 106.61
About Used Indicators:
The average true range (ATR) plays an important role in 'Supertrend' as the indicator uses ATR to calculate its value. The ATR indicator signals the degree of price volatility.
Disclosure: I am part of Trade Nation's Influencer program and receive a monthly fee for using their TradingView charts in my analysis.
———————————
WISH YOU ALL LUCK

Bearish reversal off pullback resistance?CAD/JPY is rising towards the pivot and could reverse to the 1st support.
Pivot: 107.14
1st Support: 106.08
1st Resistance: 107.73
Risk Warning:
Trading Forex and CFDs carries a high level of risk to your capital and you should only trade with money you can afford to lose. Trading Forex and CFDs may not be suitable for all investors, so please ensure that you fully understand the risks involved and seek independent advice if necessary.
Disclaimer:
The above opinions given constitute general market commentary, and do not constitute the opinion or advice of IC Markets or any form of personal or investment advice.
Any opinions, news, research, analyses, prices, other information, or links to third-party sites contained on this website are provided on an "as-is" basis, are intended only to be informative, is not an advice nor a recommendation, nor research, or a record of our trading prices, or an offer of, or solicitation for a transaction in any financial instrument and thus should not be treated as such. The information provided does not involve any specific investment objectives, financial situation and needs of any specific person who may receive it. Please be aware, that past performance is not a reliable indicator of future performance and/or results. Past Performance or Forward-looking scenarios based upon the reasonable beliefs of the third-party provider are not a guarantee of future performance. Actual results may differ materially from those anticipated in forward-looking or past performance statements. IC Markets makes no representation or warranty and assumes no liability as to the accuracy or completeness of the information provided, nor any loss arising from any investment based on a recommendation, forecast or any information supplied by any third-party.

CAD_JPY RISKY LONG|
✅CAD_JPY went down to retest
A horizontal support of 106.000
Which makes me locally bullish biased
And I think that a move up
From the level is to be expected
Towards the target above at 106.450
LONG🚀
✅Like and subscribe to never miss a new idea!✅
