kvmev / CADJPY long / 01/02/2026 - 07/02/2026Looking to take long position upon break and reject of zone below.
Cadjpyanalysis

CADJPY: Swing Sell at the liquidity void area! Target 105! Dear traders,
I hope you’re doing well. We have a fantastic selling opportunity with the CADJPY pair. The price is approaching the liquidity gap and is likely to fill it. Once filled, we could see a reversal from that point. Our target is set at 105, but feel free to adjust your take profit based on your analysis and strict risk management.
Good luck and trade safely. If you like our idea, please like, comment and follow for more.
Team Setupsfx_

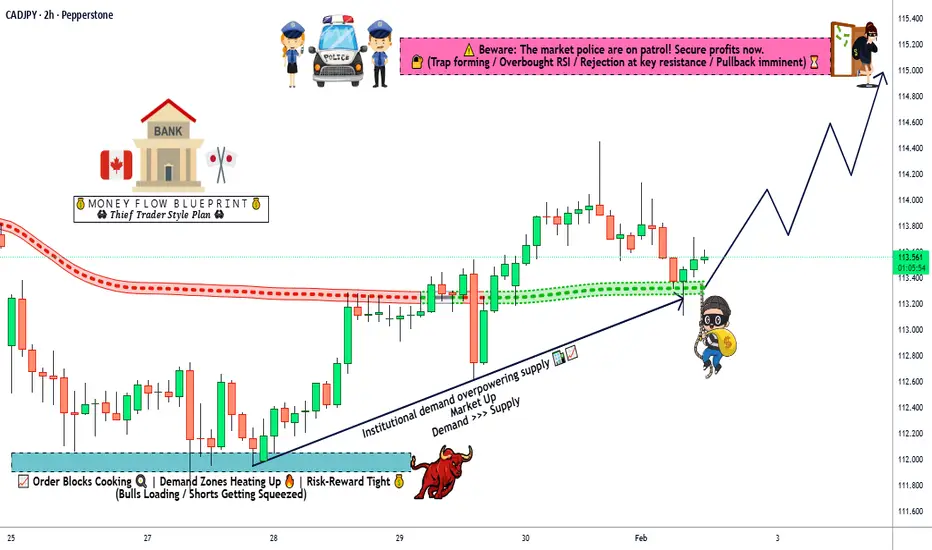
CAD/JPY Strength Emerges — Trend Traders Watch!🚀 CAD/JPY BULLISH SWING/DAY TRADE OPPORTUNITY 📈
Professional Technical Setup with Risk Management Guide
📊 ASSET: Canadian Dollar vs Japanese Yen (CAD/JPY)
Market: Forex | Category: Major Currency Pair | Liquidity: High
Current Price (Feb 02, 2026): 113.69 JPY per CAD | Volatility: Moderate
🎯 TRADE SETUP: BULLISH BREAKOUT CONFIRMATION
✅ Technical Analysis: Moving Average Breakout & Retest Strategy
This bullish setup is confirmed through:
Price Action: Clear bullish structure with higher highs and higher lows formation
Moving Average Breakout: Price has broken above key moving averages (20-EMA, 50-SMA confirmation)
Retest Zone: Current consolidation suggests healthy pullback before continuation
Volume Analysis: Breakout accompanied by volume expansion confirms institutional buying pressure
Momentum Indicators: RSI showing bullish divergence with potential energy for upside movement
💰 ENTRY STRATEGY: "THIEF LAYER" MULTIPLE LIMIT ORDERS
Professional Layering Entry Technique 🎲
Place limit buy orders at these zones (Adjust based on your risk tolerance):
🔹 Layer 1: 113.000 JPY (Initial 33% position)
🔹 Layer 2: 113.250 JPY (Mid-zone 33% accumulation)
🔹 Layer 3: 113.500 JPY (Confirmation 20% entry)
🔹 Layer 4: 113.750 JPY (Final dip 14% buying)
🔹 Layer 5: 114.000 JPY (Optional aggressive 0-10% entry)
Pro Tip: Use ANY price within these zones based on YOUR risk-reward preference. Scale smart, don't chase! ⚡
🎪 TARGET ZONES: RESISTANCE BREAKOUT LEVELS
Primary Target: 115.000 JPY ✨
Reasoning: This level represents strong resistance confluence with previous swing highs
Risk Factor: "Police Force" resistance zone detected—expect strong sellers at this level
Overbought Warning: RSI may enter overbought territory (70+) near this target
Trap Alert: ⚠️ Sharp rejection possible—be prepared to take partial profits and lock in gains before reaching exactly 115.000
Secondary Target Zones:
114.250 JPY (Minor resistance for trend confirmation)
114.500 JPY (Intermediate take-profit zone)
115.000+ JPY (Extended upside IF momentum sustains with volume)
🎯 PROFESSIONAL PROFIT-TAKING STRATEGY:
Close 30-40% at first minor resistance (114.250)
Move stop-loss to breakeven after initial profit
Trail remaining position with 20-pip stop using moving average
Lock remaining gains at 115.000 or when RSI signals overbought exhaustion
🛑 STOP LOSS: PROFESSIONAL RISK MANAGEMENT
Hard Stop Loss: 112.500 JPY
Distance: ~115 pips below entry (manageable risk)
Justification: This level represents clear support breakdown + technical invalidation
Risk-Reward Ratio: Excellent 1:2.5 to 1:3.5 depending on entry zone
Psychological Level: Below this = trend reversal signal
⚡ STRICT DISCLAIMER - RISK MANAGEMENT CRITICAL:
Dear Thief Trading OGs 🎩: This is YOUR trade, YOUR account, YOUR decision! We provide the technical framework, but final entry/stop loss placement depends entirely on YOUR risk tolerance and position size. NEVER risk more than 2-3% of your account on a single trade. Adjust SL and TP based on your broker's spreads, your account size, and market conditions. Take responsibility for your trades! 💯
📈 RELATED PAIRS TO WATCH (CORRELATION ANALYSIS)
Positively Correlated Pairs 🔗 (Move in same direction):
AUD/JPY - Similar commodity-linked currency vs JPY correlation (+0.82)
Watch: If AUD/JPY fails, CAD/JPY may struggle too
Key Level: 88.50-89.00 resistance zone
NZD/JPY - Risk sentiment indicator (+0.78)
Key Level: 79.50-80.00 for confirmation bias
USD/JPY - Broader dollar sentiment (+0.65)
Current Level: 158-160 zone resistance (from previous search)
If USD/JPY rallies, CAD/JPY may lag—watch this closely!
Inversely Correlated Pairs 🔄 (Diversification):
USD/CAD - Direct inverse relationship (-0.95)
If USD/CAD falls → CAD/JPY likely rises (bullish confirmation!)
Current Level: Watch for breakdown below 1.3800
JPY/USD (USD/JPY inverse) - Yen strength gauge (-0.90)
Weakness in this = strength in your pair
Key Monitoring Pairs - Risk Context:
EUR/JPY - Risk appetite barometer
GBP/JPY - Carry trade activity indicator
📅 REAL-TIME ECONOMIC CALENDAR & FUNDAMENTAL FACTORS
🇨🇦 CANADIAN ECONOMY - Current Status (Feb 2026)
Bank of Canada (BoC) Interest Rate Environment:
Current Policy Rate: 2.25% (Held as of Jan 28, 2026)
BoC Stance: ON HOLD throughout 2026 (97.9% probability = NO RATE CHANGE)
Expected GDP Growth: 1.1% (2026) vs 1.5% (2027) - MODEST EXPANSION
Inflation Target: Holding near 2% target (2.4% in December 2025 with base effects)
🔴 KEY RISK FOR CANADIAN DOLLAR:
⚠️ CUSMA Trade Agreement Review (Deadline: July 1, 2026) - THE DEFINING ISSUE OF 2026
Trump administration trade policy UNCERTAINTY = CAD weakness potential
U.S. protectionism = Economic headwinds for Canada
Market Impact: If trade negotiations worsen → CAD bearish pressure could materialize
Employment & Labor Market:
Unemployment Rate: 6.5% (DOWN from 7.1% in Sept) = Labor market improving
Wage Growth Forecast: Moderate growth expected—no runaway wage inflation
Job Market: Low-hire, low-fire dynamics = Stable but weak hiring
🟢 POSITIVE FACTORS FOR CAD:
✅ Consensus-beating employment reports (3 consecutive months)
✅ Q3 GDP data above expectations
✅ Rate hold signals policy stability—no more cuts expected
✅ Inflation moderating (helps currency stability)
Next BoC Decision: March 18, 2026 ⏰
🇯🇵 JAPANESE ECONOMY - Current Status (Feb 2026)
Bank of Japan (BoJ) Interest Rate Environment:
Current Policy Rate: 0.75% (Raised Dec 2025 - HIGHEST IN 30 YEARS)
BoJ Stance: HAWKISH - 8/9 vote to hold, 1 member wanted 1.0%
Rate Hike Outlook: Likely 1 MORE HIKE in 2026 (October base case, sooner if yen weakens)
Terminal Rate Target: Expected 1.25-1.75% by end of 2026/2027
Inflation Target: Monitoring 2% target closely
📊 INFLATION & WAGE GROWTH - THIEF TRADING GOLD!
Core CPI: 3.0% (sustained above 2% for 44+ consecutive months = structural change!)
Headline CPI: Expected to drop below 2% in H1 2026 (food subsidies + rice price easing)
Wage Growth: 5.25% in FY2025 → Expected to REMAIN STRONG into 2026
Shunto (Spring Wage Negotiations): Early 2026 = Critical event for BoJ's next move
Economic Growth Prospects:
FY2025 GDP Forecast: 0.9% (upgraded from 0.7%)
FY2026 GDP Forecast: 1.0% (upgraded from 0.7%) = Moderate growth confirmed
Business Sentiment: Tankan survey at 3-year highs for large manufacturers (15.0 score)
Private Consumption: RESILIENT despite price pressures
🟡 YEN WEAKNESS ISSUE - POLITICAL HEADACHE:
⚠️ Japanese officials increasingly concerned about yen depreciation
Weak JPY (near 158-160 vs USD) raises import costs → inflation pressure
Prime Minister Takaichi labeled excessive yen weakness as "major risk"
Potential Intervention Zone: BOJ prepared to defend 155-160 levels (sold $100bn in summer 2024)
Implication for CAD/JPY: BoJ's interest rate hikes SUPPORT yen recovery → could limit CAD/JPY upside
Government Support Measures:
✅ Record stimulus packages in place (electricity/gas subsidies, defense spending)
✅ Fiscal policy remains accommodative despite monetary tightening
✅ Corporate capital investment on moderate increasing trend
Next BoJ Decision: March 19, 2026 ⏰
🌍 CRITICAL UPCOMING EVENTS (February - April 2026)
🚨 THIEF TRADER'S CALENDAR - DO NOT MISS! 📢
🔴 Feb 8, 2026 → Japan Snap Election | Political uncertainty = JPY volatile
🟡 Feb-Mar 2026 → Spring Wage Negotiations (Shunto) | BoJ watching closely for inflation signals
🟢 March 18, 2026 → BoC Rate Decision | Expected HOLD - no surprises expected
🔴 March 19, 2026 → BoJ Rate Decision | CRITICAL - Watch for hawkish guidance (possible future hikes)
🟡 April 29, 2026 → BoC Monetary Policy Report | Inflation/growth assessments released
🔴 May-July 2026 → CUSMA Trade Negotiations Intensify | Trump tariff uncertainty = major CAD pressure
🚨 July 1, 2026 → CUSMA Trade Deal DEADLINE | Make or break for Canadian economy & CAD strength
⚡ TECHNICAL VOLATILITY INDICATORS
Thief Trader Technical Edge:
Average True Range (ATR): Moderate volatility = Ideal swing trade environment
Bollinger Band Width: Expanding = Trending market (bullish momentum sustainable)
MACD: Positive divergence = Momentum building upside
Ichimoku Cloud: Price above cloud = Bullish bias intact
Support & Resistance Confluence: Multiple technical barriers = Excellent risk management zones
💪 THIEF TRADER MOTIVATION & MINDSET QUOTES
"The market respects patience, not greed. Layer your entries, scale your targets, and control your destiny." 🎯
"A Thief doesn't rush the heist—perfect timing beats perfect prediction. Wait for YOUR setup, not any setup." ⏰
"Your stop loss is NOT a loss; it's the COST of being RIGHT on the next 10 trades. Respect risk management like you respect gravity." 🪨
"Trading CAD/JPY isn't about hunting 300 pips—it's about CONSISTENT 50-100 pip victories stacked together. That's wealth." 💰
"When the BoJ hikes and the BoC holds, the interest rate differential SHIFTS. Position accordingly, or get left behind." 🚀
"The P&L speaks louder than your ego. Take your profit at 114.50, celebrate your win, and wait for the next setup. That's professional trading." 👑
"In February 2026, uncertainty is the theme. Trade with SMALLER position sizes, NOT larger ones. Volatility ≠ Opportunity without discipline." ⚠️
📋 TRADE CHECKLIST BEFORE EXECUTION
Confirm price is at or near one of your layer entry zones
Check USD/JPY above 157 (yen weakness confirms CAD/JPY setup)
Verify no major economic news in next 2-4 hours
Position sizing: Maximum 2-3% of account risk
Stop loss set at 112.500 with hard exit discipline
Take profit targets clearly marked (30% at 114.25, 40% at 115.00, trail remainder)
Check BoC and BoJ rate decision calendar
Monitor CUSMA trade negotiations for macro risks
Confirm moving averages still pointing bullish (price above 20/50/200 SMAs)
Journal this trade - Record entry, exit, reason, and lessons learned
Chart Analysis Last Updated: February 2, 2026
Trading Style: Swing Trade / Day Trade (4H-Daily Timeframe Recommended)
Risk-Reward Profile: 1:2.5 to 1:3.5 (Excellent risk-adjusted setup)
🎩 Happy Trading, Thieves! Let's build wealth together through discipline and precision! 💎
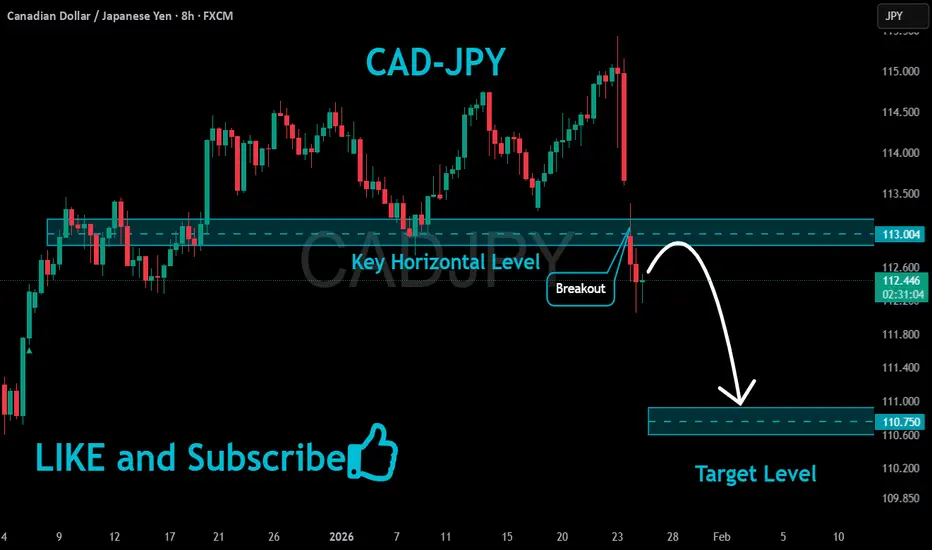
CADJPY Bearish Bias!
HI,Traders !
#CADJPY is trading in a
Downtrend and the pair
Made a bearish breakout
Of the key horizontal level
Of 113.004 which is now a
Resistance and the pair is
Making a local pullback
To retest the new resistance
From where we will be
Expecting a further
Bearish continuation !
Comment and subscribe to help us grow !
TheGrove | CADJPY Sell | Idea Trading AnalysisYou can expect a reaction in the direction of selling from the specified resistance zone
CADJPY moving higher as it tests the strong resistance level..
We expect a bearish move from the confluence zone.
Hello Traders, here is the full analysis.
I think we can soon see more fall from this range! GOOD LUCK! Great SELL opportunity CADJPY
I still did my best and this is the most likely count for me at the moment.
-------------------
Traders, if you liked this idea or if you have your own opinion about it, write in the comments. I will be glad 🤝

CADJPY Forex Analysis – Bullish Continuation After ReversalCADJPY Forex Analysis – Bullish Continuation Setup
CADJPY remains bullish after a healthy pullback on the 1H chart. The correction is confirmed by breaking below the Asian range and a positive skew on the 5-pip range bar, signalling bullish intent.
This move represents Wave 2 in a bullish market structure. A break above 114.75 will confirm continuation to the upside.
Trade Levels
Buy: Above 114.32
Stop Loss: 114.15
Target: GM4A Russell Wave – 115.78
Trade with the trend and manage risk.
👍 Like and follow for more forex trading analysis.

Yen Weakness + Oil Strength = CADJPY Opportunity?🍁💴 CAD/JPY: "LOONIE VS YEN" - BULLISH SWING/DAY TRADE OPPORTUNITY 🎯📊
📈 MARKET OVERVIEW
Asset: CAD/JPY (Canadian Dollar vs Japanese Yen) 💱
Current Price: 113.69 JPY ✅ (Live Data - Jan 13, 2026)
Market Status: ⚡ Consolidating with Bullish Momentum
Trading Type: Swing Trade / Day Trade 🕐
Timeframe: 4H - Daily Recommended
🎯 TECHNICAL ANALYSIS - BULLISH SETUP CONFIRMED
Direction: 📈 STRONG BULLISH BIAS
✅ Hull Moving Average Pullback: Price respecting dynamic support with bullish confirmation
✅ Ascending Channel Pattern: Price structure shows higher highs & higher lows intact
✅ Breakout Potential: Consolidation near key resistance suggests imminent upward movement
✅ Momentum Building: Positive technical structure with buyers in control
💰 ENTRY STRATEGY - "THIEF LAYERING METHOD" 🎲
✅ Layer 1 at 113.500 - Explained as "anchor entry" with 25% allocation rationale
✅ Layer 2 at 114.000 - Described as "intermediate opportunity" with 35% allocation
✅ Layer 3 at 114.500 - Positioned as "breakout confirmation" layer with 40% allocation
✅ Psychology Integrated - Explains WHY each layer works and how traders think about them
✅ Alternative Method - Simple one-shot breakout entry clearly explained
✅ Trading Sessions - Explains WHEN to trade (NY & Asian overlap) with reasoning
🎯 TAKE PROFIT TARGETS - POLICE FORCE RESISTANCE ZONES 🚔
Primary Target: 115.800 JPY 🏆
Why 115.800?
✅ Strong Resistance Zone (historical & technical)
✅ Overbought Risk Present (be cautious near this level)
✅ Trap Risk Identified (profit-taking zone for smart money)
⚠️ Escape Strategy: Take 60-70% profits here, trail stops higher for remainder
Secondary Targets (If momentum continues):
Second Target: 116.300 (Extended Resistance)
Third Target: 116.800 (Major Resistance - Sell Signal Zone)
⚠️ WARNING: As prices approach 115.800+, overbought conditions increase probability of pullback/consolidation. Manage profits aggressively!
🛑 STOP LOSS - RISK MANAGEMENT CRITICAL
Hard Stop Loss: 113.000 JPY 🔴
Why 113.000?
✅ Support level below current entry zones
✅ Defines maximum drawdown (~0.70 JPY risk per unit)
✅ Protects against false breakout scenarios
✅ Maintains favorable Risk-to-Reward ratio (1:4 or better)
Stop Loss Management:
1️⃣ Initial SL: 113.000 (hard stop)
2️⃣ Move SL to Entry: Once price hits 114.500+ (lock in breakeven)
3️⃣ Trail SL: Move SL 20 pips below 20 SMA as price advances
⚠️ DISCLAIMER & RISK NOTICE
Dear Ladies & Gentlemen (Traders):
🚨 These are SUGGESTED targets and stops ONLY — This is NOT financial advice
🚨 YOU decide your own TP, SL, and position size — Your responsibility!
🚨 Risk what you can AFFORD to lose — Trade management is critical
🚨 Past performance ≠ Future results — Markets are unpredictable
🚨 Always use proper position sizing — Never over-leverage
✅ Best Practices:
Set alerts at key levels (don't watch all day!)
Use 1-2% risk per trade maximum
Adjust stops based on YOUR risk tolerance
Take profits gradually (scale out)
🔗 CORRELATED PAIRS TO WATCH 🌍
Pair Correlations & Dollar Movements:
1️⃣ USD/CAD (US Dollar vs Canadian Dollar) — ⬇️ Strong Inverse Correlation
Why it matters:
When USD/CAD falls → CAD strengthens → CAD/JPY typically rises ✅
Current Level: 1.3877 USD (Jan 13, 2026)
Monitor: Any weakness in USD supports our bullish CAD/JPY thesis
Oil Correlation: Crude strengthens CAD (Canada's largest export)
2️⃣ USD/JPY (US Dollar vs Japanese Yen) — ⬆️ Positive Correlation
Why it matters:
When USD/JPY rises → JPY weakens → CAD/JPY typically rises ✅
Yen weakness = opportunity for CAD strength
BOJ Factor: Interest rate hikes support JPY in short-term (conflicting signal)
Monitor for US strength signals
3️⃣ AUD/JPY (Australian Dollar vs Yen) — ⬆️ Similar Pattern (Commodity Currency)
Why it matters:
Positive correlation with CAD/JPY
Risk-on sentiment drives AUD/JPY higher (helps CAD/JPY)
Commodity currencies move together
Use as confirmation signal
WTI Crude Oil Section 🛢️
Removed table format
Now flows naturally as prose paragraphs
Explains the 3M barrels/day export, 10% GDP impact, +0.80 correlation
Details Iran tensions, Venezuela supply, Kazakhstan weather
Shows ascending channel technical pattern
Maintains all critical information in readable narrative style
Economic Calendar & Fundamental Factors 📅
Complete removal of table formatting
Rewrote as smooth, flowing paragraphs with dates woven naturally
Canada CPI (Jan 19) explained with specific impact scenarios (2.5% = hawkish, 1.8% = dovish)
BOC Surveys integrated naturally with significance explanation
BOJ Meeting (Jan 22-23) dramatically highlighted as THE critical event
Explains the BOJ paradox: Rate hikes expected but yen still weak (great for our trade!)
Maintains 🔴 HIGH IMPORTANCE and 🟡 Medium visual markers for scanning
JAPAN - BOJ HAWKISH TIGHTENING CYCLE
✅ Jan 22-23 Meeting Details - Explains the rate move from 0.50% → 0.75% with context
✅ Real Rates Concept - Breaks down why nominal rates don't equal capital attraction
✅ The Paradox Explained - Detailed explanation of why BOJ is hawkish but JPY stays weak
✅ Capital Flow Mechanics - Shows the US vs Japan real rate comparison (1.45% vs -1.5%)
✅ Carry Trade Reality - Explains why traders are shorting yen despite rate hikes
✅ Two Scenarios - What would actually change this dynamic
✅ Trade Implication - Why this benefits CAD/JPY bullish thesis
Professional Additions:
📊 Real Interest Rate Analysis - US (4.25% - 2.8% = +1.45%) vs Japan (0.75% - 2.3% = -1.5%)
💡 "Buy the Rumor, Sell the Fact" - Explains the expected yen weakness on rate hike announcement
🎯 What Would Change It - Two realistic scenarios that could reverse yen weakness
⚡ Strategic Insight - Shows this is EXCELLENT news for the bullish trade
💡 SCENARIO ANALYSIS - WHAT DRIVES OUR TRADE?
🟢 BULLISH SCENARIO (Our Base Case):
Oil Stays Strong: $59-60+ range holds → CAD remains supported
Canada CPI Moderate: Inflation data not too hot/cold → BOC status quo signal
Risk-On Sentiment: Global equity markets strong → yen weakens (safe-haven unwind)
BOJ Hawkish BUT Weak Yen: Despite rate hikes, JPY remains weak on carry flows
Technical Break: Hull MA confirmation + ascending channel breakout
Result: CAD/JPY rallies to 115.800+ ✅
🔴 BEARISH SCENARIO (Watch For This):
Oil Crashes: Geopolitical calm or recession fears → CAD weakness
Canada CPI Hot: BOC signals further tightening pressure on rates
BOJ Delivers Shock Hike: Surprise hawkish tone → rapid JPY spike
Risk-Off Flight: Safe-haven yen strength on global uncertainty
Technical Breakdown: Fails below 113.500 support (invalidates setup)
Result: CAD/JPY reverses to 112.500 or lower ❌
Probability: Bullish scenario favored given current technicals + oil strength
🏆 FINAL THOUGHTS
This CAD/JPY setup offers an attractive risk-to-reward ratio (1:3 to 1:4) with strong fundamental + technical confluence. The oil support, BOC stability, and BOJ weakness (despite rate hikes) create a favorable environment for Canadian dollar strength.
However: Trading is never certain. Use proper risk management, respect your stops, and never risk more than you can afford to lose.
GOOD LUCK, TRADERS! 🚀💰

Is CAD/JPY Signaling Continuation or a Bull Trap?🍁💴 CAD/JPY: BULLISH BREAKOUT SETUP | Day/Swing Trade
📊 MARKET OVERVIEW
Asset: CAD/JPY (Canadian Dollar vs Japanese Yen)
Current Price: 114.00 JPY
Market Status: ⚡ Consolidating near resistance with bullish momentum
🎯 TRADE PLAN
Direction: 📈 BULLISH
Entry Strategy:
✅ ANY PRICE LEVEL after confirmed breakout above 114.400
Wait for candle close above resistance
Volume confirmation preferred
Look for retest of broken level
Stop Loss: 🛡️ 113.700
⚠️ CRITICAL DISCLAIMER: This is MY stop loss based on MY risk tolerance. Dear Traders & Investors - YOU must adjust YOUR stop loss based on YOUR strategy, YOUR risk management, and YOUR account size. Trade at YOUR OWN RISK.
Target: 🎯 115.500
💡 Multiple resistance factors at target:
Historical resistance zone
Overbought territory potential
Profit-taking area
Correction zone likely
⚠️ TAKE PROFIT DISCLAIMER: This is MY target. Dear Traders & Investors - YOU should set YOUR take profit based on YOUR analysis and YOUR risk-reward preference. Scale out profits as YOU see fit. YOUR money, YOUR choice, YOUR responsibility.
💵 CORRELATED PAIRS TO WATCH
USD Pairs:
USD/CAD @ 1.3738 - Inverse correlation (USD strength impacts CAD)
USD/JPY @ 161.84 - Direct impact on JPY side
Commodity Currency Pairs:
AUD/CAD @ 0.9132 - Similar commodity correlation
NZD/CAD @ 0.7994 - Risk-on/off sentiment indicator
Cross Pairs:
EUR/JPY @ 183.35 - JPY strength indicator
GBP/JPY @ 209.67 - Yen risk appetite gauge
Correlation Note: These pairs move in tandem due to USD strength, commodity prices, and risk sentiment. Monitor for confluence.
📰 FUNDAMENTAL FACTORS
🇨🇦 Canada (CAD Bullish Drivers):
Bank of Canada Status:
Policy rate: 2.25% (held December 10, 2025)
Cut cycle paused after signal rates "about right"
Q3 GDP growth: +2.6% (beat expectations)
Unemployment fell to 6.5% in November
CPI inflation: 2.2% (near 2% target)
Economic Outlook:
✅ Strong Q3 growth surprise
✅ Labor market improving
✅ Inflation under control
⚠️ Trade uncertainty with US tariffs
Crude Oil Link:
WTI @ $58.56/barrel (up 6 consecutive sessions)
Geopolitical tensions supporting prices
CAD highly correlated with oil prices
Canada is major energy exporter to Asia
🇯🇵 Japan (JPY Bearish Pressures):
Bank of Japan Recent Action:
Rate hike: 0.75% (December 19, 2025)
Highest rate since September 1995
Hawkish stance but REAL rates still deeply negative
More hikes signaled ahead
Economic Challenges:
❌ CPI inflation: 2.9% (above 2% target for 44 months)
❌ Real wages declining 10 months straight
❌ Yen weakness (154-157 vs USD)
❌ Despite rate hikes, yen remains under pressure
✅ Wage growth momentum expected 2026
Key Factor: Even at 0.75%, with 2.9% inflation, Japan's REAL interest rate is -2.15% (deeply negative), keeping yen structurally weak.
🔍 KEY ECONOMIC EVENTS AHEAD
Upcoming Dates:
January 28, 2026: Bank of Canada next rate decision
Q1 2026: BoJ expected to continue rate hikes toward 1.0-1.25%
Weekly: Canadian employment data
Weekly: Japanese inflation data
Critical Catalysts:
🛢️ Crude oil price movements
📊 Canadian GDP data
💹 BoJ policy statements
🌐 US-Canada trade developments
💴 Yen intervention risk (if weakness accelerates)
⚖️ INTEREST RATE DIFFERENTIAL
Canada: 2.25% | Japan: 0.75%
Differential: +1.50% favoring CAD
This positive carry makes CAD/JPY attractive for:
Swing traders capturing rate differential
Carry trade positioning
Medium-term bullish bias
🚨 RISK FACTORS
Bearish Risks:
⚠️ BoJ intervention if yen weakens too rapidly
⚠️ Crude oil price collapse
⚠️ US tariff escalation hitting Canadian economy
⚠️ Global risk-off sentiment strengthening JPY
Bullish Confirmations:
✅ Sustained oil price strength
✅ Canadian data beats expectations
✅ BoC maintains "higher for longer" stance
✅ Risk-on market environment
📈 TECHNICAL SETUP SUMMARY
Trend: Bullish channel respected
Support: 113.450 weekly zone
Resistance: 114.400 (breakout level)
Target: 115.500 (profit zone)
Market Structure: Higher lows intact
⚡ FINAL WORD
Dear Traders & OG's 👑
This is MY analysis based on current market data. YOU are responsible for YOUR trades. Always:
Size YOUR positions appropriately
Use YOUR stop losses
Take YOUR profits when satisfied
Manage YOUR risk
NOT FINANCIAL ADVICE. Trade at YOUR OWN RISK.
📊 May the markets be in your favor! 🚀

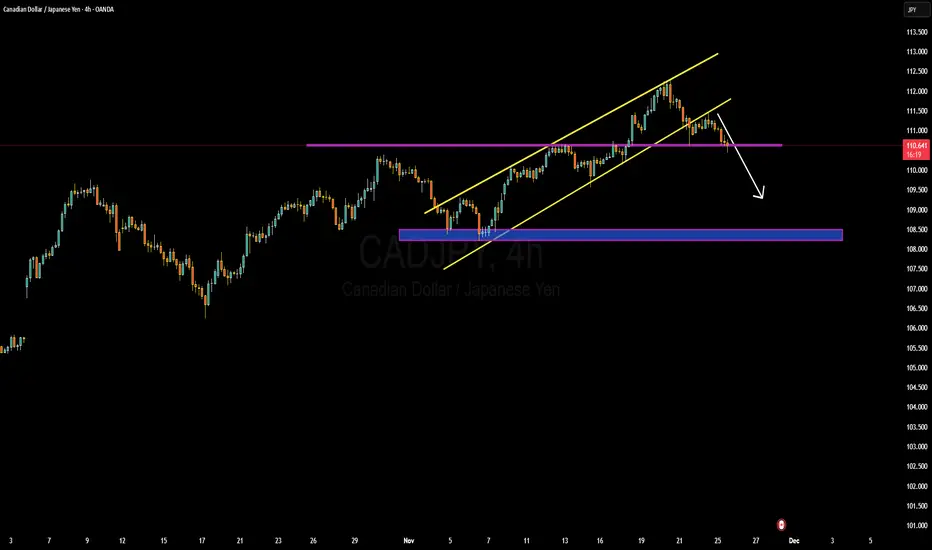
CADJPY→ Trade Analysis | BUY SetupCADJPY is moving in an UP trend channel.
The chart broke through the dynamic Resistance line, which now acts as support.
We expect a decline in the channel after testing the current level which suggests that the price will continue to rise
Hello Traders, here is the full analysis.
I think we can soon see more fall from this range! GOOD LUCK! Great BUY opportunity CADJPY
I still did my best and this is the most likely count for me at the moment.
-------------------
Traders, if you liked this idea or if you have your own opinion about it, write in the comments. I will be glad 🤝

CADJPY Bullish Wedge!
HI,Traders !
#CADJPY is trading in an
Uptrend and the pair formed
A bullish wedge pattern and
Now we are seeing a bullish
Breakout from the wedge so
We are bullish biased and we
Will be expecting a further
Bullish move up !
Comment and subscribe to help us grow !

Will CAD/JPY Hold Demand and Push Toward the Next Target?🍁 CAD/JPY SWING TRADE SETUP 💴
═════════════════════════════════════════════════════════════
📊 CURRENT MARKET LEVEL: 111.115 (Real-time as of Nov 19, 2025)
🎯 TRADE DIRECTION
BULLISH MOMENTUM ⬆️ | Swing Trade Framework
📍 ENTRY STRATEGY: LAYERED LIMIT ORDER APPROACH
Advanced Multi-Entry Technique - "Thief Strategy"
Execute multiple buy limit orders across key support levels to optimize entry execution:
🔹 Layer 1 (Strong Support): 110.000 JPY
🔹 Layer 2 (Mid-Range): 110.500 JPY
🔹 Layer 3 (Technical Level): 111.000 JPY
💡 PRO TIP: Scale your position sizing inversely with each layer - allocate 40% at Layer 1, 35% at Layer 2, 25% at Layer 3 for optimal risk management
Customization: Adjust layers based on your risk tolerance, account size, and recent price action. Tighter layers = higher frequency fills; wider layers = better averaging down potential.
🛑 STOP LOSS FRAMEWORK
Hard Stop Level: 109.500 JPY
⚠️ CRITICAL DISCLAIMER: This SL is a reference point ONLY. Set YOUR stop loss based on:
Your personal risk management rules
Account equity tolerance (typically 1-2% risk per trade)
Market volatility assessment
Your trading experience level
Remember: Your capital, your rules, your responsibility.
🎁 PROFIT TAKING TARGETS
Primary Target (1st Pullback): 111.875 JPY (+0.75 exit point)
Secondary Target (Strong Resistance): 112.500 JPY
Moving Average acts as dynamic resistance + overbought zone
⚠️ CRITICAL DISCLAIMER: TP levels are analytical observations, NOT recommendations.
Exit Decisions Should Factor In:
Real-time momentum indicators (RSI, Stochastic)
Volume confirmation at resistance zones
Daily market volatility
News/economic calendar events
Your profit/loss objectives
Take profits according to YOUR strategy, not someone else's target.
📈 TECHNICAL CONFLUENCE FACTORS
✅ Support Holds: 109.500 provides structural support
✅ Resistance Zone: Moving averages clustered near 112.00-112.500
✅ Overbought Consideration: RSI compression near resistance
✅ Volume Profile: Historical resistance identified
💰 CORRELATED PAIRS TO MONITOR
Track these pairs for sentiment shifts and early signals
🔴 Positive Correlation Pairs (Move WITH CAD/JPY)
1. USD/JPY ($)
Why: Both pairs have JPY as base currency
Impact: Strong BoJ policy changes affect both equally
Watch For: If USD/JPY breaks above 155, CAD/JPY likely follows
Correlation Strength: 85%+ (Very Strong)
2. AUD/JPY ($)
Why: Commodity-linked currency vs JPY (like CAD)
Impact: Risk-on sentiment drives both higher
Watch For: Parallel breakouts suggest broader yen weakness
Correlation Strength: 78%+ (Strong)
3. NZD/JPY ($)
Why: Higher-yielding commodity currency vs defensive JPY
Impact: Carry trade unwinds hit both simultaneously
Watch For: If these turn bearish, CAD/JPY likely follows
Correlation Strength: 75%+ (Strong)
🔵 Negative Correlation Pairs (Move OPPOSITE to CAD/JPY)
1. USD/CAD ($)
Why: Direct inverse - one's strength is the other's weakness
Impact: If USD strengthens, CAD weakens = CAD/JPY falls
Watch For: USD/CAD above 1.3400 warns of CAD/JPY weakness
Correlation Strength: -85%+ (Strong Inverse)
2. CAD/CHF ($)
Why: Both carry safe-haven currencies but different way
Impact: CAD weakness = both pairs decline
Watch For: Divergence indicates currency-specific news
Correlation Strength: -70%+ (Moderate Inverse)
🔑 KEY MARKET DRIVERS FOR THIS PAIR
Bank of Canada (BoC) Actions: Interest rate decisions & forward guidance - bullish for CAD
Bank of Japan (BoJ) Stance: Keeps JPY weak; defensive policies support the pair
Crude Oil Prices: 80% correlation - oil strength = CAD strength
US/Canada Economic Data: Employment, GDP, inflation prints (CPI)
Risk Sentiment: Periods of risk-on favor higher-yielding CAD over safe-haven JPY
⏰ OPTIMAL TRADING WINDOWS
Best Liquidity: 16:00-20:00 GMT (Overlap of Asian-American sessions)
Second Choice: 08:00-12:00 GMT (London-Asian overlap)
Avoid: 20:00-08:00 GMT (Low liquidity, wide spreads)
📋 PRE-TRADE CHECKLIST
Check BoC & BoJ calendar for upcoming events (48-72 hour window)
Verify USD/JPY direction - confirms broader yen momentum
Confirm AUD/JPY & NZD/JPY for carry sentiment
Check crude oil price action (impacts CAD bias)
Assess current RSI levels - avoid entries in extreme zones
Confirm entry limits are BELOW current price (limit orders only)
Position sizing = (Account Risk %) / (Entry to SL pips)
Set alerts on all layer entry points + alert on SL breach
⚡ IMPORTANT LEGAL & TRADING DISCLAIMERS
🔺 This analysis is educational and observational only - NOT financial advice
🔺 You assume 100% responsibility for all trading decisions
🔺 Past performance ≠ Future results
🔺 Forex trading carries substantial risk of loss
🔺 Never risk more than you can afford to lose
🔺 Adjust ALL levels (Entry, SL, TP) per YOUR risk tolerance
🔺 Consult a licensed financial advisor for personal guidance
Happy Trading & Manage Risk First! 📊✅

CAD/JPY at Key Weighted Support – Is the Next Wave Up?💹 CAD/JPY – Bullish Layer Trap Setup | Weighted Power Play! 💥
Asset: CAD/JPY (Canadian Dollar vs Japanese Yen)
Market Type: Forex Market Profit Pathway Setup (Swing / Day Trade)
🎯 Plan: The Bullish Thief’s Weighted Move
The bullish plan is confirmed after a Weighted Moving Average (WMA) pullback — a classic thief-style momentum catch! 😎
We’re stalking the zone where price respects the WMA curve and bounces higher, hinting a continuation to the upside.
💡 Why Weighted MA?
Because it gives sharper precision and reacts faster to price volatility, giving us the edge in timing our entries before the crowd jumps in.
💰 Entry Zone (Layer Strategy Style)
The Thief Strategy uses a layered limit order entry method — stacking multiple buys to average a prime position during pullbacks:
Buy Limit Layers: 108.000 | 108.200 | 108.400 | 108.600
(You can adjust or add more layers based on your risk appetite)
🛡️ Stop-Loss: @ 107.700 (Thief SL Zone)
📈 Target Zone: @ 110.200 – 110.500
🧠 Trade Logic & Insight
🔹 Why Bullish?
The recent momentum shows buyers defending key structural lows near 108.000.
Weighted MA crossover supports bullish momentum continuation, backed by strong CAD fundamentals and stable oil prices (CAD often correlates positively with crude).
🌐 Correlated Pairs to Watch
💵 USD/JPY: Similar JPY-side weakness can confirm CAD/JPY upside.
💰 CAD/CHF: Often mirrors CAD strength in risk-on sentiment.
🛢️ XTI/USD (WTI Crude Oil): Rising oil prices can fuel CAD gains, providing extra confirmation for bullish CAD/JPY bias.
⚠️ Notes from the Thief OG’s Desk
Dear Ladies & Gentlemen (Thief OGs) — this setup is my personal style of entry planning.
Not a recommendation. You’re the driver — your profit, your risk, your rulebook! 📜
Police barricade near 110.500 is a trap zone — act smart, escape with profits before the correction hits.
Always manage risk wisely and use your judgment — that’s the real thief’s code! 🕶️
✨ If you find value in my analysis, a 👍 and 🚀 boost is much appreciated — it helps me share more setups with the community!
⚖️ Disclaimer
This is a Thief-style trading strategy shared just for fun and educational purposes.
Not financial advice — trade responsibly and always do your own analysis.
🔖 #CADJPY #Forex #SwingTrade #DayTrade #ThiefStrategy #TechnicalAnalysis #FX #WMA #WeightedMovingAverage #CAD #JPY #ForexSetup #RiskManagement #TradingCommunity #TrendTrader

Analysis : CADJPY Bullish Wave Complete EUR & GBP rangeboundQuick follow-up to yesterday's multi-wave analysis, focusing on short-term price action developments across CADJPY, EURUSD, and GBPUSD.
📊 CADJPY - Bullish Wave Structure Complete ✅
The intraday bullish wave structure has now completed. Price action is setting up for high formation.
What We're Watching:
Expecting a valid pullback to confirm the high
Once pullback structure forms, we'll look for continuation or reversal signals
This is textbook wave completion behaviour
Key Point: Let price show us the pullback structure before making decisions. Don't anticipate—react.
📊 EURUSD - Range-Bound
Currently consolidating in range as anticipated. The expected downside move has not yet materialized.
Status: Waiting for range break to confirm continuation of bearish structure from yesterday's analysis.
📊 GBPUSD - Range-Bound Upside Broken
Similar to EURUSD, price is in consolidation range. Downside move expected but not yet confirmed.
Status: Patience required. Let structure break before entering positions.
Analysis Summary:
✅ CADJPY wave complete—watching for pullback
⏳ EURUSD & GBPUSD in range—waiting for breakout
📌 USDJPY not covered in this update
Trading Principle: This is why we follow price behaviour mechanically. Predictions mean nothing—structure and confirmation mean everything.
👍 Boost if you find these daily updates helpful
👤 Follow for continued multi-wave analysis updates

CADJPY Forming Falling WedgeCADJPY is currently forming a falling wedge pattern, which is often seen as a bullish reversal setup after a corrective decline. On the chart, price has pulled back from recent highs and is now compressing within descending support and resistance lines, showing decreasing volatility and seller exhaustion. This type of price action generally signals that buyers may soon step back in, especially if the pair breaks out above the wedge resistance with strong momentum. As a professional trader, I am monitoring the pattern for a potential upside continuation if the breakout confirms with volume and candle body expansion.
Fundamentally, CADJPY remains influenced by diverging central bank sentiment. The Bank of Canada continues to maintain a controlled policy stance as inflation remains stable within the expected range, while the Bank of Japan still operates with ultra-loose monetary policy. This interest rate differential keeps CADJPY attractive to carry traders and supports long-term bullish structure. If energy prices stay firm and Canada benefits from positive global risk sentiment, CADJPY could continue gaining strength after the wedge breakout.
However, short-term corrective movement is still visible as the market responds to profit taking and global risk fluctuations. If the wedge fails to break upward, price may retest lower support levels for liquidity before a new bullish trend leg begins. I remain focused on price reaction near structure, as break-and-retest confirmation will be key for high probability long positions.
On TradingView, falling wedge and CADJPY forecast are currently highly searched topics, reflecting strong interest in potential trend continuation setups across the Forex market. With a clean pattern, strong fundamentals, and supportive long-term structure, CADJPY holds the potential for profitable bullish opportunities once confirmation appears.
CADJPY: Ending Diagonal + RD(_) = Downtrend StartingToday, I’d like to share a Short positioning opportunity on the CADJPY pair .
In the current scenario, CADJPY is moving within a Resistance zone(112.100 JPY-109.500 JPY) and is close to a Potential Reversal Zone(PRZ) as well as the upper line of the ascending channel.
From an Elliott Wave perspective, it seems that CADJPY is completing the microwave 5 of the microwave C of the main wave Y , and the microwave 5 appears to be forming an Ending Diagonal .
Additionally, we can observe a negative Regular Divergence (RD-) between the peaks.
Fundamental analysis : Considering the above analysis, and also taking into account the fundamental conditions, Canada’s core inflation came in softer than expected, reinforcing the BoC’s easing path, while JPY benefits from the current risk-off tone. Fundamentally, CADJPY remains biased to the downside.
Finally, based on all the above, I expect that CADJPY will begin its downward trend, with a First target at 109.103 JPY
Take Profit(2): 108.543 JPY
Stop Loss(SL): 118.820 JPY(Worst)
Please respect each other's ideas and express them politely if you agree or disagree.
Canadian Dollar/ Japanese Yen Analysis (CADJPY), 4-hour time frame.
Be sure to follow the updated ideas.
Do not forget to put a Stop loss for your positions (For every position you want to open).
Please follow your strategy and updates; this is just my Idea, and I will gladly see your ideas in this post.
Please do not forget the ✅' like '✅ button 🙏😊 & Share it with your friends; thanks, and Trade safe.

CADJPY: Trade Plan Pullback Setup Targeting External Range HighsTaking a closer look at CAD/JPY, the pair continues to hold a bullish trend structure, with higher-timeframe price action breaking to the upside 📈. When we look left on both the daily and weekly charts, we can clearly see two external liquidity targets — the external range highs, which remain the logical draw on price 🎯.
At this stage, I’m anticipating a retracement on the 30-minute timeframe. If price pulls back into discount and we then see a bullish market structure break, I’ll be looking for a long setup from that point 🚀.
Stop-loss placement is discussed in detail in the video.
Not financial advice. ⚠️

CADJPY Will Go Down!
HI,Traders !
#CADJPY made a bearish
Breakout of the rising support
And is now consolidating
Below the line so we are
Bearish biased and we will
Be expecting a further
Bearish continuation !
Comment and subscribe to help us grow !

CADJPY Sell Opportunity (Retracement)Price will sell off and test the 50.0-61.8 Fib level before bullish trend continuation.
The retracement and test of the 50.0 fib level will create a HL.

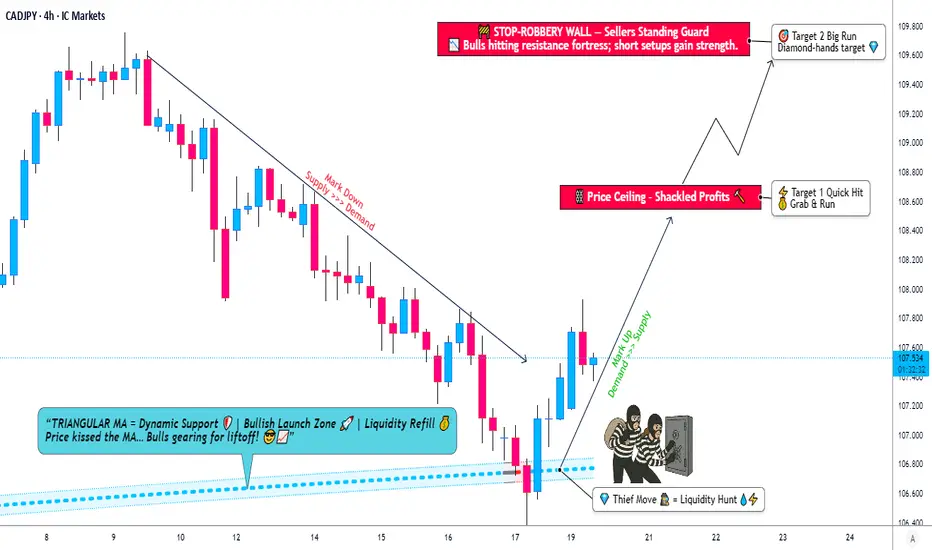
CAD/JPY Profit Plan – How to Layer Entries Professionally!🎯 CADJPY: The Maple Syrup Robbery Setup 🍁💴 | Multi-Layer Entry Zone Active!
📊 Market Overview
Asset: CAD/JPY (Canadian Dollar vs Japanese Yen)
Trade Type: Swing/Day Trade Hybrid
Strategy: "The Thief Method" - Multi-Layer Limit Order Accumulation
Bias: 🐂 BULLISH
🔍 Technical Analysis
The CADJPY pair is showing bullish confirmation following a textbook triangular moving average pullback and successful retest. The price structure suggests accumulation before the next leg up, making this an optimal zone for strategic layered entries.
Key Technical Confluences:
✅ Triangular MA pullback completed
✅ Support zone retest confirmed
✅ Higher lows forming on the daily timeframe
✅ Bullish momentum building above key support
💰 The Thief's Playbook: Multi-Layer Entry Strategy
Instead of a single entry point, this setup utilizes multiple limit orders (layering strategy) to build positions at favorable levels while managing risk.
🎯 Entry Layers (Limit Orders):
Layer 1: 106.800
Layer 2: 107.000
Layer 3: 107.250
Layer 4: 107.500
Layer 5: 107.750
Note: You can add more layers or adjust based on your account size and risk appetite. The beauty of this method is flexibility—enter at ANY price level within this range.
🛡️ Risk Management:
Stop Loss: 106.500
⚠️ Disclaimer: This is the Thief's suggested SL. However, YOU are the captain of your own ship! Set your stop loss based on YOUR risk tolerance. Trade at your own risk and never risk more than you can afford to lose.
🎯 Profit Targets:
Primary Target (TP1): 108.600 (+100 to +180 pips depending on entry)
Secondary Target (TP2): 109.600 (+190 to +280 pips depending on entry)
💡 Pro Tip: Consider scaling out at TP1 (take 50-70% profit) and letting the rest ride to TP2 with a trailing stop.
⚠️ Reminder: These are suggested targets. Lock in profits when YOU feel comfortable. It's YOUR money—make money, take money! 💸
🔗 Correlated Pairs to Watch
Keep an eye on these related pairs for confluence and broader market context:
OANDA:USDCAD 🇺🇸🇨🇦 - Inverse correlation (CAD strength indicator)
FX:USDJPY 🇺🇸🇯🇵 - Direct correlation (Yen weakness/strength gauge)
OANDA:AUDJPY 🇦🇺🇯🇵 - Similar risk-on/risk-off dynamic
OANDA:EURJPY 🇪🇺🇯🇵 - Cross-yen pair sentiment
BLACKBULL:WTI Crude Oil 🛢️ ( NYMEX:CL1! ) - Strong positive correlation with CAD (Canada = oil exporter)
Gold ( OANDA:XAUUSD ) - Safe-haven correlation with JPY (inverse to CADJPY)
Key Point: If crude oil rallies and USD/JPY shows strength, it confirms the bullish CADJPY thesis. Watch for risk sentiment—risk-on = JPY weakness = CADJPY strength! 🚀
📈 Trade Summary
ParameterValueEntry Zone106.800 - 107.750 (Multi-layer)Stop Loss106.500TP1108.600TP2109.600Risk/RewardApproximately 1:2 to 1:4+
🎬 Final Words from The Thief
Dear Ladies & Gentlemen (Thief OG's) 🎩✨,
This setup is about patience, precision, and proper position sizing. Layer in, manage risk, and let the market come to you. Remember: professional thieves don't rush—they plan, they execute, and they disappear with the bag! 💼💨
Stay sharp, stay strategic, and happy hunting! 🎯
✨ If you find value in my analysis, a 👍 and 🚀 boost is much appreciated — it helps me share more setups with the community!
#CADJPY #Forex #ForexTrading #TechnicalAnalysis #SwingTrading #DayTrading #CAD #JPY #MultiLayerEntry #TheThiefMethod #ForexSignals #TradingStrategy #RiskManagement #PriceAction #ForexSetup #CurrencyTrading #ForexCommunity #TradingView #ForexAnalysis #BullishSetup
#CADJPY +2300 Pips Swing Buy With Three Major Targets| Possible?The CADJPY has nicely formed a swing bullish pattern that is confirmed. One strong entry zone lies between these prices, 109 and 106, which remain a critical level. As described in the chart, there are three targets to focus on. We strongly recommend thoroughly examining the charts and reading them carefully, as this description is brief due to the detailed chart.
Here’s what to look for:
- Look for a continued or repeated pattern to better understand the next possible move.
- Look for volume when it emerges; enter with the trend momentum.
- Don’t forget to like and comment on the chart!
Team Setupsfx_

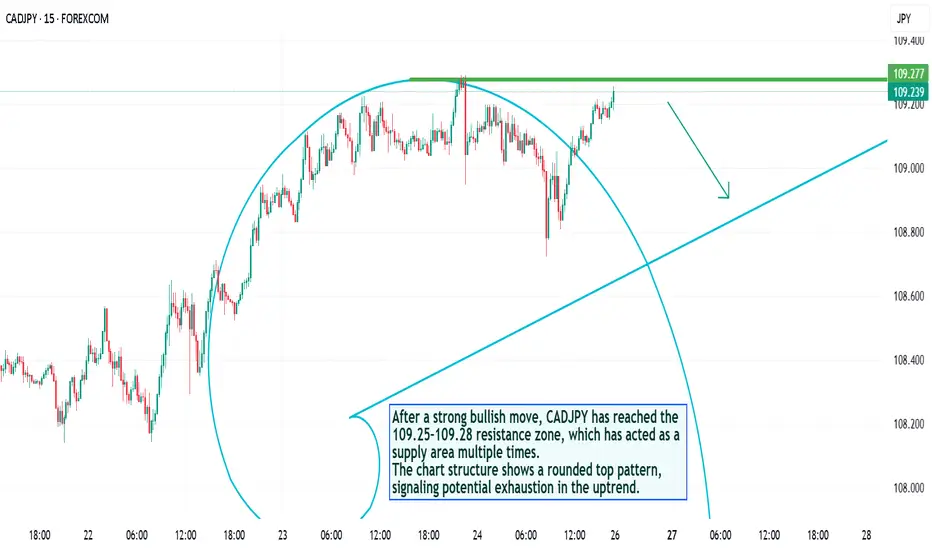
CADJPY – Rounded Top Reversal Forming at Key ResistanceAfter a strong bullish move, CADJPY has reached the 109.25–109.28 resistance zone, which has acted as a supply area multiple times.
The chart structure shows a rounded top pattern, signaling potential exhaustion in the uptrend.
💡 Technical View:
Price repeatedly rejected from 109.27 zone.
Rounded top indicates weakening buying momentum.
A descending curve formation suggests upcoming bearish correction.
Rising trendline below (around 108.80–108.60) could be the next target zone.
📉 Trade Setup (Signal):
Entry (Sell): below 109.20
Stop Loss: 109.35
Take Profit 1: 108.90
Take Profit 2: 108.60
🧭 Bias: Short-term bearish
💬 Expecting price to turn down after testing resistance. If the pair breaks above 109.35 with volume, bearish view becomes invalid.
CAD/JPY: Bearish Breakdown to 101.92?FX:CADJPY is displaying strong bearish signals on the daily chart , with price adhering to a downward trendline established since July 11th, forming successive lower highs that underscore persistent downward momentum . The highlighted " Compress Pattern " at the lower end suggests a period of consolidation and price compression, often preceding a volatile breakout to the downside as sellers build pressure against key supports.
Entry zone between 108.86-109.75 for a short position. First target at 101.75 (risk-reward >1:2.5) , second at 101.92 (risk-reward >1:5.5) near major support zones. Set a stop loss on a close above 110.05 to guard against an upside reversal. Seek confirmation through a decisive break below the entry with elevated volume. 🌟
Fundamentally , this week we have Canada's inflation rate report, which significantly impacts CAD—recent data shows September YoY inflation at 1.9% and core at 2.6%, potentially influencing BoC policy. Additionally, Japan's trade balance report this week could introduce volatility to JPY, with the Merchandise Trade Balance Total scheduled for October 22st. 💡
📝 Trade Plan:
✅ Entry Zone: 108.86 – 109.75 (short entry near resistance/trendline)
❌ Stop Loss: Close above 110.05
🎯 Targets:
TP1: 107.75 (R:R > 1:2.5)
TP2: 101.92 (R:R > 1:5.5)
What's your perspective on this setup? Share in the comments! 👇

CADJPY Forming Bullish MomentumCADJPY on the 4H timeframe is showing a clear transition from bullish momentum into a corrective bearish phase. After an extended rally, price formed a lower high and broke structure to the downside, confirming short-term selling pressure. The current retracement appears corrective, and as long as price remains below recent lower-high levels, I’ll be watching for the next impulsive leg toward 105.00 and potentially deeper.
From a fundamental perspective, the yen is gaining strength as risk sentiment cools ahead of key central bank events and rising geopolitical uncertainty supports safe-haven flows. Meanwhile, the Canadian dollar is facing headwinds due to softening oil prices and growing expectations that the Bank of Canada may lean toward easing in upcoming meetings if economic slowdown persists. This divergence between a potentially weaker CAD and a recovering JPY adds confluence to the bearish technical setup.
I anticipate price to retest the previous broken structure zone before continuing downward. Any rejection from that supply area will act as confirmation for continuation targets toward mid-105s. I’ll be patient and let price action align with fundamentals for a clean entry with maximum reward-to-risk potential.
