FireHoseReel | Engulfing Candlestick Pattern (Crypto Version)🔥 Welcome FireHoseReel !
Let’s dive into the Engulfing Candlestick Pattern.
✔️ Bearish Engulfing – Basics
The Bearish Engulfing is a two-candlestick reversal pattern.
The first candle is bullish, and the second is a larger bearish candle that fully engulfs the first candle’s body and closes below its low.
Since crypto rarely has gaps, the key condition is that the second body completely covers the first body.
Shadows are not significant.
This pattern is most reliable after a weakening uptrend.
🎯 Bearish Engulfing – Psychology
This pattern shows a strong bearish shift.
Buyers push price upward at first, but the second candle proves sellers have taken full control, dragging price down and even breaking the previous candle’s low.
It signals momentum shifting from bulls to bears.
🧮 Bearish Engulfing – Setup & Levels
• Trigger: Break below the low of the second candle.
• Confirmation: A close below the trigger.
• Stoploss: Above the high of the second candle or whole structure.
• Buy-stop entry: Only if the main trend remains strongly bullish (rare in crypto).
✔️ Bullish Engulfing – Basics
The Bullish Engulfing is a two-candlestick reversal.
The first candle is bearish, and the second is a larger bullish candle that fully engulfs the first body and closes above its high.
In crypto, the key factor is that the second bullish body fully covers the first bearish body.
It works best after a downtrend or capitulation phase.
🎯 Bullish Engulfing – Psychology
This pattern indicates a strong bullish reversal.
Sellers control the first candle, but buyers return aggressively on the second candle, overpowering them and closing above the previous high.
It signals momentum shifting from bears to bulls.
🧮 Bullish Engulfing – Setup & Levels
• Trigger: Break above the high of the second candle.
• Confirmation: A close above the trigger.
• Stoploss: Below the low of the second candle or structure.
• Sell-stop entry: Only in strong downtrends and rarely recommended.
🛞 Risk Management & Disclaimer
Please remember to always use proper risk management and position sizing. Nothing in this analysis is financial advice. The market can change quickly, so always trade based on your own strategy, research, and risk tolerance. You are fully responsible for your own trades.
Candle

XAUUSD Long: Path to $3715 After Successful RetestHello, traders! The price auction for XAUUSD has been developing within a well-defined upward wedge for some time. This bullish structure has guided the price higher through a series of higher highs and higher lows, with the demand zone 2 at 3575 acting as a key pivot point low for the formation, establishing the underlying uptrend.
Currently, the auction has reached a critical stage after a strong impulse resulted in a breakout above the key horizontal demand level at 3665. This move shows strong bullish initiative, but such breakouts are often followed by a retest to confirm their validity before the next major leg up.
My scenario for the development of events is based on this breakout being successful. I expect the price to make a corrective pullback to retest the broken 3665 demand level from above. In my opinion, if this former resistance holds as new support, it will be a strong confirmation of the bullish trend. This should trigger a continuation of the rally towards the upper resistance line of the wedge. The take-profit is therefore set at 3715, just below this upper boundary. Manage your risk.

EURUSD Long: Correction Before Impulse UpHello, traders! A large upward wedge pattern has defined the price auction for EURUSD. This bullish structure has been formed by a series of higher highs and higher lows, with key pivot points establishing the diverging supply and demand lines. The auction has been rotating between the demand zone 2 and the supply zone near the 1.1780 level.
Currently, following a rejection from the wedge's upper supply line, the price has entered a corrective phase. This pullback is guiding the auction towards a significant confluence of support. The price is now approaching the ascending demand line, a key area where buyers have previously shown initiative and are expected to defend the trend.
The primary scenario anticipates a successful defense of this ascending demand line. A confirmed bounce from this dynamic support would validate the integrity of the upward wedge and signal that the bullish initiative is ready to resume. This is expected to trigger a full rotation back to the top of the pattern, breaking through the 1.1780 demand level. The take-profit is therefore set at 1.1810, targeting the upper supply line of the wedge. Manage your risk!

Gold will correct to support area and then continue to growHello traders, I want share with you my opinion about Gold. The market context for Gold has been firmly bullish, with the price action being guided by a well-established upward channel that has defined the trend for a significant period. The structure of this channel has been confirmed by multiple rotations between its support and resistance lines, originating from the deep 3370 - 3390 buyer zone. Currently, after a rejection from the channel's highs, the price of XAU is undergoing a healthy corrective phase. This pull-back has brought the asset into a critical confluence of support, defined by the 3635 - 3615 support zone and the ascending support line of the channel itself. The primary working hypothesis is a long, trend-continuation scenario, which anticipates that buyers will step in to defend this key support cluster. A confirmed bounce from this area would signal the conclusion of the corrective move and the resumption of the dominant upward trend. This would likely initiate the next impulsive wave higher within the channel's structure. Therefore, the TP is logically placed at 3740 points, representing a new potential structural high and a measured objective for the next impulsive wave. Please share this idea with your friends and click Boost 🚀

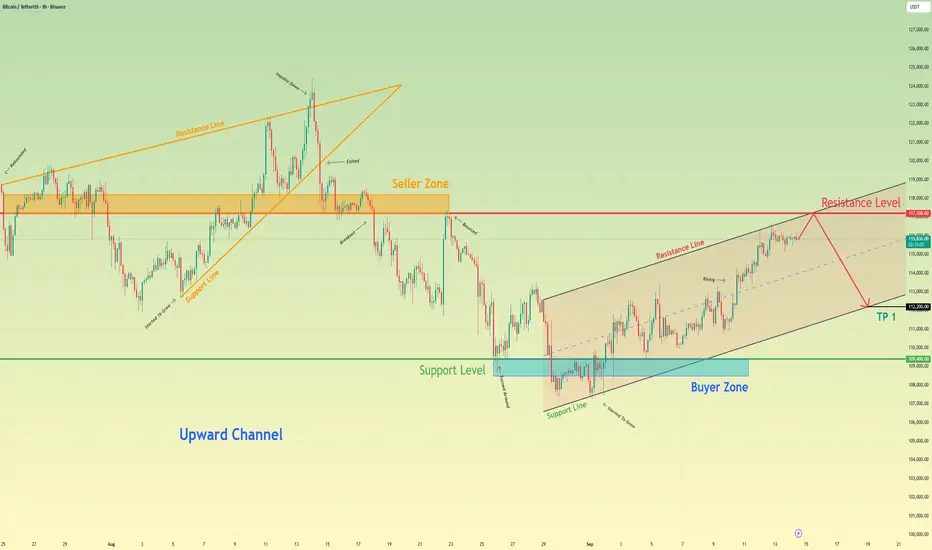
Bitcoin will start to correction after touching resistance levelHello traders, I want share with you my opinion about Bitcoin. The established market structure for Bitcoin remains bullish, with the price action being methodically guided higher within a well-defined upward channel. This pattern has been in effect since the resolution of a prior upward wedge, creating a clear sequence of higher highs and higher lows between its support and resistance lines. The price of BTC has just completed another full rotation from the channel's support and has now arrived at a critical inflection point. Currently, the asset is directly testing the upper boundary of the channel, a level which forms a powerful confluence of resistance with the horizontal 118200 - 117200 seller zone. The primary working hypothesis is a short, corrective scenario, based on the high probability that the channel's resistance will be respected. A confirmed rejection from this area would signal that the current upward impulse is exhausted and a downward rotation towards the channel's support is underway. Therefore, the TP for this rotational play is logically placed at 112200 points. This target aligns perfectly with the ascending support line of the channel, representing the most probable objective for a corrective move of this nature. Please share this idea with your friends and click Boost 🚀
XAUUSD - Entry plan 2 is on a run.1 SL, Second entry is on a run. Went up to take a liquidity above.

XAUUSD - Looking for short on this Monday.There is a clear double bottom liquidity around previous 4H low. Next 4H candle might create wick touching 15m IMB, then go to bottom liquidity. Just simple price action and candle analyze. Might take previous day high to go down too. Plan, wait, enter.

EURUSD Long: Bullish Rally Will Continue, After RetestHello, traders! The prior market structure for EURUSD was defined by a descending channel, which concluded with a pivot point low in the 1.1600 demand area. A strong bullish initiative from that low triggered a breakout, reversing the downtrend and establishing the current bullish market phase. This has led the price auction into a new upward trajectory.
Currently, the price action is being guided by a well-defined ascending wedge. After testing the upper boundary, the price has made a corrective move down and is now at a critical inflection point. The auction is directly testing the confluence of the ascending demand line and the horizontal 1.1700 - 1.1710 demand area, a key zone for buyers to demonstrate control.
The primary scenario anticipates a successful defense of this support confluence. A confirmed bounce from the demand line would validate the integrity of the ascending wedge and signal that the bullish initiative is ready to resume. This would likely trigger a full rotation to the upside within the pattern. The take-profit is therefore set at 1.1750, targeting the upper supply line of the wedge. Manage your risk!

XAUUSD Short: Correction from Current HighsHello, traders! The prior price auction for XAUUSD was contained within a horizontal range, bounded by the Demand zone 2 near 3335. A key pivot point low initiated a strong bullish impulse, resulting in a breakout from this range and establishing the current bullish market structure, which transitioned the market into a new directional phase.
Currently, the price action is being guided by a well-defined ascending channel. The most recent impulse wave has carried XAU to the upper boundary of this channel, which represents dynamic resistance. The auction is now testing this ceiling after a strong rally, a key area where sellers may re-emerge to challenge the bullish initiative.
My scenario anticipates a corrective move from the current highs. The expectation is that the channel's resistance line will hold, leading to a rejection and a downward rotation back towards the channel's support. A failure to break higher would confirm that a short-term correction is likely. The take-profit is therefore set at 3410 points, targeting the confluence of the ascending channel's support line and the 3405 - 3415 demand area. Manage your risk!

XAUUSD: Price Rebound from Support line to $3440Hello everyone, here is my breakdown of the current Gold setup.
Market Analysis
From a broader perspective, we've seen a clear shift in control on the chart. The market successfully reversed a prior downtrend by breaking out of a Downward Channel. This breakout was significant and has established the current bullish market structure, which has been guiding the price higher.
This new bullish phase has formed a well-defined Upward Wedge. The price has been respecting its boundaries, making higher highs and higher lows. Currently, the price is undergoing a corrective pullback and is testing the ascending support line of this wedge, which aligns with the Support zone around the 3390 level.
My Scenario & Strategy
My scenario is built on the expectation that this upward wedge structure will remain intact. The current pullback to the support line presents a classic opportunity within an established uptrend.
I'm anticipating a clear bounce from the current support zone. This should initiate a rally back towards the wedge's resistance line. The key part of this scenario is that I expect the buying pressure to be strong enough to force a breakout above that resistance, signaling an acceleration of the trend. The primary target for this breakout scenario is 3440 points.
That's the setup I'm tracking. Thank you for your attention, and always manage your risk.

XAUUSD Short: Reversal Expected from the Supply ZoneHello, traders! The price auction for XAUUSD has been consolidating for an extended period within a large symmetrical triangle. This pattern was defined by key pivot points, establishing the upper supply line and the lower demand line. This phase of balance saw volatility contract significantly as the market approached the apex of the formation, building energy for a decisive move.
Currently, this state of equilibrium has been resolved with a bullish breakout. XAUUSD has pushed above the descending supply line and has completed a retest, confirming the line as new support. This bullish price action is now driving the auction upwards, directly towards the major horizontal supply zone, which begins at the 3400 level.
The primary scenario anticipates that this breakout is a final exhaustive move into a major resistance area. The rally is expected to fail upon entering the 3400 - 3410 supply zone. A confirmed rejection here would suggest a 'bull trap' has occurred, likely initiating a sharp reversal. The take-profit for this scenario is therefore set at 3340 points, targeting the recent breakout area. Manage your risk!

SOLANA $250 INCOMING? or $150 again?We can see a wedge is forming, price is at a major point, break above with a failed break below the resistance - we see high potential for $250.
Failed breakthroughs and a rejection? We see $150 once more.
Thoughts?


GOLD HIGHT PROBABILITY SETUP!!According to Candle Range Theory (CRT), GOLD price swept the previous week high (CRT LOW), and this daily candle (today's candle (22/11/2024)) must close below the previous week high (CRT HIGH). If this daily candlestick closes below, the whole week next week (25/11/2024) gold will be selling (bearish). The target will be Previous week low (CRT LOW).
Another thing, on weekly timeframe you will see gold has touched the bearish fair value gap (FVG) which was our internal range liquidity (IRL) but on Daily timeframe we still have to touch the bearish FVG with a rejection, then we can sell.
“I just wait until there is money lying in the corner, and all I have to do is go over there and pick it up. I do nothing in the meantime.” - Jim Rogers

DXY analysis based on ICT concepts and candle scienceHello, greatest community Since this is my first post, I sincerely hope you find it useful.
I am going to start with a top-down analysis.
First, based on the monthly chart.
Currently, we are in the monthly SIBI, a reversal area.
What are we supposed to look for next?
A drop in momentum to the annual bisi target during the following months
Weekly Chart
It's Friday, the last day of the week. What can I see in this area right now?
1. It looks like we are about to create a weekly fair value gap, which we will trade from the following week in order to reach the next weekly SIBI shown on the chart.
2. On the other hand, we might make a BAG and search for the entry on the daily chart.
NB: I will post more information this weekend if I find someone who is interested.

(TRX) tronThis has to be the biggest candle I've ever seen Tron produce. I've never seen the price go higher than the 0.15 cents barrier. Looks like this year might be different. I don't own any tron anymore.

High probable GBPUSD Trade for NFP [02/August/2024]We are expecting Bullish Move for FX:GBPUSD
Best NFP Trade for FX:GBPUSD
Today is : 02/August/2024

A Practical Guide For Candlestick Patterns!Intraday trading is a method of investing in cryptocurrencies where the trader buys and sells cryptocurrencies on the same day without any open positions left by the end of the day. Intraday traders aim to either purchase a cryptocurrency at a low price and sell it at a higher price or short-sell a cryptocurrency at a high price and buy it at a lower price within the same day. This requires a good understanding of the market and relevant information to help them make the right decisions. In the cryptocurrency market, the price of a cryptocurrency is determined by its demand and supply, among other factors.
Tools such as candlestick chart patterns are very helpful to traders. We will discuss these candlestick charts and offer steps to help you read them.

In mid big candle(APT)📊Analysis by AhmadArz:
🔍Entry: 8.186
🛑Stop Loss: 8.080
🎯Take Profit: 8.311 -8.418 -8.610 -8.742
🔗"Uncover new opportunities in the world of cryptocurrencies with AhmadArz.
💡Join us on TradingView and expand your investment knowledge with our five years of experience in financial markets."
🚀Please boost and💬 comment to share your thoughts with us!

GOLD |BULL OR BEAR?Hello guys, gold could not continue the upward trend of last week and now I see that it has started a downward trend again.
I have identified the important supply and demand areas on the chart to enter trading positions.
Enter into the positions according to the time priorities and after getting confirmation.
Don't rush, if the market doesn't go as you think, stop trading at all, the market is always full of opportunities.

Swing Trading - Concept of Accumulation and Distribution Following stocks have been discussed in the video
1. HG Infra
2. NFL
3. SPIC
Accumulation - Is always found on downside and any breakout may give 8-14% returns in short trade
Distribution - Is always found on top from where the price may reverse to downside
This video is made only for educational purpose. Do your own study before taking any trades.

Bitcoin Weekly Green CandlesOver the last 2373 Days, bitcoin has experienced volatility between $1830 and $69,000.
During this period, bitcoin closed with a green candle 4 times for 7 consecutive weeks.
This week, it will repeats the record by closing green candle for the 5th time in 7 consecutive weeks.
In the cycle I mentioned, the green candle could not close for 8 weeks.
After the 7th week, it entered the accumulation process between 2 and 12 weeks.
During this period, there were decreases of up to 25%. Afterwards, bitcoin came back stronger.
I wonder so much. Will we see the 8th green candle next week?
When I saw this I wanted to share it.

