XAUUSD📊 XAUUSD — Institutional Price Action Commentary
(Educational Analysis | Intraday Structure Context)
Welcome to my TradingView profile.
All content shared here is strictly for educational and informational purposes only. This analysis documents market behavior through the lens of price structure, liquidity delivery, and institutional order-flow concepts. Nothing presented should be interpreted as financial advice or a trade recommendation.
🔍 Market Structure Observation
Gold has recently delivered a strong impulsive expansion, indicating decisive participation and aggressive repricing. Such moves are rarely random; they often occur after liquidity has been efficiently engineered and absorbed at lower levels.
Following the expansion, price transitioned into a controlled pullback, suggesting a pause in momentum rather than immediate structural failure.
🧠 Demand Zone Context
The highlighted demand zone represents the origin of the impulsive leg — an area where imbalance previously entered the market with conviction. From an institutional perspective, this zone acts as a reference point, not a signal.
If price revisits this area, the quality of the reaction (acceptance, rejection, or absorption) will provide valuable insight into whether buy-side strength remains present or whether distribution is underway.
⚖️ Probabilistic Framework
Markets operate on probabilities, not predictions.
At current levels:
Continuation remains possible if demand is respected
Deeper retracement remains valid if imbalance seeks fuller mitigation
Consolidation may occur as liquidity redistributes
All scenarios remain open until price confirms or invalidates them.
📌 Purpose of This Channel
This channel is built around:
Structure over indicators
Liquidity over emotion
Process over outcome
Education over hype
There will be no signals, no guarantees, and no performance claims.
Only clean charts, disciplined reasoning, and transparent execution logic.
If you appreciate objective analysis, institutional market logic, and a rule-based approach, you’re welcome to follow and engage.
Let price tell the story.
Candlestick Analysis

DSL, 1D (Bullish divergence on RSI and Volumes)DSL, 1D
Bullish divergence on RSI and Volumes
TPs: 8.8, 9.6
SL: closing below 7
Arsalan Anwer
Stags

US 500 – Are You Already Planning for Early 2026?Despite the initial concern of traders surrounding the impact of President Trump’s decision to apply tariffs to all goods imported into the US, on the economy, inflation and ultimately corporate profits, it’s still been an impressive year for the US 500 index. Since hitting its yearly low of 4799 on April 7th, when tariff uncertainty was at its peak, the US 500 index is up around 44% at time of writing (0630 GMT - 6905).
In the short term, where the index finishes the year may now be dictated by the reaction to the release later today of the Federal Reserve minutes from their meeting earlier in December (1900 GMT), as well as any by any quarter/year end rebalancing flows of investor portfolios that may still need to be done.
Looking forward to the start of 2026, traders may be asking themselves whether the first move for the US 500 index could be lower, if, for example, the Federal Reserve were to pause rate cuts in Q1 to assess incoming employment and inflation data, or as those more bullish traders hope, the index continues its assault on the psychological 7000 level, possibly supported by a resilient economy, a consumer that is still spending and buoyant corporate revenue.
Much could also still depend on the appetite of investors to stick with the AI trade in the hope that the revenue generation starts to justify the massive capital expenditure in this area.
With all this in mind, the end of this week could be a good time for reflection on where the US 500 index currently stands and to start preparation for any potential volatility and directional moves when they eventually arrive. Afterall, with the next US Non-farm payrolls due for release on Friday January 9th, traders potentially won’t have to wait very long.
Technical Update: All-Time High Resistance Holding?
A key feature of the US 500 index over the Christmas period was the closing break above 6924/6925, the resistance defined by the October 30th and December 11th highs. On the surface, this could be a constructive development and may even encourage further attempts at price strength. The question now is whether this price strength can extend beyond the New Year period, or if the upside price momentum may begin to fade.
Within this backdrop, it remains prudent to monitor key support and resistance levels closely in the coming week. This could help determine whether the latest price action reflects a resumption of upside momentum capable of leading to new highs, or if the break above the October/December resistance proves to be a false move, signalling slowing momentum and the potential for another price correction.
Potential Resistance Levels:
The US 500 index has experienced a setback after posting a new all‑time high of 6944 on December 26th and this level now becomes the first resistance focus into the New Year period. Closing breaks above 6944 may be needed to signal scope for further attempts at upside.
If confirmed, closing breaks above 6944 may signal a resumption of price strength and could open the way for moves toward 7004, which is the 38.2% Fibonacci extension. Breaks above this level on a closing basis could provide scope for further gains toward 7053, which is the 61.8% extension.
Potential Support Levels:
After the recent period of strength, prices currently sit above the 6857 level, which is the 38.2% retracement of the December 18th to 26th advance. A pullback toward this level could keep the broader backdrop constructive, although closing breaks below 6857 could signal scope for moves to lower levels.
As the chart above highlights, closing breaks below 6857 might expose the risk for a move toward 6803, which is the 61.8% retracement, and if that level were to also give way, it could lead to further price weakness toward 6716, which is the December 18th low.
The material provided here has not been prepared accordance with legal requirements designed to promote the independence of investment research and as such is considered to be a marketing communication. Whilst it is not subject to any prohibition on dealing ahead of the dissemination of investment research, we will not seek to take any advantage before providing it to our clients.
Pepperstone doesn’t represent that the material provided here is accurate, current or complete, and therefore shouldn’t be relied upon as such. The information, whether from a third party or not, isn’t to be considered as a recommendation; or an offer to buy or sell; or the solicitation of an offer to buy or sell any security, financial product or instrument; or to participate in any particular trading strategy. It does not take into account readers’ financial situation or investment objectives. We advise any readers of this content to seek their own advice. Without the approval of Pepperstone, reproduction or redistribution of this information isn’t permitted.

USDCHF - Bias BearishUSDCHF is carrying a bearish bias for today based on higher-timeframe daily price action.
The previous daily candle showed clear signs of selling pressure at premium levels, confirming that sellers are in control. This aligns with a bearish daily narrative, suggesting that price is more likely to seek lower levels rather than continue higher.
As long as price remains below yesterday’s key highs, the expectation is for bearish continuation, with any intraday retracements viewed as potential sell opportunities in line with the daily bias.
Looking the fact that the weekly profile is inline with the daily, adds extra level of conviction.
So during active trading session, we wait for Internal Range Liquidity to be mitigated (such case the 1h FVG as seen in the video), and then can confidently apply the ICT 2022 Module.
📌 Bias only. Execution is refined on lower timeframes.

FireHoseReel | BNB Daily Analysis #29🔥 Welcome To FireHoseReel !
Let’s dive into Binance Coin (BNB) analysis.
👀 BNB 4H Overview
BNB is currently trading inside a 4H range box and is consolidating near the lower part of the range. A newly formed resistance at $870 has been tested three times, but price has failed to break above it so far.
📊 Volume Analysis
BNB volume has been declining within the range. However, each time price approaches the key resistance, volume increases slightly before getting rejected, confirming the strength of this level.
✍️ BNB Trading Scenarios
🟢 Long Scenario:
A confirmed breakout above $870.39, accompanied by rising buy volume, could provide a solid long trading opportunity.
🔴 Short Scenario:
A breakdown below the range low will not be easy. It would require a strong and clear 4H or daily whale candle. After a new structure forms, short triggers may appear.
🧠 Protect your capital first. No setup is worth blowing your account. If risk isn’t controlled, profit means nothing. Trade with rules, not emotions.

EURUSDIn this analysis, price action is evaluated through an institutional market structure lens, focusing on orderflow, displacement, and supply-demand interaction rather than prediction.
On the lower timeframe, EURUSD displayed a clear break in structure (BOS) to the downside, indicating a short-term shift in market intent. This structural failure was followed by strong bearish displacement, suggesting the presence of active sell-side participation rather than random volatility.
Price has since reacted from a well-defined supply zone, aligned with the prior distribution area where inefficiencies were left behind. Such zones are not treated as “sell signals,” but rather as areas of interest where liquidity, risk, and reaction can be objectively observed.
The key focus here is not direction, but process:
•How price delivers away from structure
•How inefficiencies are created and respected
•How institutions manage risk around premium zones
•This framework emphasizes patience, discipline, and execution over emotion, allowing traders to align with market mechanics instead of chasing outcomes.
⚠️ Disclaimer (TradingView-compliant)
This analysis is for educational and informational purposes only.
It does not constitute financial advice, investment recommendations, or trade signals.
All trading involves risk, and each participant is responsible for their own decisions.
🧠 Final Note
This channel is built for traders who value clarity over hype, structure over noise, and consistency over impulse.
If you’re focused on understanding why price moves — not just where — you’re in the right place.
📈 APEX TRADING FX
Patience | Discipline | Fearless

XAUUSD This setup was text book 📕 ,as seen on the chart price under 4,515 .Sellers took control of the market driving price all the way to 4,448. That was the same reaction I was looking for when price came under 4,515, I waited for sellers to take control ,what I saw for me to know that sellers were ready to take control
1.Equal highs at 4,548
2. Lower high under 4,515 area
3. 15m rejection candles showing exhaustion in buying pressure

SIlver is going to skyrocketSilver is going to skyrocket, but i have a feeling looking for volumes that the before that next touch point is 56.10 Eur
www.tradingview.com
What your feeling about that ?

Correction vs. Reversal: How Will the Market Choose?#XAUUSD OANDA:XAUUSD FOREXCOM:XAUUSD
Good morning. Last Friday, I warned of the possibility of a market pullback after a surge, and the market has now successfully delivered on our prediction. If you have paid close attention to my analysis and have not blindly followed the trend, then congratulations on successfully avoiding market risks
Gold prices have now fallen below the daily MA5 and may see further pullback. The next key level to watch is the short-term support around 4430, which is last week's low. A small long position could be considered on the first touch of this level, with a key support level around 4400 (the daily MA10). If this level holds, gold prices are likely to rebound
Therefore, our goal is clear, if the market continues to fall and retraces to around 4430-4420, we will take a small long position. If the decline continues to the daily MA10, we will consider adding to our position around 4410-4400.
In short, we will only trade at key price levels, we will not consider trading in other areas

Gold – New Record Highs or Profit Taking to End Year?It took Gold 2 months to surpass its previous record high set on October 20th but the topside move since it broke above 4381 on December 22nd has been impressive.
Last week Gold rallied over $200 from opening levels on Monday at 4338 to post a new record high of 4550 on Friday before settling back slightly lower to close at 4532.
The question to consider moving through the final 3 days of 2025 is whether prices can continue to push to higher levels or if profit taking on what has been a year-to-date gain of around 70% may be too tempting to resist. Certainly, if the early moves this morning are anything to go by it could be a volatile 72 hours for traders to navigate!
From a macro point of view the backdrop could remain supportive with on-going geo-political tensions between the US-Venezuela, Ukraine and Russia and issues with Islamic State in Nigeria unlikely to be resolved in the short term.
However, Gold prices could also be impacted by any portfolio rebalancing that may need to be completed ahead of and during the final trading day of the year on Wednesday, including any significant moves in the US dollar in which precious metals are priced.
Looking forward to early 2026, assessing the technical outlook could be prudent to establish potentially relevant support and resistance levels that may influence where Gold prices could trade.
Gold Technical Update: Gauging the Potential for Acceleration or Correction
So far, December has been a strong month for Gold, with prices rising 8.9% from its December 2nd lows of 4163 up to an all‑time high of 4550 posted on Friday.
After such a sharp advance the new year could prove to be an important period for this popular shiny metal. Against this backdrop, traders may be attempting to identify valid price levels that could help them ascertain if the current price acceleration can continue, or if selling pressure may materialise to see an unwinding of what are possibly over-extended upside price conditions.
Potential Resistance Levels:
When a CFD keeps posting new all‑time highs, as Gold has recently, it can become difficult to identify valid resistance levels or areas where sellers may re‑emerge once more. In these types of situations, Fibonacci extension levels can be useful.
Using the October 20th to 28th price correction, the latest price strength has brought the Gold price close to a potential resistance at 4572, which is the 38.2% extension of the October decline. Traders could find it helpful to watch how this level is defended on a closing basis, as while not a guarantee of further gains, a closing break above 4572 could open scope for further upside toward 4689, which is the 61.8% extension and potentially even 4882, the 100% extension level.
Potential Support Levels:
While the 4572 level remains intact and still caps the upside for Gold, there is potential for this level to help reverse the current price advance.
If future price weakness does emerge, the 4448 low registered on December 24th could be viewed as the first possible support to watch on a closing basis.
Closes below 4448 may trigger further downside toward 4399, which is the 38.2% retracement of the December advance. If that level were also to give way, price weakness could then extend toward 4309, which is the 61.8% retracement.
The material provided here has not been prepared accordance with legal requirements designed to promote the independence of investment research and as such is considered to be a marketing communication. Whilst it is not subject to any prohibition on dealing ahead of the dissemination of investment research, we will not seek to take any advantage before providing it to our clients.
Pepperstone doesn’t represent that the material provided here is accurate, current or complete, and therefore shouldn’t be relied upon as such. The information, whether from a third party or not, isn’t to be considered as a recommendation; or an offer to buy or sell; or the solicitation of an offer to buy or sell any security, financial product or instrument; or to participate in any particular trading strategy. It does not take into account readers’ financial situation or investment objectives. We advise any readers of this content to seek their own advice. Without the approval of Pepperstone, reproduction or redistribution of this information isn’t permitted.

Ethereum $ETH weekly demand level at $2,879 is holdingEthereum CRYPTOCAP:ETH weekly demand level at $2,879 is holding as expected for now. There are signs of new bullish impulses in the smaller timeframes. Let's see if ETH cryptocurrency wants to rally higher from this demand level.

Bitcoin monthly demand level at $84,349 is holdingBitcoin monthly demand level at $84,349 is holding. There are signs of new bullish impulses in the smaller timeframes. Let's see if BitCoin cryptocurrency wants to rally higher from this demand level.

How to read candlestick: Part 2 (BEARISH REVERSAL PATTERNS)Identifying the top of a trend is one of the hardest skills in trading. While no one can catch the exact top every time, Bearish Reversal Patterns are the market’s way of signaling that the buyers are exhausted and the sellers (bears) are seizing control.
These patterns usually appear after a sustained uptrend or at a key resistance level.
1. The Shooting Star
The Shooting Star is one of the most reliable single-candle signals. It looks like an inverted hammer but appears at the top of an uptrend.
● Structure:
1. Small Body: The body (open and close) is small and located at the bottom of the
candle's range.
2. Long Upper Wick: The upper wick (shadow) is at least 2-3 times longer than the
body.
3. No Lower Wick: Ideally, there is little to no lower wick.
● Psychology: Buyers pushed the price up significantly during the session, but sellers fought back aggressively, forcing the price to close near where it opened. The rejection of higher prices is clear.
2. Bearish Engulfing
This is a powerful two-candle pattern that signifies a major shift in momentum. It "engulfs" the previous buying pressure.
● Structure:
1. Candle 1 (Bullish): A green candle continuing the current uptrend.
2. Candle 2 (Bearish): A large red candle that opens above the previous close and
closes below the previous open. Its body completely overlaps (engulfs) the body
of the first candle.
● Psychology: The bulls tried to push up, but the bears came in with overwhelming
volume, completely wiping out the gains of the previous session and driving the price lower.
3. The Evening Star
The Evening Star is a three-candle formation that is often seen as more reliable than single-candle patterns because it unfolds over three sessions.
● Structure:
1. The Trend Candle: A large bullish candle.
2. The Star: A small-bodied candle (can be green or red) that gaps up slightly. It
represents indecision.
3. The Reversal Candle: A large bearish candle that closes well into the body of
the first bullish candle.
● Psychology: The first candle shows buyers are in control. The second candle shows
they are losing momentum (indecision). The third candle confirms that sellers have taken over and the reversal is active.
4. Dark Cloud Cover
This pattern is similar to the Bearish Engulfing but slightly less aggressive. It typically occurs at resistance levels.
● Structure:
Candle 1: A strong bullish candle.
Candle 2: A bearish candle that opens above the high of the previous candle (a
gap up) but then closes below the midpoint (50% level) of the first candle's body.
● Psychology: The market gaps up on optimism, but the rally fails. Sellers push the price
down deep into the previous day's gains, signaling a "dark cloud" over the trend.
5. Hanging Man
Interestingly, this looks exactly like a bullish Hammer, but the context is different.
● Structure: A small body at the top of the range with a long lower wick. It appears at the top of an uptrend.
● Psychology: Even though the price recovered to close near the high, the long lower wick shows that sellers were able to push the price down significantly during the session. This "sell-off" indicates that support is weakening and the trend is fragile.
TRADING TIP: CONFIRMATION IS KEY
Seeing a bearish pattern does not mean you should instantly short the market.
1. Location: These patterns are most effective at Key Resistance levels or Supply Zones.
2. Confirmation: Wait for the next candle to close lower than the pattern to confirm the
reversal.
3. RSI/Indicators: Check if your indicators (like RSI) are showing "Overbought" conditions or bearish divergence to support your trade idea.

BTCUSDThis BTCUSD chart highlights a higher-timeframe supply zone, defined by a strong bearish displacement and multiple prior rejections, indicating the presence of active sell-side interest at these levels. The zone aligns with a previous distribution area, where price failed to sustain acceptance above value before expanding lower.
From a market structure perspective, price remains below the supply zone, suggesting that bullish attempts are currently corrective rather than impulsive. The most recent upside move appears to be a retracement into premium, rather than a trend reversal, which keeps the broader bearish narrative intact unless the zone is decisively reclaimed.
Confluences supporting the zone:
Previous high-volume rejection from the same price region, suggesting institutional participation
Unmitigated supply left behind after an impulsive downside move
Premium pricing relative to the recent range, favoring sell-side risk/reward
Range high alignment with prior failed breakout attempts
HTF structure bias remains intact unless acceptance occurs above the zone
The highlighted paths illustrate possible reaction scenarios, not predictions. Execution should always be based on lower-timeframe confirmation, such as rejection wicks, displacement, or a shift in internal structure.
This analysis is shared strictly for educational and technical insight, emphasizing structure, liquidity, and supply–demand mechanics rather than directional certainty. Risk management and personal trade criteria should always take priority.

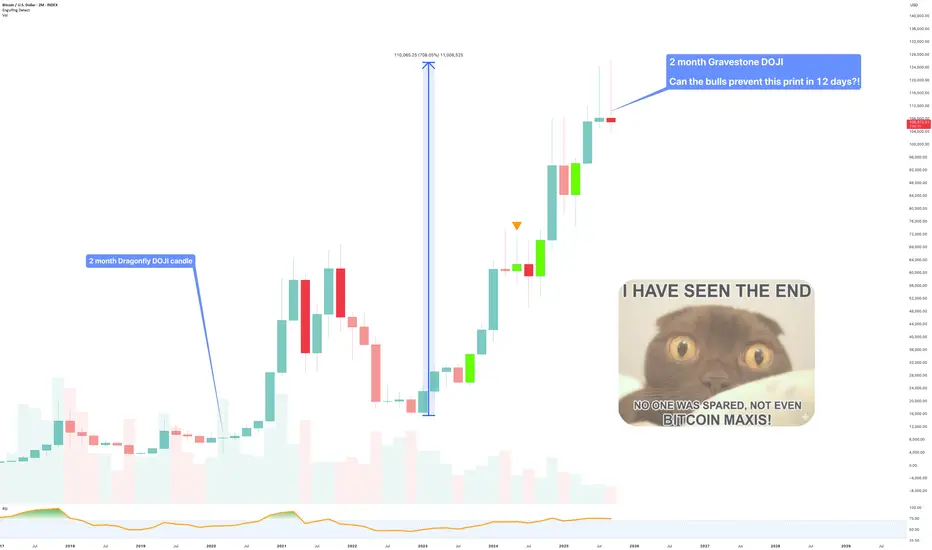
They’re building the perfect trap, and you’re cheering for It.This idea is not active on publication. Are we clear? Great, read on..
The Story
Markets have an uncanny ability to fool the largest number of participants at the most critical moments. Bitcoin is once again setting that stage.
While the crowd celebrates new highs and “the strongest bull market ever,” the structure is quietly repeating the same pattern that preceded every major cycle top.
At the same time influencers across social media continue to gaslight audiences on the promises of “Alt season” in quarter 4, even though the cycle top is ridiculously close the charts are signalling something is not quite right.
Do the following charts suggest green months ahead?
Each bull market, 2013, 2017, 2021 produced a sequence of consecutive green six-month candles before exhaustion:
* 2012 – 2013 → 5 green six-month candles
* 2015 – 2017 → 6 candles
* 2020 – 2021 → 4 candles
* 2023 – 2025 → now at 5 candles
Six month candle count in each bull market
It’s not the count that matters, it’s the context. Every cycle ends in euphoria, and euphoria is exactly what a 6-month Gravestone DOJI represents: a candle of rejection formed at the height of optimism.
On shorter timeframes, that same behaviour repeats. The 1 month and 3 month charts both print hammers, powerful reversal setups when they appear at cycle extremes, not continuation zones.
1 month hammer
3 month hammer
6 month Gravestone DOJI
What’s Next
The combination of the 1-month hammer, 3-month hammer, and 6-month Gravestone DOJI forms what can only be described as a trap structure, a technical pattern that invites late buyers before liquidity vanishes.
Historically, when Bitcoin posts a Gravestone DOJI on the higher timeframe following four to six green candles, it signals a pause or the beginning of distribution.
The takeaway is simple:
Momentum is slowing
Structure is repeating
Sentiment is euphoric
If the 6-month candle confirms red in early 2026, the trap will have sprung and history will have rhymed again.
Conclusions
This isn’t the end of Bitcoin, but it may be the end of this particular cycle.
A Gravestone DOJI doesn’t kill a trend on its own, but at the tail of a multi-year rally, it’s the market whispering “take profit while you still can.”
They’ve built the perfect trap, the market makers, and the majority are cheering it on.
Until confirmation proves otherwise, caution is not bearish, it’s survival.
Ww
========================================
Disclaimer
This post is for educational purposes only and reflects personal opinion, not financial advice.
I hold no position in Bitcoin and have no vested interest in the outcome of this analysis.
Cryptocurrency markets are volatile and unpredictable; always conduct your own research, manage your risk carefully, and base decisions on your own strategy and timeframe.
Patience and confirmation always outlast emotion.
EURCAD SHORTMarket structure bearish on HTFs 3
Entry at both Weekly and Daily AOi DW
Weekly Rejection at AOi
Daily Rejection at AOi
Daily EMA retest
Previous Structure point Weekly
Round Psych Level 1.62000
H4 Candlestick rejection
TP: WHO KNOWS!
Entry 100%
REMEMBER : Trading is a Game Of Probability
: Manage Your Risk
: Be Patient
: Every Moment Is Unique
: Rinse, Wash, Repeat!
: Christ is King.

USDJPY LONGMarket structure bullish on HTFs 3
Entry At Daily AOi
Weekly Rejection at AOi
Daily Rejection at AOi
Previous Structure point Daily
Around Psychological Level 156.000
H4 Candlestick rejection
Rejection from Previous structure
TP: WHO KNOWS!
Entry 95%
REMEMBER : Trading is a Game Of Probability
: Manage Your Risk
: Be Patient
: Every Moment Is Unique
: Rinse, Wash, Repeat!
: Christ is King.

CADCHF LONGMarket structure long on HTFs DW
Entry at Both Weekly and Daily AOi
Weekly Rejection at AOi
Previous Weekly Structure Point
Daily Rejection At AOi
Daily EMA retest
Previous Daily Structure Point
Around Psychological Level 0.57500
H4 Candlestick rejection
TP: WHO KNOWS!
Entry 100%
REMEMBER : Trading is a Game Of Probability
: Manage Your Risk
: Be Patient
: Every Moment Is Unique
: Rinse, Wash, Repeat!
: Christ is King.

FireHoseReel | Optimism Near Key Breakout Level as Volume Builds🔥 Welcome To FireHoseReel !
Let’s dive into Optimism (OP) analysis.
⛳️ OP Fundamental Overview
Optimism (OP) helps people use Ethereum faster and cheaper by reducing fees and speeding up transactions for DeFi, NFTs, and apps. Ranked around top 80 on CoinMarketCap, it’s a strong mid-cap Layer-2.
👀 OP 4H Overview
Optimism (OP) is trading inside a 4H range box and is currently positioned near the end of its bearish trend. A breakout above the descending curve trendline, followed by a break of the overhead resistances, could initiate a bullish 4H trend for OP.
📊 Volume Analysis
As price approached the curve trendline and the dynamic resistance at $0.2825, volume increased noticeably. This suggests that a breakout of this zone could lead to a fast and impulsive price move.
✍️ OP Trading Scenarios
🟢 Long Scenario:
A confirmed breakout above $0.2825 with increasing buy volume could allow price to break the top of the range and move toward the $0.3439 resistance.
🔴 Short Scenario:
A breakdown below $0.2518 could trigger a fast move toward a lower support level. Strong selling volume confirmation would be required.
🧠 Protect your capital first. No setup is worth blowing your account. If risk isn’t controlled, profit means nothing. Trade with rules, not emotions.

FireHoseReel | BNB Daily Analysis #28🔥 Welcome To FireHoseReel !
Let’s dive into Binance Coin (BNB) analysis.
👀 BNB 1H Overview
BNB bounced strongly from the vicinity of its maker-buyer zone with a very long upper wick, which clearly highlights a key demand/support area. Price is currently trading below the multi-timeframe resistance at $843.11, which also acts as a pre-breakout zone.
📊 Volume Analysis
Honestly, there’s not much meaningful insight to extract from BNB volume right now. The volume structure is extremely messy and unreliable, making proper analysis difficult. For that reason, I’m choosing not to rely on volume until it normalizes or the underlying cause becomes clear.
✍️ BNB Trading Scenarios
🟢 Long Scenario:
A confirmed breakout above $843.11, accompanied by increasing buy volume, could trigger a high-risk long setup.
🔴 Short Scenario:
If the maker zone breaks with a strong whale candle and heavy selling pressure, followed by continuation and a pullback, we can look for entry opportunities using proper setup candles. If price starts moving in that direction, I’ll update the analysis accordingly.
🧠 Protect your capital first. No setup is worth blowing your account. If risk isn’t controlled, profit means nothing. Trade with rules, not emotions.

Long trade Pair RENDERUSDT
Buyside trade 2
Wed 27th Dec 25
6.00 am
Tokyo Session PM
Entry 1.276
Profit level 1.353 (6.03%)
Stop level 1.274 (0.15%)
RR 38.5
🧭 Market Context
We assume the market is operating within a rotational higher-timeframe environment, characterised by repeated liquidity runs and mean-reversion back toward value rather than sustained trend continuation for RENDERUSDT. Volatility compression and overlapping price action before the setup suggested institutional accumulation, not directional commitment. A Fixed Range Volume Profile applied across the range identified True Fair Value, represented by the smallest and most balanced volume node within the target array. This level acted as the equilibrium point where both buyers and sellers showed the highest agreement.
💧 Liquidity & Auction Narrative
Price action preceding the trade demonstrated an AMD sequence:
Accumulation: Prolonged consolidation around fair value with muted volume and balanced order flow (0.618 Fib level)
Manipulation: A deliberate expansion away from value, targeting resting liquidity at prior highs/lows and Fibonacci extensions 1. (1323) & (1.272), accompanied by large volume bubbles (forced participation)
Failed Auction: Lack of acceptance beyond value and rapid reversion back into the profile
This behaviour indicated liquidity engineering rather than genuine directional intent.
📦 Value & Fair Price Assessment
Acceptance back above/below True Fair Value (as defined by the fixed profile) was the key institutional signal. This confirmed that the prior expansion was a failed auction, and that price was being re-priced from value toward opposing liquidity. The trade was therefore framed as a value-to-liquidity rotation, not a breakout or trend-following buyside entry.

Nifty Analysis EOD – December 26, 2025 – Friday🟢 Nifty Analysis EOD – December 26, 2025 – Friday 🔴
Bears Breach 26,100: Psychological 26K Tested as Support Levels Crumble.
🗞 Nifty Summary
The Nifty started with a weak footing, opening below the PDL. Although it initially found support near 26,104 and attempted to fill the gap, a sharp rejection at the PDC pushed prices back down through the CDO, CDL, and the 26,104 level.
After a brief range-bound period near 26,070 where a symmetrical triangle formed, the subsequent breakdown dragged the index into the previous gap zone near 26,030. Following 45 minutes of high uncertainty and tight consolidation, a final leg down marked the day’s low at 26,008.60.
A late Bull Flag pattern facilitated a 50-point recovery, allowing the Nifty to close at 26,047.65, down -99.80 points (-0.38%). As predicted in our previous notes, the breakdown below 26,120 successfully triggered tests of 26,104 and 26,070.
🛡 5 Min Intraday Chart with Levels
🛡 Intraday Walk
The day was a masterclass in bearish control, with sellers swiftly grabbing 100 points of ground from the bulls.
The failure to sustain the initial gap-fill and the sharp rejection at the PDC set a negative tone that persisted for most of the session.
The symmetrical triangle breakdown and the subsequent uncertainty near 26,050 highlighted the lack of buyer conviction until the very end of the day.
The late recovery is a small silver lining, but the structural damage below 26,100 is evident.
📉 Daily Time Frame Chart with Intraday Levels
🕯 Daily Candle Breakdown
Open: 26,121.25
High: 26,144.20
Low: 26,008.60
Close: 26,042.30
Change: −99.80 (−0.38%)
🏗️ Structure Breakdown
Type: Bearish candle.
Range (High–Low): ≈ 136 points — moderate volatility.
Body: ≈ 79 points — reflecting clear selling pressure and bearish dominance.
Upper Wick: ≈ 23 points — weak buying attempt near the open quickly rejected.
Lower Wick: ≈ 34 points — buying interest emerged near the psychological 26,000 level.
📚 Interpretation
The market opened near 26,121 but failed to find any follow-through buying. Sellers maintained control throughout the session, pushing the price to the brink of the 26K mark. While the partial recovery from the lows shows that buyers are defending the psychological round number, the close remains significantly below the open. This structure reflects sustained short-term bearish pressure within the broader consolidation zone.
🕯 Candle Type
Bearish Candle with Lower-Wick Support Attempt — Signals selling dominance; buyers are active near lower levels but require a strong follow-up session to confirm a bottom.
🛡 5 Min Intraday Chart
⚔️ Gladiator Strategy Update
ATR: 173.50
IB Range: 72.65 → Medium
Market Structure: ImBalanced
Trade Highlights:
09:32 Short Trade: Target Hit (1:1.15) (PDL Breakout)
11:07 Short Trade: Target Hit (1:1.85) (Range Breakout)
13:45 Long Trade: SL Hit (Contra Trend)
Trade Summary: The strategy capitalized on the clear bearish intent early on, hitting targets on both the PDL breakdown and the mid-morning range breakout. However, the late-afternoon attempt to catch the contra-trend recovery resulted in a stop-loss hit as the market remained volatile near the lows.
🧱 Support & Resistance Levels
Resistance Zones:
26070
26104 (Major Polarity Resistance)
26155
Support Zones:
26030
26000 (Psychological)
25985 ~ 25965 (Critical Defensive Zone)
🧠 Final Thoughts
“The 26,000 psychological zone is the next battleground.”
The upcoming session will be tricky.
While 26K acts as a psychological cushion, the structural momentum is currently with the bears. We must wait for the opening tick and the formation of the Initial Balance (IB).
I am expecting a potential test of 25,985; if we see recovery signs there, a relief rally could be in the cards.
However, any failure to reclaim 26,104 will keep the pressure firmly on the downside.
✏️ Disclaimer
This is just my personal viewpoint. Always consult your financial advisor before taking any action.

Short trade
📘 ZORAUSDT continues to trade in a rotational environment, with liquidity cycling between premium and discount. Precision execution at PD arrays is favoured over directional bias until a higher-timeframe break of structure occurs.
🧭 Higher-Timeframe Context
The market remains structurally corrective, not trending.
Price is oscillating between well-defined premium and discount zones, repeatedly respecting FVGs and session highs/lows. No sustained HTF BOS → rotational environment dominates.
Primary read: This is a dealer-style market, rewarding precision entries rather than directional conviction.
💧 Liquidity & Behavioural Narrative
Multiple sell-side executions at a premium have played out successfully, indicating:
Buy-side liquidity is being engineered above short-term highs.
Smart money is selling into strength. Downside moves consistently pause and react at discount/demand zones, confirming: Responsive buyers, not trend continuation sellers.
🧠 Interpretation: Liquidity is being cycled, not accumulated for a trend. Each leg is being used to rebalance the range.
🟦 TAB 15 — What Price Is Targeting
Primary draw:
Open Price Zone
Secondary draw:
Prior internal equal lows
