All candlestick patterns for Trading : Bearish reversal patternsHello everyone 😃
In this article we present Most useful bearish reversal patterns of candlesticks and How to trade with them. ( Sorry for my irregular chart 🤦♂️ I'm not good in drawing 😁 )
📊 What is Candlestick charts ?
Candlestick charts are a type of financial chart for tracking the movement of securities. They have their origins in the centuries-old Japanese rice trade and have made their way into modern day price charting. Some investors find them more visually appealing than the standard bar charts and the price actions easier to interpret.
Candlesticks are so named because the rectangular shape and lines on either end resemble a candle with wicks. Each candlestick usually represents one day’s worth of price data about a stock. Over time, the candlesticks group into recognizable patterns that investors can use to make buying and selling decisions.
📍 Bearish reversal candlestick patterns : Bearish reversal candlestick patterns can form with one or more candlesticks; most require bearish confirmation. The actual reversal indicates that selling pressure overwhelmed buying pressure for one or more days, but it remains unclear whether or not sustained selling or lack of buyers will continue to push prices lower. Without confirmation, many of these patterns would be considered neutral and merely indicate a potential resistance level at best. Bearish confirmation means further downside follow through, such as a gap down, long black candlestick or high volume decline. Because candlestick patterns are short-term and usually effective for 1-2 weeks, bearish confirmation should come within 1-3 days.
To be considered a bearish reversal , there should be an existing uptrend to reverse. It does not have to be a major uptrend, but should be up for the short term or at least over the last few days. A dark cloud cover after a sharp decline or near new lows is unlikely to be a valid bearish reversal pattern. Bearish reversal patterns within a downtrend would simply confirm existing selling pressure and could be considered continuation patterns.
There are many methods available to determine the trend. An uptrend can be established using moving averages, peak/trough analysis or trend lines. A security could be deemed in an uptrend based on one or more of the following :
- The security is trading above its 20-day exponential moving average (EMA).
- Each reaction peak and trough is higher than the previous.
- The security is trading above a trend line.
🈺 Now let's talk about patterns that we provided on chart.. !
- Hanging man : The hanging man is characterized by a small "body" on top of a long lower shadow. The shadow underneath should be at least twice the length of the body.
📚 The hanging man represents a potential reversal in an uptrend. While selling an asset solely based on a hanging man pattern is a risky proposition, many believe it's a key piece of evidence that market sentiment is beginning to turn. The strength in the uptrend is no longer there.
- Gravestone DOJI : A gravestone DOJI is a bearish reversal candlestick pattern that is formed when the open, low, and closing prices are all near each other with a long upper shadow.
📚 A gravestone DOJI is a bearish pattern that suggests a reversal followed by a downtrend in the price action.
📌 A gravestone pattern can be used as a sign to take profits on a bullish position or enter a bearish trade.
- Bearish kicker : This pattern is characterized by a sharp reversal in price over the span of two candlesticks.
📚 Traders use kicker patterns to determine which group of market participants is in control of the direction.
📌 The pattern points to a strong change in investors' attitudes towards a security that typically follows the release of valuable information about a company, industry, or economy.
- Shooting stars : A shooting star is a bearish candlestick with a long upper shadow, little or no lower shadow, and a small real body near the low of the day.
📚 A shooting star occurs after an advance and indicates the price could start falling.
The formation is bearish because the price tried to rise significantly during the day, but then the sellers took over and pushed the price back down toward the open.
- Bearish spinning top : A spinning top is a candlestick pattern that has a short real body that's vertically centered between long upper and lower shadows.
📚 The real body should be small, showing little difference between the open and close prices.
📌 Since buyers and sellers both pushed the price, but couldn't maintain it, the pattern shows indecision and that more sideways movement could follow.
- Bearish engulfing : A bearish engulfing pattern is a technical chart pattern that signals lower prices to come. The pattern consists of an up (white or green) candlestick followed by a large down (black or red) candlestick that eclipses or "engulfs" the smaller up candle.
📚 A bearish engulfing pattern can occur anywhere, but it is more significant if it occurs after a price advance. This could be an uptrend or a pullback to the upside with a larger downtrend.
🔴 The pattern can be important because it shows sellers have overtaken the buyers and are pushing the price more aggressively down (down candle) than the buyers were able to push it up (up candle).
- Bearish harami : A bearish harami is a two bar Japanese candlestick pattern that suggests prices may soon reverse to the downside. The pattern consists of a long white candle followed by a small black candle. The opening and closing prices of the second candle must be contained within the body of the first candle. An uptrend precedes the formation of a bearish harami.
📚 A bearish harami is a candlestick chart indicator for reversal in a bull price movement.
📌 Traders can use technical indicators, such as the relative strength index (RSI) and the stochastic oscillator with a bearish harami to increase the chance of a successful trade.
- Dark cloud cover : Both candles should be relatively large, showing strong participation by traders and investors. When the pattern occurs with small candles it is typically less significant.
📚 Dark Cloud Cover is a candlestick pattern that shows a shift in momentum to the downside following a price rise.
The pattern is composed of a bearish candle that opens above but then closes below the midpoint of the prior bullish candle.
📌 Traders typically see if the candle following the bearish candle also shows declining prices. A further price decline following the bearish candle is called confirmation.
- Evening star : An evening star is a stock-price chart pattern used by technical analysts to detect when a trend is about to reverse. It is a bearish candlestick pattern consisting of three candles: a large white candlestick, a small-bodied candle, and a red candle.
📚 Evening star patterns are associated with the top of a price uptrend, signifying that the uptrend is nearing its end.
- Evening DOJI star : The Evening DOJI Star is a bearish reversal pattern, being very similar to the Evening Star. The only difference is that the Evening Doji Star needs to have a doji candle (except the Four-Price Doji) on the second line. The DOJI candle (second line) should not be preceded by or followed by a price gap.
📚 The pattern, as every other candlestick pattern, should be confirmed on the next candles by breaking out of the support zone or a trendline. If the occurrence is confirmed, then its third line may act as a resistance area. It also happens, however, that the pattern is merely a short pause prior further price increases.
- Bearish abandoned baby : A bearish abandoned baby is a specialized candlestick pattern consisting of three candles, one with rising prices, a second with holding prices, and a third with falling prices. Technical analysts expect that this pattern signals at least a short-term reversal in a currently upward trending price.
📚 This is a rare pattern that has a fairly strong track record for forecasting a short-term downward trend.
The key item of the pattern is the middle day, which should have a gap in front of it and following it, and which should close the session with price unchanged.
- Three black crows : The black crow pattern consists of three consecutive long-bodied candlesticks that have opened within the real body of the previous candle and closed lower than the previous candle.
📚 Three black crows is a bearish candlestick pattern used to predict the reversal of a current uptrend.
Traders use it alongside other technical indicators such as the relative strength index (RSI).
- Tweezer top : A tweezers topping pattern occurs when the highs of two candlesticks occur at almost exactly the same level following an advance.
📚 Tweezers are more meaningful as part of other trends, especially pullbacks.
- Three inside down : The three inside down pattern is a bearish reversal pattern composed of a large up candle, a smaller down candle contained within the prior candle, and then another down candle that closes below the close of the second candle.
📚 The down version of the pattern is bearish. It shows the price move higher is ending and the price is starting to move lower. Here are the characteristics of the pattern.
- Three outside down : The three outside down describe a pair of three-candle reversal patterns that appear on candlestick charts. The pattern requires three candles to form in a specific sequence, showing that the current trend has lost momentum and might signal a reversal of an existing trend.
📚 The first candle marks the beginning of the end for the prevailing trend as the second candle engulfs the first candle. The third candle marks an acceleration of the reversal.
- Advance block : Advance block is the name given to a candlestick trading pattern. The pattern is a three-candle bearish setup that is considered to be a reversal pattern—a suggestion that price action is about to change from what had been an upward trend to a downward trend in relatively short time frames.
📚 An advance block is a three-period candlestick pattern considered to forecast a reversal.
The pattern's success at predicting reversal is barely above random.
- Bearish stick sandwich : One candlestick pattern is the stick sandwich because it resembles a sandwich when plotted on a price chart - they will have the middle candlestick oppositely colored vs. the candlesticks on either side of it, both of which will have a larger trading range than the middle candlestick.
📚 These patterns may indicate either bullish or bearish trends, and so should be used in conjunction with other methods or signals
- Matching high : The first line of the pattern appears as a long line whereas the second one can be either long or short. Both candle lines need to close at the same level. Additionally, the opening of the second candle need to be higher than the opening of the previous candle.
📚 The Matching High is built of two MARUBOZO candles having white bodies. In other words, it can be a White MARUBOZO or a Closing White MARUBOZO.
- Bearish breakaway : The bearish breakaway is a formation of five candlesticks where the first is always bullish and the last is always bearish. The middle candlesticks will be rising and can be either bearish or bullish, but will usually be bullish.
📚 A bearish breakaway is a chart formation that can appear in a rising market when the price starts to pull or break away gradually to the downside.
- Bearish Tri-Star : Tri-Star patterns form when three consecutive DOJI candlesticks appear at the end of a prolonged trend.
📚 A Tri-Star pattern near a significant support or resistance level increases the probability of a successful trade.
- MARUBOZO : The black MARUBOZO is simply a long black (down, or red on the charts below) candle, with little to no upper or lower shadows. The pattern shows that sellers controlled the trading day from open to close, and is therefore a bearish pattern.
📚 How to avoid false MARUBOZO signals and setting stop-loss :
If bearish, take a short when price falls below;
Place a stop above candlestick.
🔴 NOTES :
- There are many bearish reversal patterns that we only present most useful patterns for trading !
- Most of them have 2 definition and direction ( Bearish and Bullish ) and we only present bearish reversal patterns !
- For better result in your trading, You need to confirm patterns through trend lines , momentum, oscillators, or volume indicators.
⏰ Best timeframes to work with candlestick patterns :
Traders usually use Monthly, Weekly, Daily, 4-Hour, Hourly, 15-Minute and even 1-Minute timeframes.
Ideally, traders pick the main timeframe they are interested in and then choose a longer and a shorter timeframe to complement the main one .
The longer timeframes typically contain fewer and more reliable signals. The shorter timeframes usually contain more signals with less accuracy.
There are several types of traders, and they have different trading styles.
📍 We will provide more contents for candlestick patterns in next weeks !
So stay tuned and support us with your LIKES, COMMENTS and FOLLOWINGS...
Have a great moments.
@Helical_Trades
Candlestickpattern

MOST COMMON CANDLESTICK PATTERNSHello Traders and welcome to out channel. MOST COMMON CANDLESTICK PATTERNS IN ONE PLACE! If u like this educational content please support it with a like so we can keep posting more content like this. If you have any additional questions let us know in the comments and we will provide you with the answer! SharkFx wish you a wonderfull weekend and successful trading week ahead!

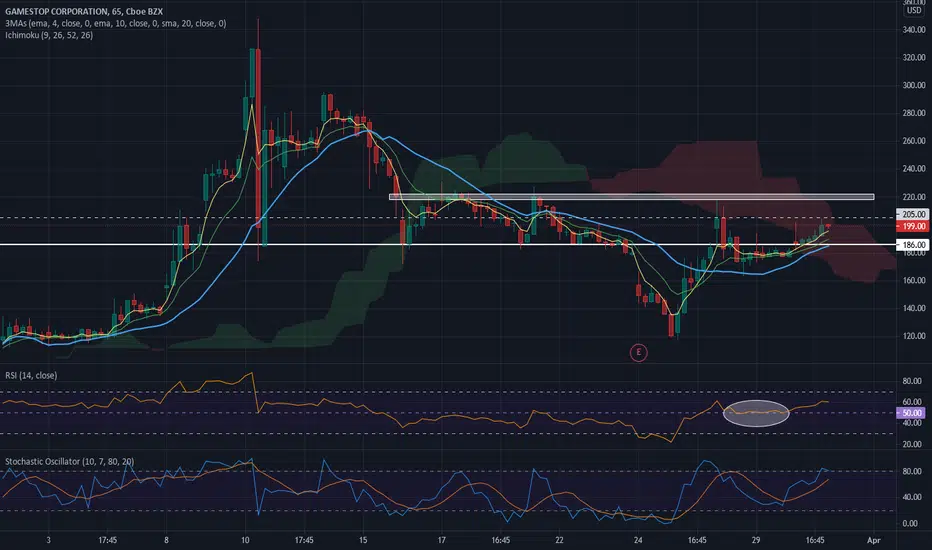
Example of RSI 50 test to signal a price moveShown on the 65m chart, RSI crossed over 50, came back to test it twice, and gradually moved higher. Normally this "double dip" test plus a trade above the signal candle results in a strong move higher. In this case GME could move to 218-220 (white bar) to complete an inverse head & shoulder pattern, but first price has to get over 205 (dashed line).
On the daily chart there is a long bullish engulfing candle off the 50sma, which corresponds to RSI dipping below 50 and crossing back over. The 26 March candle triggered long with a trade higher than the signal candle (25 March). Price action seems to be taking a pause after last week's move up from 120.
A close over 26th open, 197.68, creates a nice 3-candle pattern with price closing back over 20sma. Candle patterns add strength (or caution) to other indicators; I do not use them as stand alone indicators.
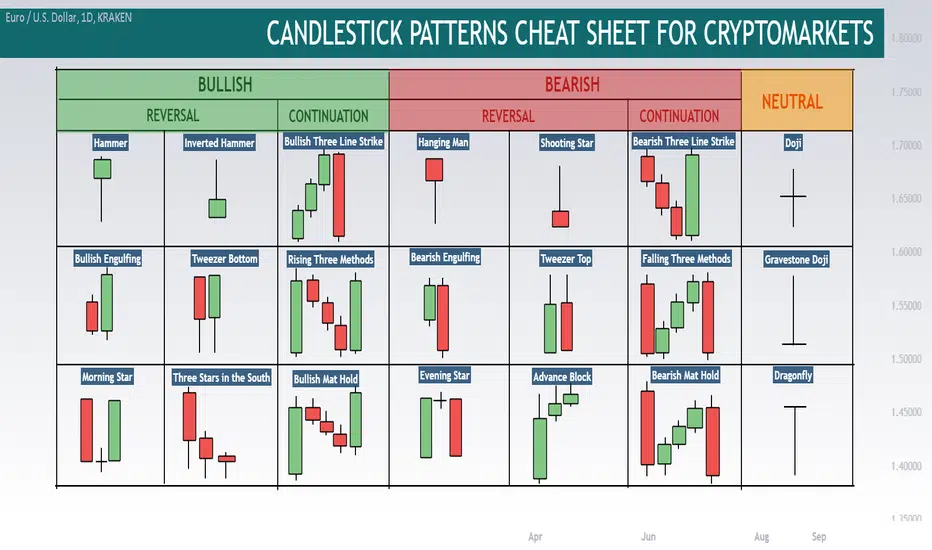
Ultimate Candlestick Cheat Sheet For CryptoHello, traders!
Here is the cheat sheet for the candlestick patterns. They are divided into five groups:
-Bullish Reversal
-Bullish Trend Continuation
-Bearish Reversal
-Bearish Trend Continuation
-Neutral
All these common formations you can see on the chart but first of all you should understand what has happened on the market. When you are looking at the candle a lot of useful information can be received.
For example if the candle have the long wick to the downside and short body (hammer), it means a huge bullish pressure and this is a reversal to the uptrend sign.
When you have three stars in the South formation it is can be noticed that the wicks to the downside are long and bodies became shorter. It means the weakness of the downtrend and also the sign of the potential reverse.
If the candle have a very small body (doji) this indicates that the market is in indefinite situation. Bulls and bears war did not lead to price changes and future price direction is unknown.
Do you use the candlestick patterns? Please write your comment and give us a support with like if you like such cheat sheets!
DISCLAMER: Information is provided only for educational purposes. Do your own study before taking any actions or decisions.
Sell at resistanceSave this!
Before placing an order it is advisable to wait for confirmation.
In the chart above we have an example of a sell that can be made on 1HR / 30m / 15m.
We are waiting for the price to form a resistance.
See if there is enough range 15-20 pips .
Place the order and as a target most recent support.

TOP 6 Candlestick PatternsHi,
I would like to share my TOP 6 candlestick patterns, you can also name your TOP 3 in the comment section.
Perfect scenario: identify the strong area, wait for the price coming inside of it, wait for a candlestick pattern which consists of at least two candles and it has to form in at least 1-hour timeframe (lower TF candlestick patterns are poor), wait for a pullback and GO.
Always wait for a small pullback after the candlestick pattern has formed, you will get a better price. It is so rear case that after candlestick pattern formation the price goes immediately into the shown direction.
MORNING STAR
The Morning Star is a bullish bottom reversal pattern. It warns of weakness in a downtrend that could potentially lead to a trend reversal, especially if it forms on a strong support level. The morning star consists of three candlesticks with the middle candlestick forming a star. The first candlestick in the morning star pattern must be a red candlestick with a relatively large real body. The second candlestick is the star, which has a short real body that is separated from the real body of the first candlestick. The star does not need to form below the low of the first candlestick and can exist within the lower shadow of that candlestick. The star is the first indication of weakness as it indicates that the sellers were not able to drive the price close much lower than the close of the previous period.
This weakness is confirmed by the third candlestick, which must be green in color and must close 50% above the body of the first candlestick.
EVENING STAR
The Evening Star is a bearish, top trend reversal pattern that warns of a potential reversal of an uptrend. It is the opposite of the Morning Star and, like the morning star, consists of three candlesticks, with the middle candlestick being a star. The first candlestick in the evening star must be green in color and must have a relatively large real body. The second candlestick is the star, which is a candlestick with a short real body that does not touch the real body of the preceding candlestick. The star can also form within the upper shadow of the first candlestick. The star is the first indication of weakness as it indicates that the buyers were unable to push the price up to close much higher than the close of the previous period. This weakness is confirmed by the candlestick that follows the star.
This candlestick must be a red candlestick and must close 50% above the body of the first candlestick.
BULLISH/BEARISH ENGULFING
The Engulfing candlestick pattern is a two-candle reversal pattern. A reversal pattern can be bearish or bullish, depending on whether it appears at the end of an uptrend (bearish engulfing) or a downtrend (bullish engulfing pattern). The first candle is a small body, followed by the second candle whose body completely engulfs the previous candle body and closes in the opposite direction of the trend.
BULLISH/BEARISH RAILWAY TRACKS
A bearish railway track pattern has the first candlestick bullish and the second candlestick bearish. That fact that there is a sudden change from bullish to bearish candlestick should be a good indication that there might be a bearish trend forming. If you see it inside of the determined strong area the more powerful it is!
Regards,
Vaido

Pro Candlestick Analysis Method! MUST KNOW FOR SUCCESS!!!Pro Backtest Method:
STUDY CANDLESTICK BEHAVIOUR
- You should know what type of
candle your ideal entries are taken
based on momentum/rejection.
- To help with in the moment decision
making before entry and avoiding
impulse entries try this;
1. Open Chart During your preferred
session and timeframe. Look to see if
market conditions are similar to your
strategies ideal conditions e.g. Creating
a LH and rejecting the level.
2. Watch how those Candles unfold and
record their behaviour and how they are
shaped at specific times through out. e.g.
30m candle, record its shape at 10min,
20min, 25min and the final 5mins
3. When Candle closes, record the outcome
and take a note as to whether this candle
is the sort of candle you would enter based
upon. Repeat this everyday or whenever the
conditions are right.
4. You will soon start to see patterns which lead
to specific candlestick close outcomes, then you
can confidently determine this in real time
and avoid entering on an impulse.

Use "candlesticks" in correct order Just humor at the start of the work week.
Let's laugh and go to work further. After all, whoever works well has a good rest.
---------------------
Share your opinion in the comments and support the idea with likes.
Thank you for your support!

Takuri: shadow down - trend reversal Takuri: shadow down - candles confirmed reversal
The main thing that everyone is interested in is, of course, what candles can confirm a market reversal.
One of the main candles immediately pointed out by the Japanese is the Takuri. The Americans called it a pin bar, where a pin is the shadow of a candle, which is longer than the body. Another name is "Hanging Man". A lot of names, the essence is the same. According to the Japanese, the color and the size of the body of such a candle is not very important. The main thing is the lower shadow, which is much longer than the body.
Such candles certainly reflect investor psychology. Here this long shadow is an indication that the bulls were significantly stronger than the bears during the candles. Of all the candles in existence, pinbar have the strongest signal. It should be interpreted using trends, channels, support/resistance and other candles, as well as confirmed.
Remember: Pinbars cannot be used as an independent signal.
If you can find a good confirmation for the pinbars, however, they can become the basis or addition to your trading strategy. As a result, quite a few systems are based on pinbars.
Push like if you think this is a useful idea!
Write your comments and questions here!
Thanks for your support!

CANDLSTICK or BARS. What common?There are public rules for graphing price movements on the charts of various market assets.
There are two main types of designation:
Candles
They were invented by the Japanese rice merchant Homma Munehisa, which is why they got the name - Japanese candles.
The candlestick gives information about deals within the selected period:
- Opening - the initial price of the period, the price of the first deal.
- High - the maximum price of the period
- Low - reasonable price of the period
- Close - the closing price of the period, the price of the last deal.
- The bod y of the candle is the distance between the open and close.
- Candle shadow - deviations from the opening and closing prices, maximum and minimum values of prices.
Depending on which direction the price went: rose or fell - the candlestick can be bearish or bullish.
Bars
This type of image is not much different from candles. They consist of exactly the same parts and display all the same information.
The bar is rather a more compact candlestick image. Instead of a full-fledged "body", only a vertical stroke is displayed.
What kind of depiction of price movements do you prefer?
Traders, if you liked this idea or if you have your own opinion about it, write in the comments. I will be glad 👩💻

Determine Trend Reversal Using RSI Indicator With Price Action1. Price created lower low and RSI higher low (tight divergence - oversold).
2. Reversed on demand zone with candlestick pattern.
3. Broke down trend structure with retest as confirmation.
4. Price went above 200 EMA and used it as support.

Bearish Reversal Candlesticks PatternsHanging man
The hanging man is the bearish equivalent of a hammer (bullish pattern). It typically forms at the end of an uptrend with a tiny body and a long lower wick. The lower wick designates that there was a large sell-off, but bulls headed to take back control and drive the price up. Holding that in mind, after a lengthened uptrend, the sell-off may act as a warning that the bulls might soon be losing control of the market.
Shooting star
The shooting star is a comparable pattern as the inverted hammer (bullish pattern) but is formed at the end of an uptrend. The shooting star is composed of a candlestick with a long upper wick, little or no lower wick, and a small body, ideally near the low. It indicates that the market reached a high, but then sellers took control and drove the price back down.
Three black crows
The bearish equivalent of three white soldiers (bullish pattern). The three black crows are made of three sequential red candlesticks that open within the previous candle’s body, and close at a level below the previous candle’s low. Ideally, these candlesticks shouldn’t have long higher wicks, betokening continuous selling pressure pushing the price down. The dimension of the candles and the length of the wicks can be used to estimate the chances of continuation.
Bearish harami
The bearish harami is a long green candle followed by a small red candle with a body that’s completely contained within the body of the previous candle. The bearish harami can unfold over two or more days, marks at the end of a downtrend, and may symbolize that buying pressure is decreasing.
Dark cloud cover
The dark cloud cover pattern consists of a red candle that opens above the close of the previous green candle but then closes below the midpoint of that candle. It can often be co-occurred by high volume, indicating that momentum might be shifting from the upside to the downside. Traders might wait for a third red candle for confirmation of the pattern.
Best regards EXCAVO

Trend Continuation Candlesticks PatternsTrend Continuation Candlesticks Patterns
There are countless candlestick patterns that traders can use to identify areas of interest on a chart. These can be used for day trading, swing trading, and even longer-term position trading.
Rising three methods
This pattern occurs in an uptrend, where three consecutive red candles with small bodies are attended by the continuation of the uptrend. Ideally, the red candles shouldn’t breach the area of the previous candlestick. The continuation is confirmed with a green candle with a large body, symbolizing that bulls are back in control of the trend’s direction.
Falling three methods
The inverse of rising three methods, indicating the continuation of a downtrend instead.
It’s relevant to note that candlestick patterns aren’t fundamentally a buy or sell signal by themselves. They are rather a way to look at market structure and a potential indication of upcoming opportunities.
My dear friends, the sooner this publication gets 300 likes, the earlier I will make the next education post about other candlesticks patterns.
Best regards EXCAVO

Train Your Eye's On This It will change your view of the market📋 Educational
—————**-
🗒 Just browsing through my analysis means a lot to me.
➡️ Please follow the analysis very carefully and every detail of the chart means a lot
.

Bullish Candlestick's Patterns You Must Know 🗒 Just browsing through my analysis means a lot to me.
➡️ Please follow the analysis very carefully and every detail of the chart means a lot. And always entry depends on many reasons carefully studied
Always enter into deals when there are more than 5 reasons
combined
------------
Bullish Exhaustion Bar
➕A bullish exhaustion bar
----------
opens with a gap down. Then, it works its
way up to close near its top
In This case, the gap remains unfilled.
In addition, high volume
should occur with the exhaustion bar.
What does it mean?
Its name explains it all.
It represents exhaustion and a failed
lastditch attempt.
After the bears are exhausted,
the bulls will takeover and the market
will rise.
After the bulls are exhausted,
the bears will take the market down.
How do we trade it?
1. Buy above a bullish exhaustion bar
----------------------
➕Bullish Pin Bar
-----
It looks like the nose of Pinocchio.
It has a long and obvious tail.
For bullish pin bars,
the lower tail take up most of the bar. For
bearish pin bars,
it is the upper tail that dominates.
What does it mean?
Paraphrasing Martin Pring,
the pin bar lies like Pinocchio.
With its long tail,
a pin bar breaks a support
or resistance momentarily to trick traders
into entering the wrong direction. These
traders are trapped,
and there is always money to be made when
you find trapped traders.
-------------
➕Bullish Reversal Bar
---------
A bullish reversal bar
------
pattern goes below the low
of the previousbar before closing
higher.
What does it mean?
For the bullish pattern,
the market found support below
the low of the previous bar.
Not only that,
the support was strong enough topush the bar
to close higher than the previous bar.
This is the first
sign of a possible bullish reversal.
How do we trade it?
1. Buy above the bullish reversal bar
in a uptrend
---------------
➕ Bullish Two-Bar Reversal
-----------
The two-bar reversal pattern
-------------
is made up of two strong bars closing
in opposite direction.
The bullish variant consists of
a strong bearish bar followed by a
bullish bar. Reverse the order to get its
bearish counterpart.
-------------
What does it mean?
Every reversal pattern works
on the same premise.
A clear rejection
of a down thrust is a bullish reversal,
and a clear rejection of an up
thrust is a bearish reversal.
In this case, the first bar represents the first thrust,
and the second
bar represents its rejection.
How do we trade it?
1. For bullish reversals,
buy above the highest point of the twobar pattern
--------
➕ Key Reversal Bar
-------
A key reversal bar
---------
is a specific instance
of a reversal bar that shows
clearer signs of a reversal.
A bullish key reversal bar opens
below the low of the previous bar
and closes above its high.
By definition, key reversal bars
open with a price gap. As price gaps
within intraday time-frames
are rare, most key reversal bars are
found in the daily and above time
frames.
How do we trade it?
-----------
1. Buy above a bullish key
reversal bar (If uncertain, wait for
price to close above it before buying.)
-----------
➕Bullish 3 Bar's Reversal
------
In sequence, the three bars of
the bullish pattern are:
-----------
1. A bearish bar
2. A bar has a lower high and lower low
3. A bullish bar with a higher
low and closes above the high of
the second bar
What does it mean?
--------------
A three-bar reversal pattern shows a turning point.
Compared to
the other reversal patterns,
the three-bar reversal pattern is the most
10 Price Action Bar Patterns You Must Know
conservative one as it extends over three bars,
using the third bar
to confirm that the market has changed its direction.
How do we trade it?
1. Buy above the last bar of the bullish pattern

📖 Japanese candlestick charts. Part 1We are beginning a new theme “Trading strategy’s most important technical analysis tools”.
Today we are going to tell you about the most important things in trading, candlesticks!
📌Japanese candlestick charts were developed in the 17th-18th centuries by the Japanese rice traders. They were introduced to trading by Steve Nison in the 20th century. It's a simple, but very important tool for technical analysis, as these candlesticks contain different information about the market. I guess that everyone in this channel already knows how to read candlesticks, so we are going to talk about their usage.
⚡️First — its form, this shows market participants’ state and mood. It could show their doubts/balance (doji) or trend exhaustion (graph looks like a hammer or a falling star). There are only a few main models, and we are going to talk about them in the future. However, you can start learning about them yourself by saving the screenshot below.
⚡️Candlesticks show reversals and it is what we need in trading. By trading reversals you are catching the trend, it could be short or long. However, you will be able to understand when the trend is exhausting and you will be able to leave trade when there is a reversal. In addition to the presence of the reversal pattern itself, the preceding trend is important, you have to have at least 3 candles. If there isn’t a clear trend, then there is no trade. Additionally, we are looking at the candlesticks’ volumes and how trading continues after the last reversal pattern. We are entering position not on the reversal candlesticks, but on the following ones after the trade (or candlestick above/below fixation, depending on a situation)! Reversal setup is a needed factor, but it's not enough to enter a trade.
📌 And these are not all of the necessary conditions for implementation! You have to understand that you are getting rid of risky positions that not only will give you headache but could also result in losses. You should only trade in situations where you are confident in, the confidence is achieved by fulfilling very certain conditions, of which only few people in the market know about. Continued in part 2.

Colored Directional Movement IndexWhat Is the Colored Directional Movement Index (CDMI)?
The Directional Movement Index, or DMI, is an indicator developed by J. Welles Wilder that identifies the direction of the price movements and the trend strength. DMI is a collection of three separate indicators (ADX, +DI, -DI) combined into one
ADX's purposes is to define whether or not there is a trend present and the other two indicators ( +DI and -DI ) serve the purpose of determining trend direction. By combining all three, a technical analyst has a way of determining and measuring a trend's strength as well as its direction
What to look for :
Trend Strength - Analyzing trend strength is the most basic use for the DMI.
Crosses : When +DI is above -DI, there is more upward pressure than downward pressure in the price. If -DI is above +DI, then there is more downward pressure in the price
DMI can provide quality information and even trading signals, but it is not an easy indicator to master and not easy to read within multiple lines
Here comes Colored Directional Movement Index (CDMI)
CDMI is still the same indicator but visualized on the top of the price chart with single line of coloured triangles. CDMI requires additional setting to be provided by user which are Strong Trend and Week Trend threshold levels. Wilder believed that a DMI reading above 25 indicated a strong trend, while a reading below 20 indicated a weak or non-existent trend. Hence the default values for strong trend is set to 25 and week trend set to 17
How to read CDMI , it is simply to read colours and shapes of the triangles
Tringle Shapes indicates the direction of the move and are calculated by comparing the values of +DI and -DI
triangle up shape when +DI is above -DI (+DI > -DI)
triangle down shape when +DI is below -DI (+DI < -DI)
Triangle Colours, there are four main colours:
Strong Bullish : Green is printed when ADX value is bigger than the Strong Trend Threshold +DI is above -DI (ADX > StrongThesh and +DI > -DI)
Strong Bearish : Red is printed when ADX value is bigger than the Strong Trend Threshold +DI is below -DI (ADX > StrongThesh and +DI < -DI)
Weak Trend : Black is printed when ADX value is lower than the Strong Trend Threshold and bigger than Week Trend Threshold ( ADX > WeekThesh and ADX < StrongThesh)
Even Weaker Trend : Yellow is printed when ADX value is lower than the Week Trend Threshold ( ADX < WeekThesh)
Additionally, Intensity changes of colours (between light and dark) will allow you to follow how ADX value is changing comparing it to its previous values.
If current value of ADX is bigger than the previous value of ADX a dark colour will be printed, otherwise when ADX value decrease a lighter colour will be printed
Please check links below for different usages of CDMI
Hope you enjoy this post and find it useful

Bharat Forge - Perfect Example of .618 Bullish Retracement .618 Fibonacci Retracement
Most Popular Retracement
Important retracement for a stock that is selling off after completing a good Rally.
#BharatForge is a perfect example of .618 Bullish Retracement and its amazing to see how prices rallied after hitting .618 retracement
Trade Consideration ( Refer Chart )
Point #1 : A good rally
Point #2 : A sharp Sell-off
Point #3 : Exhaustion Candle with huge volume at .618 Retracement Support ( First Clue from Pure Price Action )
Point #4 : Hammer/Key Reversal Candle with huge volume at .618 Retracement Support ( Second Clue from Pure Price Action )
Point #5 : Huge Volume at two important Reversal Candles ( Exhaustion followed by Reversal )
Assignment for Learners: Identify .618 Retracement on daily chart and post in the comment section
If you have Any Questions, please feel free to ask in the comment section below
Share for Wider Participation and more much educational posts

Exchange Rates: Change AUD back to SGDEarlier this year I had change SGD to AUD as I've planned to travel to Australia, due to Covid19 the plan is cancelled and this is the period I was waiting for a better time to change my SGD back to AUD as there will be no plans of travelling to Australia, at least for now.
I've made some money from the exchange. Having the trading knowledge do helps you to save and earn.

Forex Price Action AnalysisHere we have Really good Setup and price also holding Very well
1) we have very big Wick (shadow) Candle this is the alert time in any trade.
2) we have doji which is for reversal (not all the time) but Volume is good
3) we made bullish candle and bouncing from Support support is Solid.
so when we find the good Support we are ready to buy the retest as always so here we are buying the retest with stop loss below Support
so here we got really decent profit with very small stop loss. and good gain

Trade Reversal Pattern - Evening Star - S&P 500Here is an educational idea. Please do not consider this as a trade idea unless you consider market sentiment and fundamentals that go along with this technical analysis. Trading solely on technical analysis (such as this trade pattern) can turn out to be costly.

Bearish Engulfing Pattern | AUDUSDThe Bearish Engulfing pattern consists of two candles. First one is a small upward candle followed by large bearish candle. The bearish candle must absorbs completely the previous one formed during the uptrend. The bearish candle is not required to cover the shadows of bullish candle.
Requirements for validity:
1. Market in uptrend;
2. Small bullish candle;
3. Second one is large and bearish that compleately cover the bullishcandle.
Tips:
These are standard trading rules. There are many more specifics about order placement that I will reveal in the next posts!
1. Do not trade by candlestick analysis only!
2. Always do combine at least two or more analysis!
3. For example:
- trend analysis (always works);
- support & resistance analysis;
- Fibonacci.
4. Follow us for more tips and analysis!
Recommendations:
Confirmation in the form of a downward candle with a closing price lower than the previous one or a downward gap is recommended, to be sure that the trend is reversing!

