CANSLIM Overview📘 CANSLIM Overview — The 7 Traits of Big Stock Winners
CANSLIM is an acronym developed by William J. O’Neil, founder of Investor’s Business Daily (IBD) and author of How to Make Money in Stocks.
It describes the seven common characteristics shared by the biggest winning stocks before their major price moves.
The system blends fundamental growth, institutional behavior, and market timing—and is grounded in historical quantitative studies dating back to the 1800s.
🧩 The Acronym:
Letter Stands For Core Concept
C Current Quarterly Earnings Explosive short-term earnings growth
A Annual Earnings Growth Multi-year compounding of profits
N New Product, Service, or Management Innovation driving market leadership
S Supply and Demand Stock’s float size and institutional accumulation
L Leader vs. Laggard Relative strength and group leadership
I Institutional Sponsorship Quality fund ownership and buying pressure
M Market Direction Aligning with the general market trend
1️⃣ C — Current Quarterly Earnings: Big Growth, Not Modest Growth
“The biggest winners showed three consecutive quarters of 25%+ growth, but the best averaged 70%+ before their runs.”
Measure this quarter vs. the same quarter last year, not sequentially. This avoids seasonal distortions.
Ideal Growth Rate:
Minimum: +25% YoY EPS growth for 3+ quarters
Stronger filter: +70–100% or even triple-digit earnings growth
Combine with revenue growth of 30–50% or more.
Stocks with massive EPS and sales growth attract institutional attention early.
Modern Adjustment:
Today’s growth leaders (e.g., NVDA, TSLA, PANW) still show these patterns, though some use non-GAAP EPS or adjusted metrics. The concept—explosive profitability inflection—remains identical.
2️⃣ A — Annual Earnings Growth: Sustained Profitability
“Look for at least three years of annual earnings increases.”
Consistency is key. Accelerating growth adds conviction.
Avoid one-time spikes or negative earnings trends.
Favor firms with 3+ years of 20%+ annual EPS growth and positive forward analyst estimates for continuation.
Analyst Upward Revisions are particularly powerful—funds often buy on these changes.
Interpretation:
Multi-year profit acceleration shows management execution, competitive edge, and strong demand.
Example: O’Neil’s model studies (1952–2001) showed 73% of winners had +70% EPS growth the quarter before their breakout and 3+ years of rising annual profits.
3️⃣ N — New Product, Service, Management, or Market Catalyst
“You want the next Apple, not the next RCA.”
Innovation is the engine of multiple expansion. The “new” can take many forms:
Breakthrough product or service
Transformative business model
New leadership or management
Market share disruption
Examples (then and now):
Apple (iPhone), Tesla (EVs), Nvidia (AI GPUs), Uber (gig economy)
Earlier eras: IBM, Home Depot, Microsoft
Psychological angle: Human nature craves novelty. The market rewards perceived future dominance, not current stability.
4️⃣ S — Supply and Demand: The Float Matters (Less Now)
Originally, O’Neil favored smaller floats (≤50–70M shares) since limited supply + strong demand = sharp price moves.
“It’s less critical today—large caps can still double or triple. Focus on quality, earnings, and leadership over share count.”
The principle still holds but is muted due to:
ETFs, passive flows, and massive institutional liquidity
Widespread retail access and option leverage
The core idea remains: price rises when demand exceeds supply, visible via volume surges.
Modern adaptation:
Monitor volume spikes, accumulation/distribution, and relative volume ratios over absolute float size.
5️⃣ L — Leader vs. Laggard: The Power of Relative Strength (RS)
“Buy the strongest stocks in the strongest groups during a confirmed uptrend.”
O’Neil found each bull cycle is led by 2–3 dominant industry groups (e.g., semiconductors, software, solar).
Within those, only the top few names outperform meaningfully.
Key Filters:
Relative Strength (RS) Rating: 85–99 (top 15% of market)
Leading groups by RS, EPS growth, and fund buying
Avoid laggards even within strong sectors.
Modern context:
Institutional algorithms still chase relative momentum. RS-based filters would be Ideal.
“When you have the strongest stocks, in the strongest sectors, in an uptrend—and you use disciplined stop-losses—it’s very hard not to make money.”
6️⃣ I — Institutional Sponsorship: The Smart Money Footprint
“70% of market volume comes from institutions—follow their footprints.”
Institutions (mutual funds, hedge funds, pension plans) create sustained demand that drives major trends.
Key things to watch:
Rising number of institutional holders quarter-over-quarter
Presence of high-quality funds (e.g., Fidelity Contra, Vanguard Growth)
Volume patterns on charts confirming accumulation
Quantitative Significance:
Example: Zoom (ZM)—278 funds → 1,413 funds within 7 quarters (5× increase)
Enphase (ENPH)—160 → 1,008 funds in 8 quarters
Such surges often precede parabolic price advances.
7️⃣ M — Market Direction: The Most Critical Factor
“If you don’t get the M right, nothing else matters.”
O’Neil’s data showed:
3 out of 4 stocks follow the general market trend.
Even perfect fundamentals fail in bear markets.
Core Rule: Only buy aggressively during a confirmed market uptrend.
The signal is the Follow-Through Day (FTD)—a +1.5% or greater gain on strong volume, typically 4–10 days after a market low.
When the Market Is Choppy or Bearish:
Reduce exposure or move to cash (cash is a position).
Focus on capital preservation over prediction.
⚠️ Risk Management — The “Eighth Principle”
“You can be right 1 out of 3 times and still make a fortune—if you cut losses fast.”
O’Neil borrowed from Jesse Livermore and Bernard Baruch’s philosophy:
Max loss per trade: 7–8% (ideally 5%)
Never average down; if it fails the breakout, sell immediately.
Emotional capital matters as much as financial capital.
Risk Math:
Loss Required Gain to Break Even
7% +7.5%
20% +25%
50% +100%
→ The deeper the drawdown, the harder recovery becomes — and the worse your discipline gets.
Cutting losses early keeps both capital and confidence intact.
Advanced Discipline:
Always use stop-losses near pivot points
Size positions so that total portfolio risk ≤1–2% per trade, and the Reward is 3x your risk.
Expect that most trades won’t work; winners will more than offset losers
🔢 Practical CANSLIM Checklist
Step Criterion Target Metric
C Current quarterly EPS growth ≥25%, ideally 70%+
A Annual EPS growth 3 consecutive years ≥20%
N Innovation or catalyst New product/service/management
S Supply-demand imbalance Volume > average, low float optional
L Leadership RS ≥85; top 3 names in top sector
I Institutional ownership Increasing QoQ, ≥2 top-tier funds
M Market trend Confirmed uptrend via FTD
Risk Stop loss 5–8% below entry, always enforced
🧠 Psychological Cornerstones
Human nature never changes. Fear and greed drive every cycle—from 1800s railroads to 2020s AI stocks.
Discipline beats prediction. Entry precision is less important than loss limitation.
Conviction comes from quality. Big winners are clear leaders with strong fundamentals.
Cash is a position. Avoid trading in “cold decks” (sideways or down markets).
Emotion control = longevity. Protect your confidence as much as your capital.
🧩 Modern CANSLIM Adaptations
While CANSLIM’s DNA remains timeless, modern quantitative investors integrate:
Relative Volume & RS Ranking (machine-scored)
EPS revision momentum (analyst upgrades)
Institutional rotation data (13F filings, ETF flows)
Macro context: liquidity cycles, Fed policy, credit spreads
Technical refinements: base patterns, volume dry-ups, and volatility contraction setups (VCP).
💬 Summary Insight
“Nothing has changed since the 1800s—only the tools.
Human nature and crowd behavior are constants.”
CANSLIM is a structured behavioral framework for spotting institutional accumulation of fundamentally superior companies at the right time in the market cycle.
Its greatest edge lies not in stock-picking, but in discipline—knowing what not to touch, when to cut, and when to press.
Here is the Screener I use.
www.tradingview.com
Canslim
Nice and simple Breakout on high relative strengthFTDR is a pattern breakout .
Even with the S&P falling more sharply and the NASDAQ rallying, FTDR is able to breakout from a base today on good, rising volume. A breakout under these market conditions shows high relative strength.
The fundamentals also look good. EPS increased significantly by almost 50% in each of the last four quarters.
The homebuilding sector has been stronger in recent months, although the Fed's decisions this week may have a greater impact here.
True leader! I'll buy it.

TSI Market Timer V4.0TSI Market Timer Version 4.0
This indicator is probably one of the best, if not the best indicator out there on the market today. A bold claim. I say that because this indicator has been 10 years, at least, in the making.
I started using TradingView in 2015 when it was $5 to use. It was wonderful. And you could make your own indicators. I would copy and reuse many of the indicators I found.
This tinkering with indicators and theories would last until the present day. I find the market is interesting and there are many new things to learn and so you can make nearly endless indicators.
About This Indicator:
The TSI Market Timer Version 4.0. First, a little theory. I have found that, in practice, if you take any price or indicator (like Acc/Dist) or VIX or even ratio charts like (HIGN/LOWN , a new highs new lows ratio) and you apply the True Strength Indicator (TSI)... that you can plot everything on one charting window. I have extensively tested this out over the years.
There is a concept in math and statistics called standardization. One common way this is used in trading is the z-score. You may have heard of the Altman Z-score.
In this indicator, I have combined several useful signals into one indicator. These are plotted on an auto-scaled plot with a zero line.
Here is an explanation of the lines and their colors.
- White lines : These are TSI price lines using two variations in the calculations. One is done using a SMA or simple moving average, the other is done using an exponential moving average. I have even used the weighted moving average. However, I find the SMA/EMA to be the most "error free" version.
If the EMA white line (price) is above the SMA white line, then it is bullish because the most recent price changes are given more weighting with the EMA version. Thus, if EMA white line > SMA white line then it will fill green and if it is less than the SMA version, it will fill with red color.
- Lime Green fill : The lime green color on the EMA/SMA white line combo means a new high was touched. This is very useful if you are a William O'Neal Swing Trader as I am. Dr. Wish speaks of the Green Line Breaks which represent new highs and their importance. See www.wishingwealthblog.com
- Orange/Gold Line : The Orange Line is the TSI calculation of the DXY (or US Dollar Index). This is something that I noticed that no one else talks about.
The US Dollar Index used on the TSI chart is really useful since it moves in direct opposition to the price of many indices.
My theory on this is due to the fact that the US Dollar is the "other side of the trade". Thus, if you buy several billion dollars worth of a stock, the US Dollar Index goes down and when you sell the shares back, the US Dollar Index goes back up.
Thus, it is tied into borrowing, leverage, borrowing costs, interest rates and similar things.
It has a similar relationship to stocks as oil does to airlines. When USOIL is up, AAL or DAL stocks are often down.
The leveraging of stock purchases explains why the stock market and the US Dollar work in contrarian directions.
I don't know why others have not seen this. It is probably due to the fact that the DXY is a big number and the changes are small and thus it has scaling issues with other forms of analysis. In other words, if you try to evaluate it in other ways, it does not scale on the charting and thus, traders/analysts would dismiss it.
Purple Lines : Comparison Indexes
Dark Purple Line: TSI Comparison line. Default is VIX line. The Vix Index with the TSI calculation applied.
Light purple/ lavendar line: This is an index such as the QQQ, which is used as the default.
Both of the purple lines are customizable.
Centerline: Accumulation-Distribution (mini):
Lastly, we have the centerline which is a smaller version of the light blue line; the Accumulation/Distribution Line. In this case, I wanted to show it as a kind of "money flow". This is a mini-version of the AD line. You can adjust the size using the zoom % on the indicator settings tab. The default is zoomed out 10%.
In addition, you can toggle the red/green fills of the stock/DXY lines and the stock/index lines.
Cheers!

EDUCATIONAL: F 200%+ move in 82-84I want to start periodically sharing my retrospective analysis of market leaders, that made triple digits gains during bull markets in different time-periods.
The purpose of this analysis is to find commonalities in price patterns and behaviour among the best-performing stocks, that repeat themselves in each and every up-cycle throughout market history. That will help new stock market participants to better exploit new emerging opportunities.
As my stock market history teacher - John Boik - use to say it: "Study the past, so you can profit in the future".
Retrospective analysis of Ford ( NYSE:F ) during 1982-194:
0. Great Relative strength. When SPX (see the upper chart) makes lower lows, FORD is making higher highs on noticeable pick-up in average daily volume. Also notice who price creates a flat-base and latter breaks out (BO) from it with volume surging above average;
1. First BUY could be made here with very tight 3% stop, a bit or right after W. O'Neil's «shake-out + 10%» rule (buy if price shakes you out and quickly reverse and runs higher by 10%) after the double bottom pattern in the bottom of the base.
2. Because of the bear market nature of the general index, quick 12-15% gain could be used to trim 1/2 or 2/3 of the position to guaranty profits, and selling the rest for break-even during the following re-test of break-out area;
3. Could be bought again during the BO of perfect VCP with tight 2.5% stop, and...
4. ...sold for the quick 5-7x return-to-risk gain.
5. When the index makes its final lower-low, F's price rebases, making a higher-low, and quickly runs higher and breaks out in Aug82 along with the SnP500.
F could be bought and shaked out during initial BO attempt, and then re-bought after price follows through in two days with volume support.
Notice how price pattern rhythms with prior Dec81-Mar82 base.
6. This big red reversal bar with substantial volume pick-up could be used to book another 15-17% gain with only initial 3-4% stop.
7. It is already clear that F is the new market leader of this new up-trend and it makes sense to track how the price acts if it corrects to 50MA (Red line) that coincides with re-tests of prior BO point.
If to zoom in into the volume dynamics of this basing actions around 50D MA, accumulation (surge in volume with closes in in upper part of the bar dominate volume on corrective bars) becomes very evident.
8. New BUY coming from this low cheat BO with massive volume support. Because the average cost was so low, one may want to move stop to break-even or tracing 50D MA.
9. Price closed in the upper third of the day - good supportive actions on the 50D MA. If stopped-out, shares could be re-bought by the end of the day or on next day BO with tight stop and low of the day.
10. Shares could be sold into this kind of climactic run above the 7 month channel line + the general market barely moves to old highs indicating relative divergence and lack of overall momentum in the market.
11. Good tight area. Could have been bought at BO and sold at BE after the BO proved to be fake one.
12. New BUY under shake-out + 10% rule with stop bellow
50D MA after it crosses the buy price. Massive volume advance on BO day acts as confirmation of large institutional interest in the stock (notice how these green volume sky-scrapers bars tend to dominate the red selling bars latter-on until the up-trend changes).
Notice again how the price shows the same character shake-out pattern it made during Dec81-Mar82 and May-Aug82. As Nicolas Darvas observed that "stocks have characters just like people".
13. Perfect selling area: price moves above the channel line in negative divergence to the market (index is not making higher-highs).
14. Same type of character behaviour with shake-out and Mark Minervine's «slingshot» move on volume support, where «shake-out +10%» buy rule could be used to establish the position with tight stop bellow the short-term 8/21emas.
15. Sell 3/4 of position or all in this first evident distribution bar + the market seems tired and is loosing momentum.
Very noticeable distribution bars starting to appear - some heavy selling and not much buying.
Important sign of character change.
16. This low volume pattern during this up-move shows that late retail buyers are stepping in with no institutional support.
That is the hint that price advance is prone to failure.
17. Definite selling signal. Price dives bellow 50MA with substantial distribution started dominating the volume pattern.

ADBE - Solid Fundamentals and MomentumAdobe Inc. (ADBE) stands out as a company with strong fundamentals. Adobe is renowned for its exceptional products such as Photoshop, Acrobat Reader and Creative Cloud.
ADBE's price climbed up to 54% since May 2023 Rather than succumbing to the fear of missing out (FOMO), a patient approach is warranted. I refused to chase the price. I want the price to come to me.
Waiting for a pullback or the formation of a solid base will provide opportune moments for entry.
A pullback can offer an attractive entry opportunity. Waiting for a pullback or the formation of a solid base would provide me strategic entry points. By monitoring key support levels, daily pivot misses, and structural breakouts as a mean of my timing to buy the stock with optimized risk and reward.
Entry trigger from a pullback : Price retraces to significant levels and then a bullish reversal candle formed or a structural breakout or a daily pivot being missed.
Entry trigger from a solid base : Price breaks the resistance level WITH volume.

Buy when Price is above 20/50/200There are always be trouble below 20ema or 50ema or 200ema or combination of all.
Your odds to make a profit in the market increased significantly if you only buy anything above the 20ema or the 50ema or 200ema or combination of these MAs.

Trading is about fighting FOMO TrapWhen price broke above the 20/50/200.. always wait for a pullback or a base on top of the moving averages. Safer that way. Best time to be involved is in Stage 2 and Stage 3. The only stage you should be involve in to make money.
Patience.
Avoid FOMO Trap.

Trading is Patience #ABNBOnce you have selected a stock with decent fundamentals (review every month if the stock still fundamentally sound), then you just need the chart to tell you when to buy it.
Trading is all about waiting/patience.
When price is below the 20/50/200, you stay in cash. You wait.
When price is above 20/50/200, you wait for a base/pullback and a trigger.
In this example, there was a decent gap up breakout but got stopped out. So what? A good system just need a 30-40% winning rate.
Look for a base and you WAIT.

FLNC Possible long ideaI closed CSIQ with some small loss, I didn't like how the stock acted once it broke the previous known resistance. I am also monitoring DORIAN LPG for closure if it doesn't start reversing on the current drop. I know you are not here to read about my missed trades but to find an idea where to go next.
New stock which IPO-ed in October 2021 is currently on path to break it's resistance zone sitting at $25.33 level.
Some things to consider:
1. The resistance level is a bit bigger than usual, it goes from $25.33 to $26.77 level, so I am considering in adding to the position partially.
2. My first, smaller buy will be made this week surely. I am watching the stock and aiming for the $25 level for first potential buy.
3. I plan to add smaller positions all the way up, of course, that is if the stock goes up. Next buy level will be around $25.5
4. Exit plan will be set at $21.5 price level, which is just below the 10SMA on Daily level.
5. Next big adding point for me would be break of the $27.54 price level, since this line represent a significant resistance level. That level extends all the way up to $28.26 price level.
6. The last and the most important note is that the pattern we are having right now, known as double bottom, is about to break. If it breaks, nice run of the stock is to be expected.
Of course, as always, this is not financial advice nor I am eligible to provide some. This is just my two cents. Happy trading guys.

TOP US-Stocks: Updated WatchhlistJS-TechTrading: Updated Watchlist
All stocks on our watchlists are high momentum stocks and meet the hard selection criteria according to Mark Minervini's Trend-Template.
Furthermore, the stocks on our watchlist have been screened by William o' Neil's CAN SLIM methodology and are among the top 25% of all US stocks with regards to their underlying fundamental performance.
🍾🍾 We trade like the Champions 🍾🍾
Here is the link to the updated watchlist:
www.tradingview.com

WSC - WillScot Mobile Mini HoldingsSimple base breakout accompanied by a surge in volume, albeit not a massive surge. Would like to see continued volume surges to get a cushion to allow for a hold thru earnings on 2/21.
Great growth numbers, earnings & sales accelerating at a strong pace on a YoY & QoQ basis.

ALGM - Allegro MicroSystems, Inc.Been eyeing this one. Had a nice move on Thursday, breaking out with a surge in volume. May regret not buying, but decided to hold off with earnings coming up on Tuesday morning. Still one of the top names on my focus list.

ARHS - Arhaus, Inc.Very nice reaction off of the 9ema this morning. Largest 30-min volume since the gap up on raised revenue guidance.
Started a small position; couldn't justify a full position with the overall market being slightly extended on a short-term basis and showing negative action on the day.
Will look to add over the debut price high of $14 only if the broad market continues its bullish phase. The all-time-high of 14.95 looms overhead, but with the volume & growth on this name, I'd expect it to clear that level as long as the market environment remains favorable.
The FOMC decision and statement on Wednesday will have a major impact on the market environment. Even if I am shaken out of this starter position, I'm keeping this one on my focus list for as long as the environment remains healthy. This has the potential to be a true market leader.

BROS - Dutch Bros Inc.One of the longer-term plays I am watching. IPO'd back in 2021, they don't have much in the way of current earnings, but analyst estimates are expecting big growth over the next couple of years.
Starting to inch its way up the right side of a possible stage 1 base on good volume. Don't need to rush into buying this one - need to let it show me that it is in fact ready to go. As of now, it's still in a downtrend regardless of the constructive action since the start of the year.

AMKR - Amkor Technology, Inc.Top of my focus list going into the upcoming week. Growth numbers are good, increasing number of funds buying shares, earnings still two weeks away.
On a technical basis, a surge in volume took prices thru some key highs and now we're seeing an orderly consolidation with good looking volume patterns.
Ideally, we get another volume surge that takes us thru last week's highs around 30.50.

🟨 2023 WATCHLIST: $HALO2023 WATCHLIST
A series of stocks that i will be monitoring at the beginning of 2023
Here is a new issue from the Biomed Industry.
Relative Strength (IBD): 97
IPO: 2007
Sales acceleration:
Jun-22: 12%
Sep-22: 80%
Funds acceleration:
Jun-22: 708
Sep-22: 743

🟨 2023 WATCHLIST: ACLS2023 WATCHLIST
A series of stocks that i will be monitoring at the beginning of 2023
Here is a new issue from the Semiconductor Industry.
Relative Strength (IBD): 95
IPO: 2000
Sales acceleration:
Jun-22: 50%
Sep-22: 30%
Funds acceleration:
Jun-22: 499
Sep-22: 496

🟨 2023 WATCHLIST: $SMCI2023 WATCHLIST
A series of stocks that i will be monitoring at the beginning of 2023
Here is a new issue from the Computer Hardware Industry.
Relative Strength (IBD): 99
IPO: 2007
Sales acceleration:
Jun-22: 53%
Sep-22: 79%
Funds acceleration:
Jun-22: 385
Sep-22: 421

🟨 2023 WATCHLIST: $CELH2023 WATCHLIST
A series of stocks that i will be monitoring at the beginning of 2023
Here is a new issue from the Beverages Industry.
Relative Strength (IBD): 97
IPO: 2022
Sales acceleration:
Jun-22: 137%
Sep-22: 98%
Funds acceleration:
Jun-22: 414
Sep-22: 484

🟨 2023 WATCHLIST: $CAT2023 WATCHLIST
A series of stocks that i will be monitoring at the beginning of 2023
Here is a new issue from the Construction/Mining Industry.
Relative Strength (IBD): 95
Sales acceleration:
Jun-22: 11%
Sep-22: 21%
Funds acceleration:
Jun-22: 2652
Sep-22: 2558

🟨 2023 WATCHLIST: $MBLY2023 WATCHLIST
A series of stocks that i will be monitoring at the beginning of 2023
Here is a new issue from the Semiconductor Industry.
Relative Strength (IBD): 96
IPO: 2022
Sales acceleration:
Jun-22: 41%
Sep-22: 38%

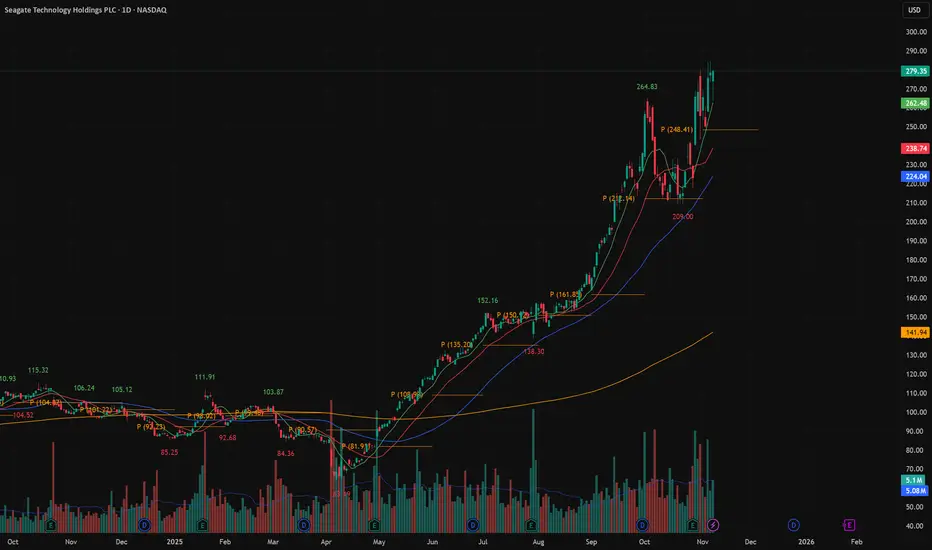
RBC Breakout Long TradeRBC is seeing incredible growth. I've overlaid the last 4 quarters of sales and earnings growth from MarketSmith on the chart. Any company that can double their sales every quarter for a year has explosive upside.
The numbers of institutional funds who own the stock is steadily growing, and it is owned by some of the best-performing mutual funds including T.Rowe Price New Horizons and Lord Abbett Developing Growth.
After a huge rise over the summer, RBC stock has consolidated in a series of shallowing retracements as the stock works through sellers in the $250-$260 area. Once these sellers are exhausted and the weak hands are out, RBC will be further consolidated into institutional hands and free to continue its advance higher.
Traders could buy here with a 5% stop beneath the swing low or wait for a break of the trendline to initiate a buy.
DISCLOSURE: I own shares of RBC and have an order to buy more on a move above 254.10.

HDSN - Hudson Technologies, Inc.Had breakout on Friday. Noticeable volume on the shortened trading day. Don't mind buying around the Friday highs, prefer a small pullback maybe into the $11 area. Stops 2-3% below Friday's low.
Market environment is still making me want to realize quick gains, raise stops quickly.
Small cap ($500m), growth may be decelerating but still low valuation (6.8 f.p/e)
