Cardano Update · What Happens Now?I am going to assume that you read the XRP update I just published. While these are different pairs, my updates and publications are all related because I look at the entire market—for you—as a unit.
The situation with Cardano is different to XRP. Why? Because XRP already broke its previous bullish wave high while Cardano hasn't. This first tells us that Cardano has more room for growth and has less risk from a buyers standpoint. It can also be seen as Cardano being weaker or lagging behind in someway but I wouldn't give credit to this interpretation. The truth is that the market moves in unison but not at the exact same time.
May's high, reached first from the 7-April bottom, has been challenged but confirmed as resistance. This won't last long. It has been confirmed as resistance and we can easily see it by yesterday's red candle. This is normal. If you look at 14-July and 12-July, these days were also red yet Cardano continued growing. You can expect the same.
We can have one day red, two red days, three red days and nothing changes. The market is set to grow, is growing and will continue to grow in the coming weeks and months. Long-term growth and even beyond months. There is the possibility of growth extending to years similar to Bitcoin.
When a huge wave develops, we get a half year strong correction, a major higher low compared to the start of the phase followed by additional growth.
Let's get back to today and what is happening now.
ADAUSDT managed to break above MA200 16-July, just three days ago. This confirms a long-term growth process; it is now confirmed. This means that Cardano is on track to grow for 3-6 months minimum.
What we are seeing now is only the start of a major advance and the continuation—on a long-term basis—of the move that started in late 2024.
You can rest easy, sleep easy while you watch your profits grow. Cardano will continue growing, it will do great; you have my word.
Thank you for reading.
If you enjoy the content leave a comment just for this one, I will be sharing updates for you now, today, yesterday, tomorrow and for years to come.
Namaste.
Cardano
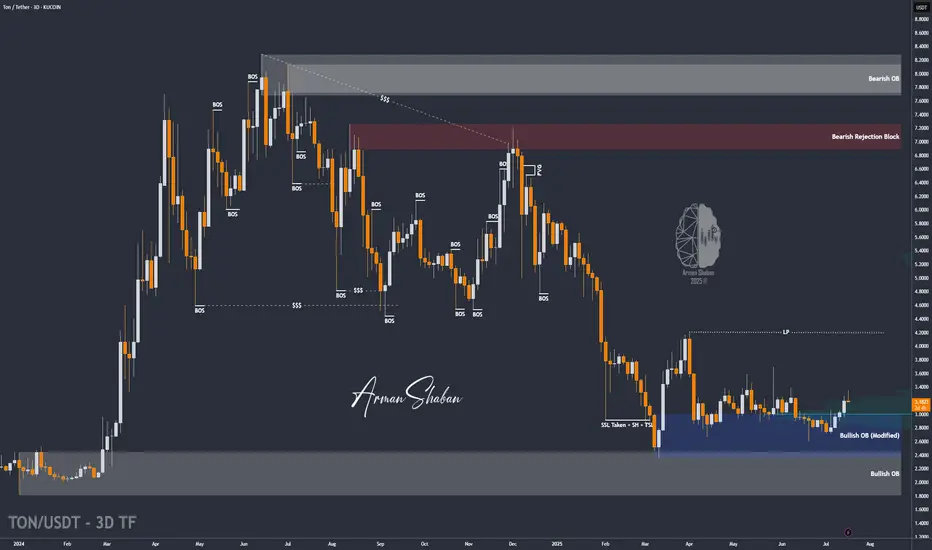
TON/USDT | Another Bullish Move Ahead? (READ THE CAPTION)By analyzing the Toncoin chart on the 3-day timeframe, we can see that, as per yesterday’s analysis, the price climbed to $3.36 before facing a slight correction — which is perfectly normal since every strong bullish trend needs a healthy pullback. The $3.05–$3.20 zone could serve as a good accumulation area for buyers, and we may soon witness another impressive rally from Toncoin! Based on the previous analysis, the next targets are $3.63, $4.20, and $4.68.
Please support me with your likes and comments to motivate me to share more analysis with you and share your opinion about the possible trend of this chart with me !
Best Regards , Arman Shaban
ADA/USDT | BIG Bullish Move Ahead! (READ THE CAPTION)By analyzing the Cardano chart on the 3-day timeframe, we can see that, as expected, the price continued its rally, reaching $0.89 before collecting liquidity above the $0.86 level and then facing a correction. Currently trading around $0.81, we expect the bullish trend to continue after this minor pullback. Key demand zones are at $0.78, $0.69, and $0.61. Based on the previous analysis, the next short- to mid-term bullish targets are $0.93, $1.05, and $1.33.
Please support me with your likes and comments to motivate me to share more analysis with you and share your opinion about the possible trend of this chart with me !
Best Regards , Arman Shaban

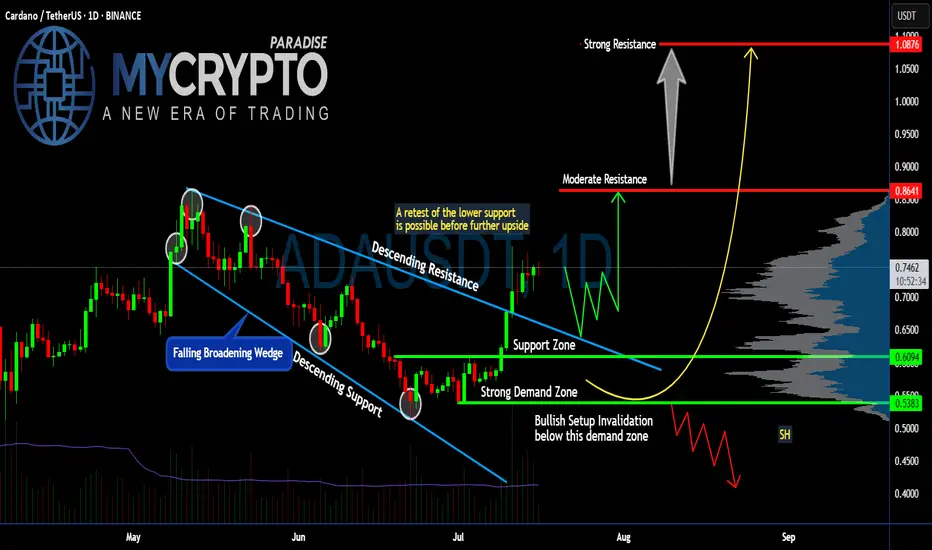
Is #ADA Ready For a Major Move or a Trap is Ahead? Watch this Yello, Paradisers! Is this breakout on #Cardano the start of a major upside move or just another bull trap waiting to flush out impatient traders? Let’s break down the latest #ADAUSDT setup:
💎After weeks inside a falling broadening wedge, #ADA finally broke above the descending resistance, signaling a potential trend reversal. The breakout above $0.70 has pushed the price toward the current $0.74 zone. The soaring volume and a positive broader market outlook reinforce our bullish bias. While this looks bullish, the key question is whether #ADAUSD will hold above its reclaimed support or retest lower levels first.
💎The structure is straightforward: #ADA reclaimed the support zone around $0.70 after bouncing strongly from the demand zone near $0.61–$0.60. This demand zone remains the critical area to watch—any healthy retest here would provide a high-probability continuation setup for bulls.
💎If buyers maintain control, the first target sits at the moderate resistance of $0.86. That’s where the next notable selling pressure is expected. But the real battle will take place near the strong resistance at $1.08—a zone where major distribution and profit-taking could occur.
💎However, the bullish setup becomes invalid if #ADAUSD loses the $0.61–$0.60 demand zone. A confirmed close below $0.538 would flip the structure bearish, signaling a potential continuation to lower lows.
Stay patient, Paradisers. Let the breakout confirm, and only then do we strike with conviction.
MyCryptoParadise
iFeel the success🌴
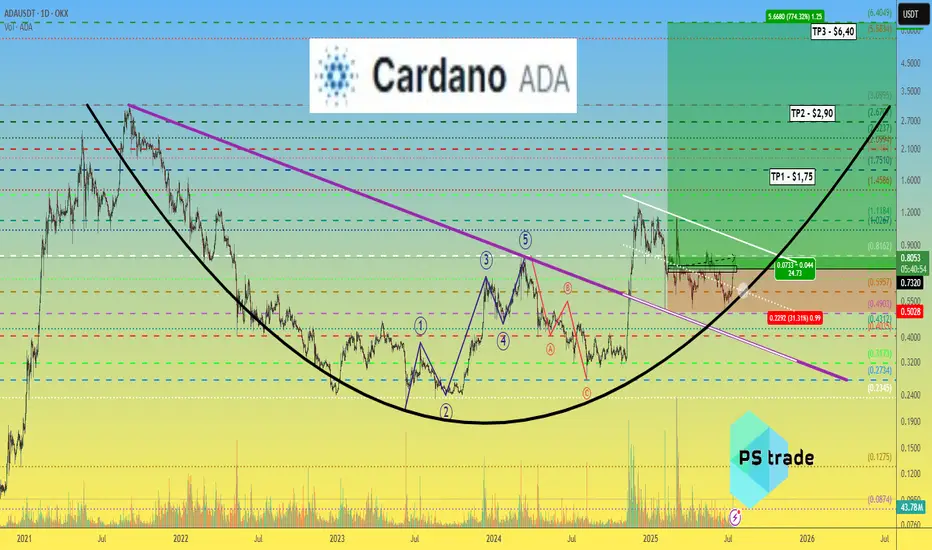
Cardano ADA price analysis🪙 Five months ago, we published a medium-term trade for CRYPTOCAP:ADA , and the price still remains in the buying zone.
With the current growth, the price of OKX:ADAUSDT remains in consolidation, and when the correction begins, it would be very good if it stayed above $0.60.
😈 If you still have faith in the prospects of the #Cardano project, you can continue to hold or even buy #ADA during the correction.
Well, theoretically possible targets for the #ADAusd price are:
TP1 - $1.75
TP2 - $2.90
TP3 - $6.40
_____________________
Did you like our analysis? Leave a comment, like, and follow to get more
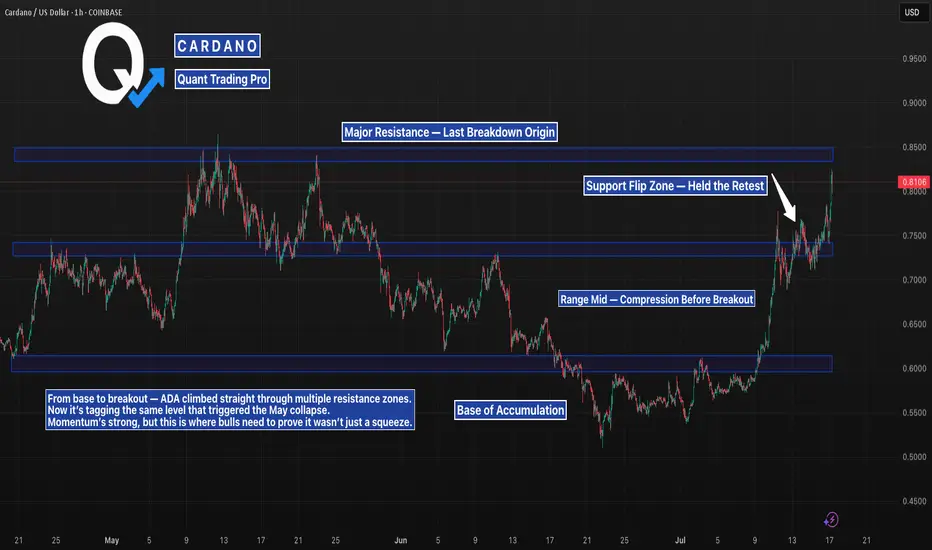
ADA Just Reclaimed Structure and Hit the First WallADA just ran from sub-$0.60 to above $0.80, reclaiming every key level along the way.
Now it’s testing the same resistance that sparked a sharp dump in May.
This zone is no joke — it’s where trends get confirmed… or crushed.
Watch the reaction here closely.
#ADA #Cardano #ADAUSD #CryptoCharting #BreakoutLevels #BacktestEverything #TradingView #QuantTradingPro #CryptoMomentum
ADA/USDT : +50% in 21 Days, More Rise Ahead? (READ THE CAPTION)Over 50% growth in just 21 days — Cardano’s explosive rally continues, and the $0.76 target has now been hit! Since our last analysis, ADA has kept pushing higher, successfully reaching the next key level and bringing the total return from this move above 50%. Currently trading around $0.73, with strong bullish momentum still in play, I expect it won’t be long before we head toward the next targets. Upcoming levels to watch: $0.93, $1.05, and $1.33 — we’re getting closer to that 100% gain!
Please support me with your likes and comments to motivate me to share more analysis with you and share your opinion about the possible trend of this chart with me !
Best Regards , Arman Shaban

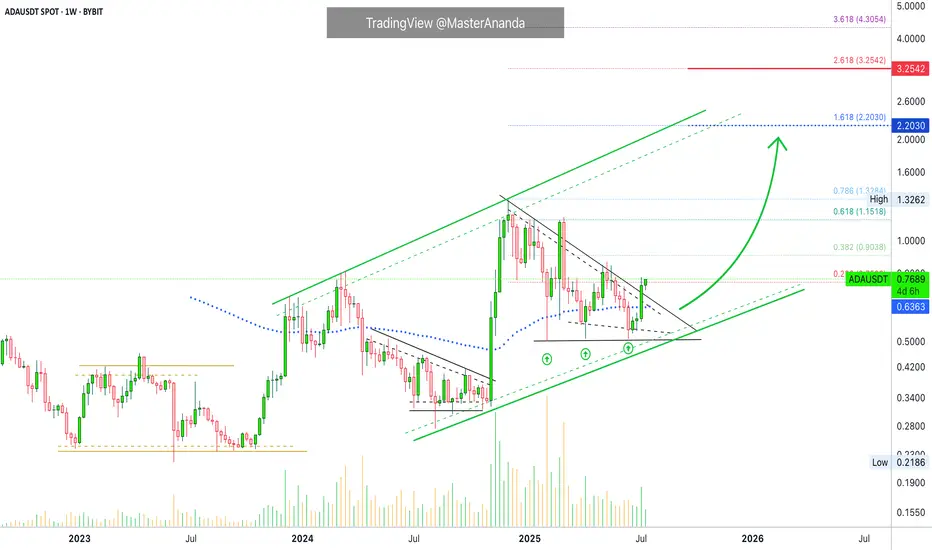
$2.2 Followed by $3.25 · Cardano Trend-Based Fib ExtensionCardano is a on a clear, and very strong, ascending channel rising since June 2023. We are clear, safe and confident about the bigger-broader market trend. An uptrend within a long-term bullish cycle.
After the peak in early December 2024 Cardano struggled to stay above EMA89—the blue dotted line on the chart—but this isn't the case anymore. After a triple-bottom, shy higher lows, last week ADAUSDT managed to break decisively above this level with a full green candle. This confirms the resumption of the late 2024 bullish wave.
Last week resistance was found at 0.236 Fib. extension. The weekly session closed right below it and this is shown as a thin tiny red dotted line on the chart. The current week is halfway through and ADAUSDT is now trading above this level. The bullish signal comes from the fact that the action is happening at the top of the candle; this is the fourth consecutive green week; the bullish bias is fully confirmed.
That is all there is. I just wanted to share a small update in support of our bullish bias based on chart data. You can rest easy knowing that the market will continue to grow.
Next target is $2.20 for 188%. Followed by $3.25 for 325%.
We use leverage on the big projects so the potential for profits can be multiplied by 5, 6, 7, 8, or 10X. The risk is higher of course, but so is the potential for reward. High risk vs a high potential for reward. You can always approach the pair spot if uncertain. If you lack experience but still want to join the ride, enjoy the rise, make money and have fun, you can buy spot, that is, buy and hold. The market will give you money if you are patient enough. This is the period where everything grows. Thanks a lot for your continued support. If you enjoyed the content consider hitting follow.
Namaste.
ETH/USDT : $3000 Reached, It's time foe $4000? (READ)By analyzing the Ethereum chart on the weekly timeframe, we can see that the price has finally broken the strong $2700 resistance and pushed toward the next target at $3000! Currently trading around $3150 and now within the $3130–$3440 zone, I expect a short-term rejection from this area. However, given the overall market trend, this level may not hold for long, and we could soon see a breakout toward the next targets at $3500, $3740, $4100, and $4470!
Please support me with your likes and comments to motivate me to share more analysis with you and share your opinion about the possible trend of this chart with me !
Best Regards , Arman Shaban
THE LATEST ANALYSIS :

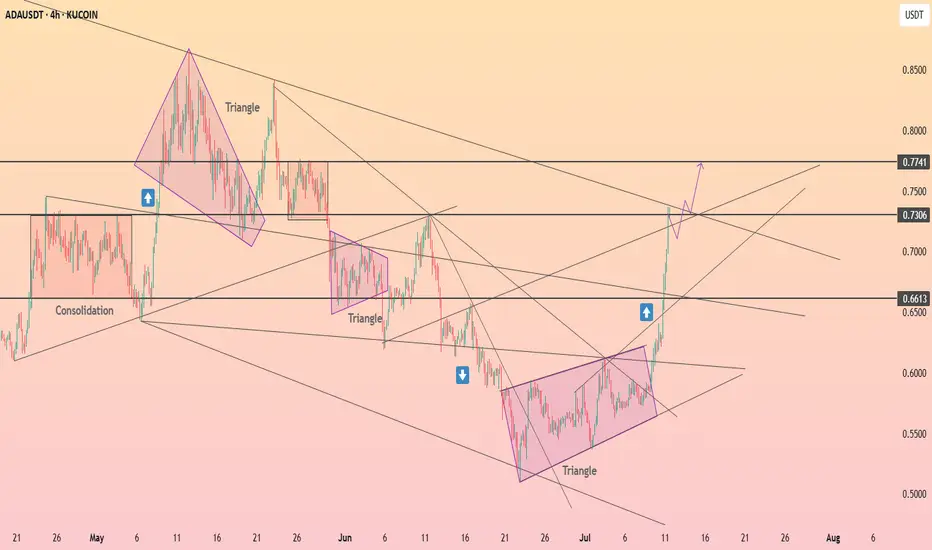
HolderStat┆ADAUSD seeks to $0.774KUCOIN:ADAUSDT recently broke out of a multi-week triangle formation on the 4H chart. The clean break above 0.66 has invalidated the previous downtrend and triggered a new leg higher. With ADA currently riding within an ascending channel, the path toward 0.73–0.75 remains open as momentum continues building.
ADA - Beginning of something crazy- ADA is looking forward to the successfully breakout of the trendline resistance.
- A clean breakout from this resistance must to fuel the bullish trend.
- I'm expecting a target of 3$ from this trend.
Entry Price: 0.72
Stop Loss: 0.4838
TP1: 0.8602
TP2: 1.0342
TP3: 1.3379
TP4: 2.0144
TP5: 2.4818
TP6: 3.0329
Stay tuned for more updates
Cheers
GreenCrypto

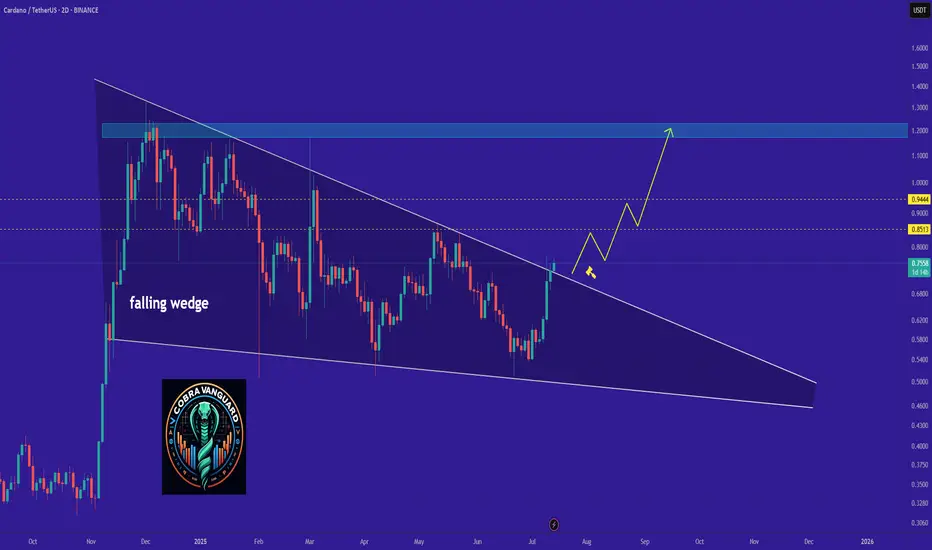
ADA - Time to buy again!The price has broken the wedge pattern, which means it can easily reach its previous high or even go higher.
Best regards CobraVanguard.💚
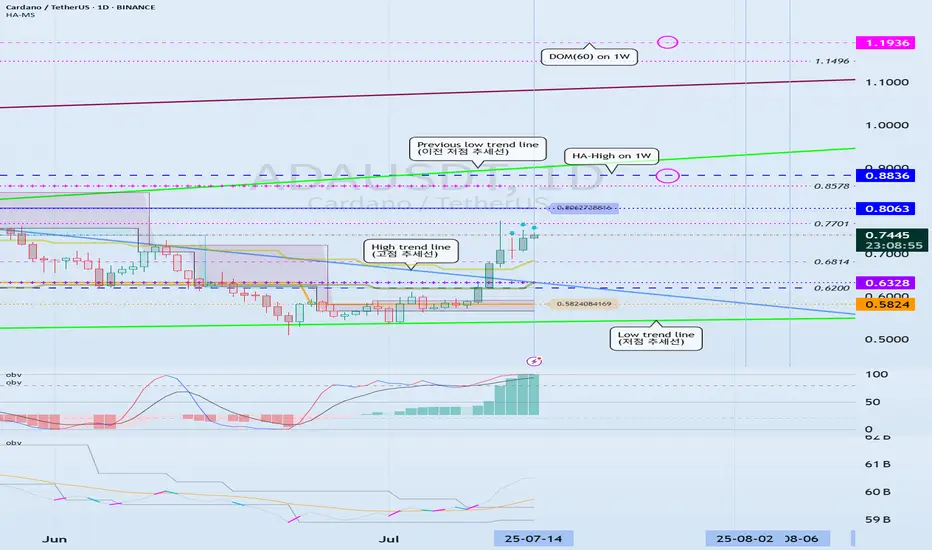
Can we break above the 0.8063-0.8836 range?
Hello, traders.
If you "Follow", you can always get the latest information quickly.
Have a nice day today.
-------------------------------------
(ADAEUSDT 1D chart)
ADA is forming a long-term rising channel and is showing an upward trend as it breaks above the mid-term high downtrend line.
We need to see if it can rise above 0.8836 and maintain the price to rise above the previous mid-term low trend line.
-
The DOM(60) indicator is showing signs of being newly created.
Accordingly, we need to see where the DOM(60) indicator is formed.
Since the HA-High indicator is formed at 0.8063, in order to continue the upward trend, it must rise at least above 0.8063 to maintain the price.
Accordingly, the key is whether the price can be maintained above 0.6328.
-
It is possible to show a mid- to long-term upward trend only if it breaks through the HA-High ~ DOM(60) section of the 1W chart upward.
Therefore, the 0.8836-1.1936 section is likely to be the resistance section.
-
Based on the current price position, the support section is the 0.5824-0.6328 section.
However, since the positions of the HA-Low indicator and the DOM(-60) indicator are switched, if it shows a downward trend, there is a possibility that a new HA-Low indicator will be created.
If a new HA-Low indicator is created, it is important to determine whether there is support near it.
-
Thank you for reading to the end.
I hope you have a successful trade.
--------------------------------------------------
- Here is an explanation of the big picture.
(3-year bull market, 1-year bear market pattern)
I will explain the details again when the bear market starts.
------------------------------------------------------
ADA Cardano To The UpsideADA Cardano has broken out of a bullish triangle pattern. Looking for a small pull back on the next weekly candle. Then long to the previous high.

ADA LONG TRADE ADA has broken out of its long-term wedge pattern and looks poised for a move higher. With such a strong risk-to-reward setup, the trade makes sense even without a large position—especially important given the uncertainty around current tariff discussions.

🐋 Deep Dive Part II: Whale Behavior & Market Mastery! 🌊📚Hey Crypto Enthusiasts! 🚀
In a recent analysis, I not only nailed Bitcoin's (BTC) movement but also illuminated the subsequent altcoin surge, driven by insightful whale behavior observations. Let's merge these insights with a focus on ADA (Cardano), OP (Optimism), SOL (Solana), and BTC. 📊
Cardano's (ADA) Meteoric Rise 🌟
ADA's journey began with a break above a pivotal support-resistance level. My entry point at 0.256 turned into a remarkable rally, hitting 52 cents. This movement was a classic case of altcoin buoyancy following Bitcoin's pause.
Optimism (OP) and the Altcoin Breakouts 🌈
In the shadow of Bitcoin's stagnation, altcoins like OP exhibited significant breakouts, showcasing the shifting focus of market whales from Bitcoin to promising altcoins.
Bitcoin (BTC) and Whale Dynamics 📉
Bitcoin's behavior provided a crystal ball into the whale activities. As BTC approached a major resistance level, it signaled a strategic move by whales to divert funds towards altcoins, catalyzing their surge.
Solana (SOL) and Market Trends ☀️
Solana's chart also mirrored this trend, highlighting the broader market dynamics influenced by these significant players.
🔍 Insight on Whale Behavior:
My analysis delved deep into the whale behavior, highlighting how Bitcoin's rally and subsequent pause was a precursor to altcoin dominance. This strategic pause in Bitcoin's ascent was a clear signal for the whales to redistribute their focus and capital, sparking a remarkable rise in altcoins like ADA, OP, and SOL. 🔄
The Bigger Picture - Understanding Market Shifts: What this trend teaches us is the importance of reading between the lines. Whale movements often precede major market shifts, and by understanding these patterns, we position ourselves to make informed decisions. 🧠
Future Outlook: As we continue to monitor these market dynamics, it's crucial to stay vigilant. The crypto market is known for its volatility, and while the current trend favors altcoins, it's essential to be prepared for any shifts that may arise. Always keep an eye on key resistance and support levels, market sentiment, and global economic factors that could influence the next big move. 🌐
Together, let's stay ahead of the curve in this fascinating and ever-evolving world of cryptocurrency. Your insights and engagement are what make this journey exciting and rewarding!
One Love,
The FXPROFESSOR 💙
part 1:

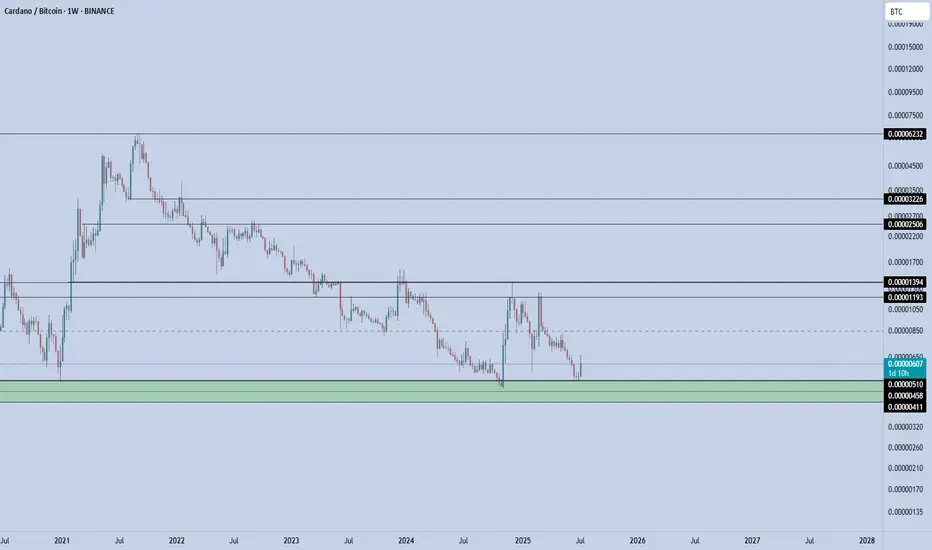
ADABTC – Long-Term Demand ZoneThe green box is a multi-year demand zone, tested multiple times, with each test producing strong upward moves.
Current structure aligns with previous cycle bottoms.
If BTC dominance stalls or rotates, alt/BTC pairs like ADA/BTC could rotate sharply upward.
📌 Risk Management:
A weekly close below 0.0000450 invalidates the long thesis. Until then, the risk-reward favors accumulation.
If market conditions align, ADA could be preparing for one of its classic ratio expansions — especially if Bitcoin cools and capital rotates into majors.
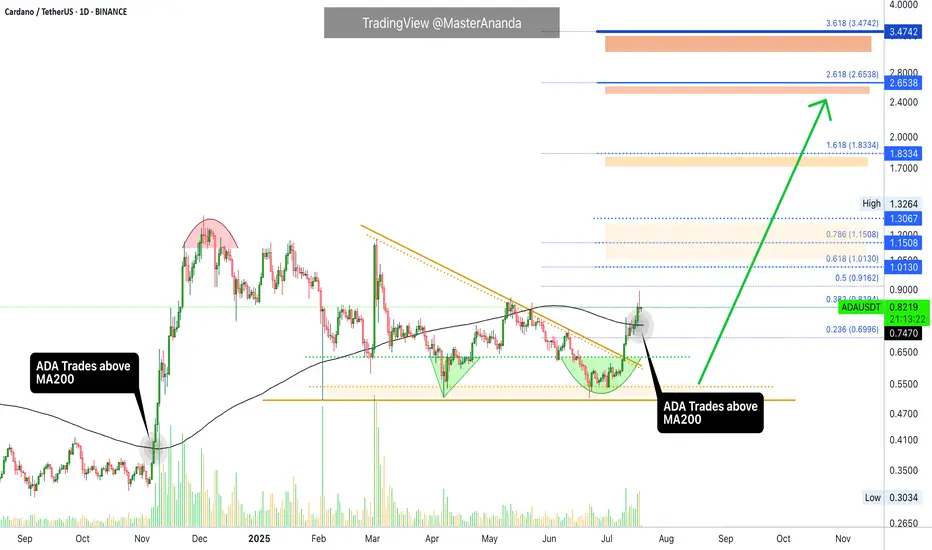
ADA Daily Update · Moving Averages · 262% Target ExposedGood morning my fellow Cryptocurrency trader, I know you are having a wonderful day because the market is doing great. We looked at Cardano together on the weekly timeframe and this is a big picture but what about short-term? Where are prices headed next? The next target, resistance/support and the moving averages of course.
I've been looking at the moving averages lately and this is a theme that I will continue for a few days, or weeks, once we exhaust it we use other indicators. You know we also like the RSI and MACD, candlestick reading, volume, chart structure, chart patterns, market cycle, etc. Marketwide action, subtle signals, market sentiment, on and on.
Cardano is already trading above many major moving averages but this is a recent event. First consider the fact that in late 2024 ADAUSDT grew 320% right after breaking above the same EMAs that I am showing you now.
ADA closed just recently above EMA89, EMA233, EMA55, etc. Only MA200 is missing and this is an important one but will soon break. I am not showing it here because the action is still happening below.
There is a rounded bottom. This alone is a reversal signal already confirmed because the action is happening above the base of the pattern. In April we had a triangular bottom and here we can see an alternation. In February it was a straight line. A straight line, a triangle and then a circle; interesting.
The bullish bias is confirmed and we are seeing straight up, the next target is 0.8194. Cardano has been green four days straight. Go back to November 2024... The possibility exist for continued growth. Day after day after day. At some point there will be a stop, can be a retrace or correction. Know that when this stop happens it is not the end. There will be several stops along the way but we are set for a strong new all-time high. You will need to be patient while holding but just make sure to aim high. Don't get greedy of course. If at some point you start to feel anxious, read on the topic, go out into nature or simple sell a small portion until you feel better. The best choice is to be prepared and this can be done by studying the charts and the market. If you have a good plan and a nice map you will do fine. If you are an advanced trader, I am sorry, let's get back to the chart.
$1.01, $1.30, $1.15. These are all resistance. So there will be some challenge around this price zone. Once it is conquered though the advance should be swift until 1.83. Another stop and then 2.65 which is the main target for 262%. Depending on how this level is handled we will update the chart and the targets. For higher targets look at earlier analyses or those on the weekly timeframe.
Thank you for reading.
Namaste.

Cardano Forming Potential Reversal Structure Inside TriangleHello guys!
Cardano’s been stuck inside this big descending triangle for months. We had a fake breakout a while back that totally failed.
Now, price is back at support and showing bullish divergence. That’s usually a sign sellers are getting tired.
If buyers step in here, I’m expecting a move back up toward 0.67–0.70 (top of the triangle). But if it loses the 0.53 support, that setup’s off the table.
Bias: Leaning bullish
🎯 Target: 0.67–0.70
Invalidation: Clean break below 0.53
Let’s see how this plays out.

ADA/USDT : ADA Rally in Motion – Over 20% Gain and More to Come?By analyzing the Cardano (ADA) chart on the 3-day timeframe, we can see that after revisiting the $0.57 zone, the price once again followed the previous analysis and encountered strong buying pressure—rallying up to $0.61 so far.
The return from the previous entry has now exceeded 8%, and the overall gain from the full move stands above 20%.
The next bullish targets are $0.76, $0.93, $1.05, and $1.33.
(A deeper and more detailed analysis is recommended for long-term investment decisions.)
THE MAIN ANALYSIS :

Cardano Ultra Bullish Confirmed, $1.83 Next (Easy) TargetThis is it. This is the signal you've been waiting for and the strongest possible signal across the Cryptocurrency market. Cardano is now moving above MA200 on the weekly timeframe, on a full green candle, as Bitcoin produces a very strong new all-time high. Simply put, this is the best ever.
Cardano has been testing the same low since early February, for five months. Five months and this support held nicely and now the action is turning green. The correction is over; consolidation is over, now comes the resumption of the bullish wave.
The bullish wave will produce a major, major, higher high compared to early December 2024, a target of $1.83 in the coming months and this is not all. This is not the end of the bull market nor the bullish wave, this is just the start, mid-portion, we are set to experience growth long-term.
You can go all-in now. The altcoins bull market is already confirmed. Bullish momentum will start to grow. Feel free to buy and hold.
Thanks a lot for your continued support.
Namaste.

Could Cardano become a crypto unicorn?And make a 3rd new all time high in subsequent cycles.
One fib extension certainly suggests that is possible pointing towards around $4.80
Let's see ... things can mover very fast during altseason.

Cardano: Eyeing Alternative Rally ScenarioCardano’s ADA token has realized further gains. As a result, we’ve increased the probability of our alternative scenario—in which the low of the wave (ii) correction is already in place—to 40%. For ADA to take this “shortcut,” the next step would be to break above resistance at $0.86, followed by a move past the $1.32 level. For now, however, we’re maintaining our primary outlook and are preparing for a new low in blue wave (ii). In this scenario, the price should hold above support at $0.31.
📈 Over 190 precise analyses, clear entry points, and defined Target Zones - that's what we do.
