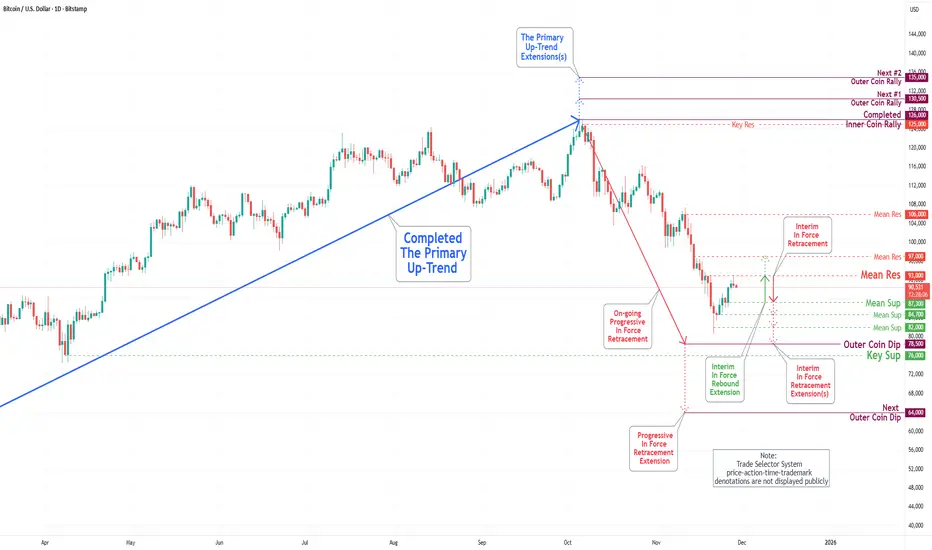
Bitcoin(BTC/USD) Daily Chart Analysis For Week of Jan 2, 2026Technical Analysis and Outlook:
In this New Year's trading week, the Bitcoin market has climbed towards the upper end of our Active Inner Trading Zone (See Daily Chart Analysis For Week of Dec 26, 2025). This breakout from his progressive zone will be met by Mean Resistance at 93,500.
Given the prevailing dynamics in the cryptocurrency market, it is recommended that traders diligently monitor this price movement, as significant momentum is pushing prices toward the Interim Inner Coin Rally at 98,000 and the possibility of advancing to a subsequent Interim Coin Rally at 102,500.
On the downside, the principal target, identified for some time, is the Outer Coin Dip at 78,500, which might be realized once the Mean Resistance 93,500 is hit, along with the Interim Coin Rally at 102,500.
Macroeconomic Analysis And Trading Ideas

The vertical rise of Gold.In the mid-seventies Gold made a top and a bottom, from which we measure using a fibonacci extension tool.
Of special interest are the 2.272, 3.272 and 4.272 levels. Those give us a glimpse into the possible future, at which levels Gold might top out.
Since 2022 major Central Banks have been going on a Gold shopping spree, the once described barabrous relic seems to be a very coveted commodity, and it makes sense.
When everything becomes digital, virtual and ephemere, hard assets save the day.
Do you see 15K happening ?

Bitcoin(BTC/USD) Daily Chart Analysis For Week of Dec 26, 2025Technical Analysis and Outlook:
The Bitcoin market has traded within a narrow range in the Active Inner Trading Zone during the current holiday season. This progressive zone is characterized by a Mean Resistance level of 90,500 and a Mean Support level of 84,500.
Given the prevailing dynamics in the cryptocurrency market, it is recommended that traders diligently monitor price movements in this Active Trading Zone. A breakout on the upside from this range may lead to vital targets, including an Interim Inner Coin Rally at 98,000, and a subsequent Interim Coin Rally at 102,500. However, it is important to acknowledge that these targets will encounter resistance at the Mean Resistance level of 93,500 before being attained.
On the downside, the principal target, identified for some time, is the Outer Coin Dip at 78,500. This target will be supported by significant backing from the Mean Support level of 82,500, which is situated below the Active Trading Zone’s Mean Support level of 84,500.

Forget the Textbook: A 30-Year Reality CheckA Big Policy Moment
A central bank (BOJ) just pushed interest rates to levels not seen in 30 years.
That’s not a routine tweak — that’s a regime shift.
Textbooks might suggest a clean, logical market response.
Reality? Markets got emotional. Fast.
Selling Got Loud
Instead of an orderly adjustment, selling pressure exploded.
Not just “price going down,” but effort going through the roof.
That’s where Volume Delta comes in — the net difference between buying and selling volume. It tells us who is pressing the gas pedal.
And in this case, sellers floored it.
When an Indicator Starts Yelling
Now here’s the interesting part.
Bollinger Bands weren’t applied to price…
They were applied to Volume Delta itself.
Result?
Volume Delta plunged far below its lower Bollinger Band.
That’s not normal selling.
That’s everyone trying to get out at the same time.
Does that mean price must reverse?
Nope. But it does suggest selling is becoming inefficient.
No Safety Net Below
Here’s the catch.
There are no meaningful UFO supports (UnFilled Orders) below current price.
No obvious institutional “safety net.”
Instead, only two old technical floors remain:
0.0063330
0.0062415
Think of them as floors, not trampolines. Price may react… or punch straight through.
Reaction Beats Guessing
This is where patience matters.
Extreme selling doesn’t mean “buy now.”
It means watch closely.
At those levels, traders are looking for:
Selling pressure slowing down
Price stabilizing
Daily closes showing acceptance or rejection
No assumptions. Only reactions.
Don’t Forget the Ceiling
Even if price bounces, there’s a ceiling waiting above.
A clear sell-side UFO resistance sits near 0.0065640.
That’s leftover supply — the kind that often stops rallies in their tracks.
So any upside move?
Treat it as corrective until structure says otherwise.
Contract Specs
This analysis uses both standard and micro futures to illustrate scalable risk. Japanese Yen Futures (6J) have a tick size of 0.0000005 with a $6.25 tick value and currently require roughly ~$2,800 in margin per contract, while Micro JPY/USD Futures (MJY) use a 0.000001 tick size with a $1.25 tick value and margin closer to ~$280. Margin requirements vary by market conditions and broker policies, and micro contracts can be especially useful when volatility expands following major macro events.
The Big Takeaway
Historic policy decisions don’t end stories — they start messy chapters.
Extreme Volume Delta shows stress, not certainty.
Structure decides what comes next.
When markets digest big shocks, the edge doesn’t come from predicting —
It comes from staying disciplined while everyone else reacts.
Want More Depth?
If you’d like to go deeper into the building blocks of trading, check out our From Mystery to Mastery trilogy, three cornerstone articles that complement this one:
🔗 From Mystery to Mastery: Trading Essentials
🔗 From Mystery to Mastery: Futures Explained
🔗 From Mystery to Mastery: Options Explained
When charting futures, the data provided could be delayed. Traders working with the ticker symbols discussed in this idea may prefer to use CME Group real-time data plan on TradingView: www.tradingview.com - This consideration is particularly important for shorter-term traders, whereas it may be less critical for those focused on longer-term trading strategies.
General Disclaimer:
The trade ideas presented herein are solely for illustrative purposes forming a part of a case study intended to demonstrate key principles in risk management within the context of the specific market scenarios discussed. These ideas are not to be interpreted as investment recommendations or financial advice. They do not endorse or promote any specific trading strategies, financial products, or services. The information provided is based on data believed to be reliable; however, its accuracy or completeness cannot be guaranteed. Trading in financial markets involves risks, including the potential loss of principal. Each individual should conduct their own research and consult with professional financial advisors before making any investment decisions. The author or publisher of this content bears no responsibility for any actions taken based on the information provided or for any resultant financial or other losses.

GBP/AUD Forecast: Strategic Divergence & Market ShiftsStrategic Outlook: The Sterling Breakout
The Pound Sterling (GBP) has established a dominant position against the Australian Dollar (AUD) as 2025 closes. This shift represents a fundamental divergence in national economic strategies, not merely market fluctuation. The Bank of England (BoE) executed a "hawkish cut" to 3.75% in December, signaling long-term stability. In contrast, the Reserve Bank of Australia (RBA) remains paralyzed at 3.60% due to persistent inflation. This analysis dissects the geopolitical, technological, and industrial forces driving this volatility.
Macroeconomics: The Central Bank Divergence
The core driver of the GBP/AUD rally lies in contrasting monetary policies. The BoE managed a delicate pivot in December. By cutting rates while warning of inflation, they maintained yield appeal. Markets interpreted this decisiveness as strength, bolstering the Pound. Conversely, the RBA faces a credibility crisis. Australian CPI remains stubbornly high at 3.8%. Yet, the RBA held rates steady, fearing a mortgage cliff. This hesitation signals weakness. The "yield advantage" now firmly favors London over Sydney.
Geopolitics & Geostrategy: Risk Aversion Protocols
Global instability disproportionately harms the Australian Dollar. As a "risk-proxy" currency, the AUD suffers when tensions rise in the Indo-Pacific or Eastern Europe. Investors flee to safe havens or deeper liquidity pools like the GBP. Furthermore, the UK-Australia Free Trade Agreement has matured. While removing tariffs, it exposed Australia’s reliance on raw commodity exports. The UK’s pivot to high-value service exports insulates it better from supply chain disruptions. This structural imbalance currently weighs heavily on the Aussie.
Industry Trends: Services vs. Commodities
The UK economy is evolving faster than its Australian counterpart. Recent data indicates UK Intellectual Property (IP) investment surged by 15%. Britain is successfully transitioning to a high-value "intangible economy." Australia remains tethered to the "rocks and crops" model. While critical minerals are vital, global demand for lithium and iron ore has softened. This cyclical downturn in commodities drags the AUD down. The UK’s service-based resilience offers a more stable platform for currency appreciation.
Technology & Cyber: The Digital Trade Surplus
A hidden driver of Sterling's strength is the UK's dominance in digital services. Britain’s tech sector is leveraging AI to boost productivity. This export of digital solutions creates a "capital account surplus" that supports the GBP. In contrast, Australia faces a "cyber-sovereignty" challenge. As it digitizes mining operations, cybersecurity costs are rising. This increases operational overheads for major Australian firms. Consequently, foreign capital flows are hesitant, preferring the mature tech ecosystem of the UK.
Patent Analysis: The Innovation Gap
Patent filings reveal the future trajectory of these economies. UK firms are filing aggressively in fintech and biotech. This signals future revenue streams protected by global law. Australian innovation remains heavily concentrated in mining technology. While valuable, it is sector-specific. The lack of economic diversity in Australian patent data suggests a rigid business model. Investors prefer the diversified innovation portfolio of the UK, adding a premium to the Pound.
Leadership & Governance: Corporate Resilience
UK corporate leadership has adapted well to the "higher-for-longer" rate environment. FTSE 100 companies have successfully deleveraged balance sheets. This financial prudence attracts institutional investors. Australian management teams face different pressures. The heavy reliance on variable-rate borrowing in Australia squeezes cash flow. Business confidence in Sydney has dipped as leaders brace for potential rate hikes in 2026. This pessimistic corporate sentiment bleeds directly into the currency valuation.
Forecast: The Path to 2026
The immediate outlook for GBP/AUD remains bullish. The pair is likely to test new highs as liquidity thins over the holiday period. Traders should watch for signals of a pause in BoE cuts and critical Q4 inflation data from the RBA. The structural advantages of the UK economy currently outweigh the commodity potential of Australia. Position for continued GBP strength into Q1 2026.

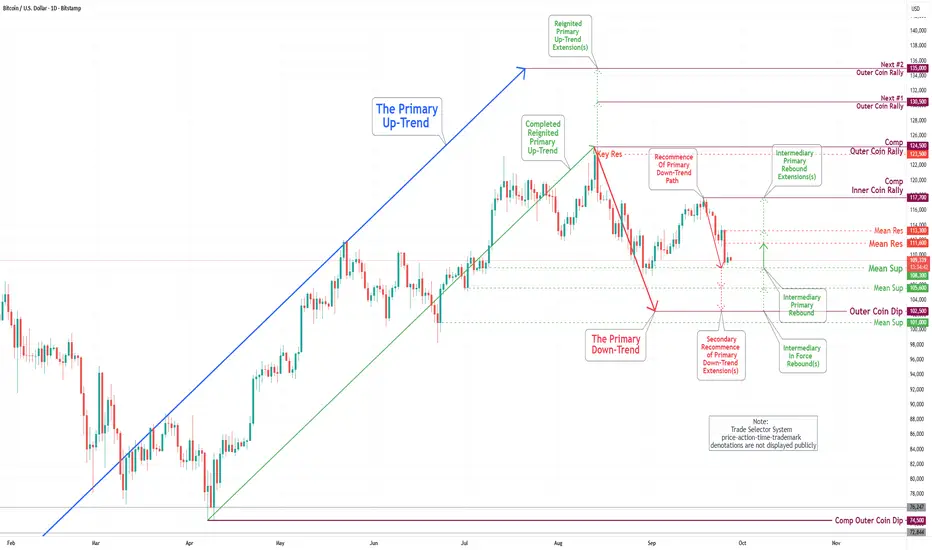
Bitcoin(BTC/USD) Daily Chart Analysis For Week of Dec 19, 2025Technical Analysis and Outlook:
The Bitcoin market in this week's trading session continued to trade within an Active Inner Trading Zone defined by the Mean Resistance level at 93,500 and the Mean Support level at 89,300.
Given the current dynamics of the cryptocurrency market, it is advisable for traders to monitor price action in this Active Trading Zone closely. A breakout may lead to additional targets, including an Interim Inner Coin Rally at 98,000 and a subsequent Interim Coin Rally at 102,500. Conversely, on the downside, the established Mean Support levels are situated at 84,700 and 82,500, with the prospect of an Outer Coin Dip occurring at 78,500.

Bitcoin(BTC/USD) Daily Chart Analysis For Week of Dec 12, 2025Technical Analysis and Outlook:
During the most recent trading session, the Bitcoin market navigated within a channel defined by the Mean Resistance level at 93,500 and the Mean Support level at 89,300.
Current market sentiment suggests an upward move, with price action pointing to a retest of the Mean Resistance level at 93,500. Additional targets include the Interim Inner Coin Rally at 98,000 and a subsequent, significant objective: the next Interim Coin Rally at 102,500.
Given the prevailing dynamics of the cryptocurrency market, there exists a potential for an intermediate pullback to the Mean Support level of 89,300. This pullback could extend to further Mean Support levels at 86,400 and 82,400, ultimately culminating in the anticipated Outer Coin Dip at 78,500 before a notable upward momentum is expected to occur.

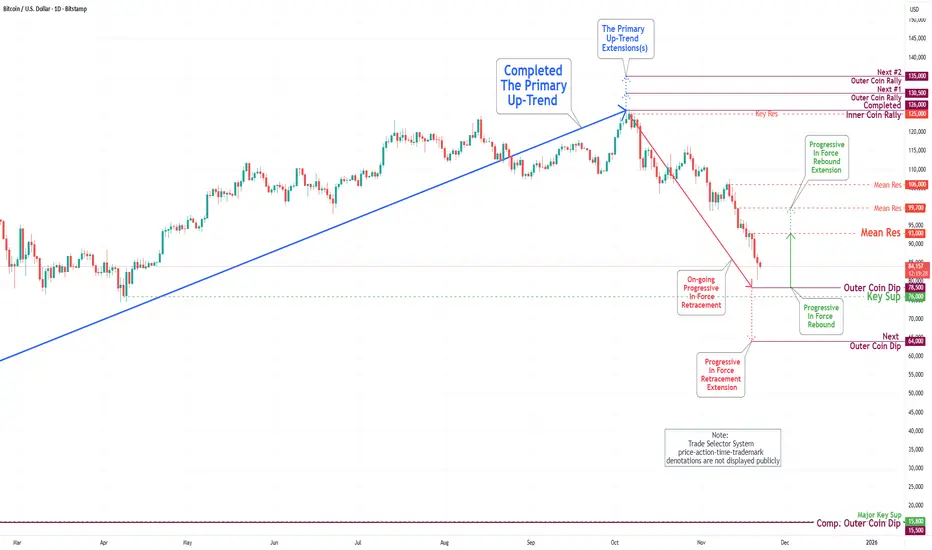
Bitcoin(BTC/USD) Daily Chart Analysis For Week of Dec 5, 2025Technical Analysis and Outlook:
In the most recent trading session, the Bitcoin market experienced a Pump-and-Dump scenario and continued the downward trend observed over the past week. The price has reached the Mean Resistance level of 93,500.
Market sentiment is declining, with current price action focusing on identifying the Mean Support level at 88,000. Additional support is identified at 84,500, with a further significant drop possible to the Outer Coin Dip at 78,500.
Given the current dynamics of the crypto market, there is potential for an intermediate rebound from the Mean Support level of 88,000 back up to the Mean Resistance level of 93,500. Furthermore, an external extension may target the Interm Inner Coin Rally at 98,000.

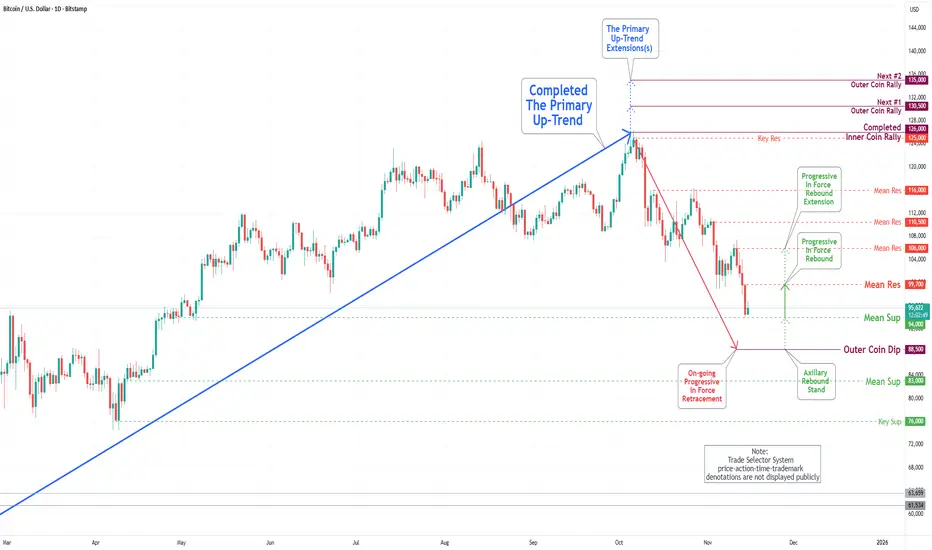
Bitcoin(BTC/USD) Daily Chart Analysis For Week of Nov 28, 2025Technical Analysis and Outlook:
During the most recent trading session, the Bitcoin market exhibited a resilient rebound, continuing a trend observed over the past week. The price has reached the Mean Resistance level of 93,000.
Market sentiment is in declining mode, and the price is likely to trend toward the Mean Support level at 87,300. Current trading activities are focused on identifying the next Outer Coin Dip, projected at 78,500, with additional obstacle support at the Mean Support levels of 84,700.
Given the prevailing trading dynamics, there is potential for an intermediate rebound from the Mean Support level of 87,300 to the Mean Resistance level of 93,000. Furthermore, an external extension may occur as the cryptocurrency market continues to fluctuate in line with current shaky market sentiment. Notably, it is essential to acknowledge the potential for a significant rebound once the Outer Coin Dip target of 88,500 is achieved.
Bitcoin(BTC/USD) Daily Chart Analysis For Week of Nov 21, 2025Technical Analysis and Outlook:
In the last trading session, the Bitcoin market experienced a substantial drawdown, continuing a trend observed over the past week. The price has reached the Outer Coin Dip at 88,500. In light of these difficulties, the price has subsequently declined to the Mean Support level at 83,000, while trading activity is now focused on identifying the next Outer Coin Dip at 78,500. Notably, the price has remained below the upper boundary of the Mean Resistance at 93,000. Considering the current trading dynamics, a potential intermediate rebound towards this resistance level appears plausible. However, it is essential to recognize the possibility of a considerable rebound occurring once the Outer Coin Dip target of 88,500 is attained.
Hungary's Interest Rate Decision: The Fight Against InflationThe National Bank of Hungary (NBH) is expected to maintain the European Union's highest key interest rate, currently at 6.5% , for the 14th consecutive month. This decision underscores the NBH's commitment to prioritizing financial stability and currency support over stimulating immediate economic growth. Keeping the rate high is the primary tool policymakers use to manage above-target inflation and anchor the Forint (HUF) .
Monetary Policy and Inflation Focus
The decision to hold the benchmark rate at 6.5% aligns with the consensus of financial experts, reflecting a cautious, tight monetary policy. This high rate makes borrowing expensive, curbing demand and consequently helping to cool inflation , which stood at 4.3% annually in October. This figure remains outside the central bank's targeted 3% range (with a 1% tolerance band). The NBH maintains this stance despite political pressure from Prime Minister Viktor Orban, who advocates for rate cuts to boost faltering economic performance. Governor Mihaly Varga's focus on price stability confirms the central bank's independence in prioritizing its core mandate.
Currency Strength and Market Implications
The sustained high rate is a significant factor in the strength of the forint. The substantial rate premium attracts foreign investors engaging in carry trades , where they borrow in a low-interest-rate currency (like the Euro) and invest in the high-yielding forint. This demand has led to the forint gaining over 7% against the Euro year-to-date. For bond markets, the high rate environment is challenging; the yield on the 10-year government forint bond recently climbed past 7%, reflecting increased risk related to pre-election spending and loosened fiscal targets. Money market forward rate agreements indicate that investors don't anticipate a rate reduction before the next elections in April.
Political and Geopolitical Backdrop
Political dynamics also influence market sentiment. The government's recent pre-election fiscal loosening has constrained the central bank's room for maneuver, adding risks to the country's economic stability. In a move to shield Hungarian assets, Prime Minister Orban claimed to have secured an undisclosed US financial backstop to protect the currency and bond markets following a meeting with President Donald Trump. While the US government has not confirmed this arrangement, the statement reflects the government's concern about maintaining market confidence. This geopolitical angle adds a layer of complexity for investors monitoring the Hungarian market.

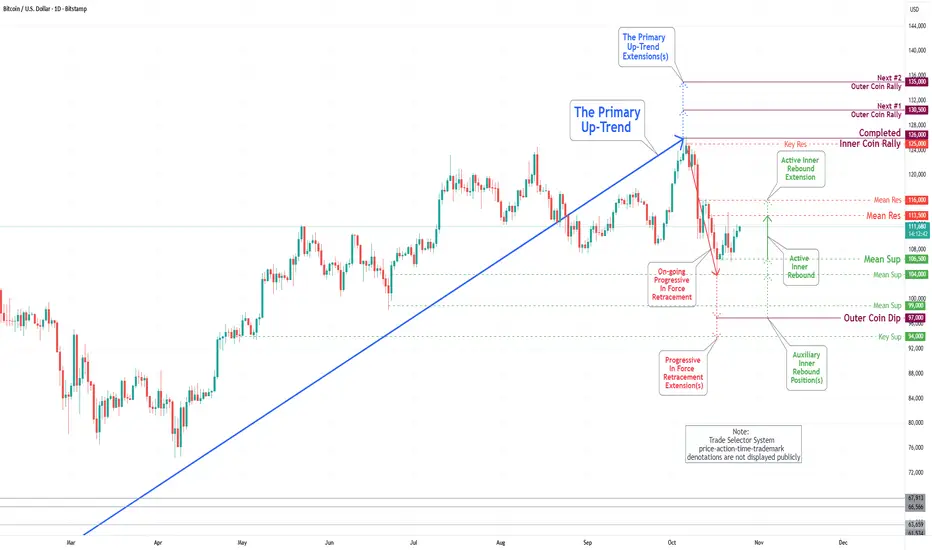
Bitcoin(BTC/USD) Daily Chart Analysis For Week of Nov 14, 2025Technical Analysis and Outlook:
In the most recent trading session, the Bitcoin market has undergone a significant drawdown over the past week, reaching the Mean Support level of 99,000. Additionally, it has completed the Outer Coin Dip at 97,000. Compounding these challenges, the price has also declined to the Key Support level of 94,000, where trading activity is currently concentrated.
At this time, the price is being maintained within a trading range defined by the Mean Resistance at 99,700 and the Mean Support (Former Key Support) at 94,000, with a slight probability of an extension to the Mean Support level at 106,000. Nonetheless, it is crucial to acknowledge the considerable potential for pullbacks at these critical resistance levels.
Bitcoin(BTC/USD) Daily Chart Analysis For Week of Nov 7, 2025Technical Analysis and Outlook:
In the previous trading session, the Bitcoin market experienced a notable drawdown over the past week, with the Mean Support established at 101,000, around which trading activity was concentrated. Presently, the price is actively maintained within the range defined by the Mean Resistance at 107,000 and the Mean Support at 97,000.
Current market analysis suggests the likelihood of a retest toward the Mean Support level at 99,000, with a primary emphasis on the potential for further downward movement toward the Outer Coin Dip at 97,000, which may extend to the Key Support level at 94,000. Nonetheless, it is vital to recognize the substantial rebound potential present at these critical levels.
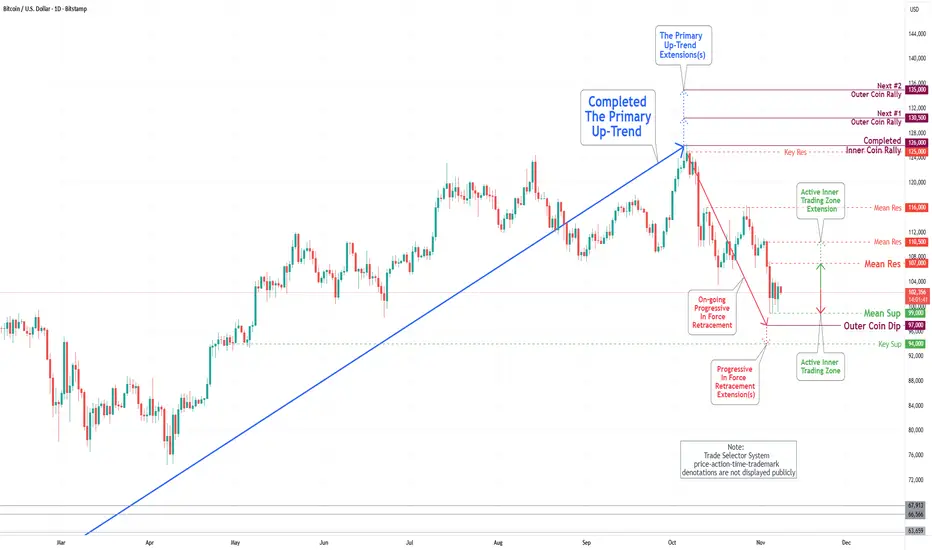
Bitcoin(BTC/USD) Daily Chart Analysis For Week of Oct 31, 2025Technical Analysis and Outlook:
The trading session from last week was notably eventful. The Bitcoin market experienced significant volatility, fluctuating between the Mean Resistance level of 116,000 and the critical Mean Support level of 106,500. Currently, the price is actively navigating this range.
Current market analysis indicates a likelihood of a retest toward the Mean Support level at 106,500, with a primary focus on the potential for further downward movement towards the Mean Support level of 101,000. This trajectory may ultimately lead to our key objective of reaching the Outer Coin Dip at 97,000. It is, however, essential to acknowledge the robust rebound potential at these pivotal levels.

Hot CPI Kills Hopes of an RBA CutAustralia's Q3 inflation figures have just dropped, and all surprised to the upside. Not only does this kill hopes of a cut next week — and likely for the rest of the year — but it also suggests the RBA may have already reached the terminal rate of this cutting cycle. I take a quick look at the figures, AUD/USD, and the ASX 200.
Matt Simpson, Market Analyst at City Index and Forex.com.

Bitcoin(BTC/USD) Daily Chart Analysis For Week of Oct 24, 2025Technical Analysis and Outlook:
In last week's trading session, the Bitcoin market experienced wild gyrations between Mean Support 106500 and the critical Mean Resistance level of 113500, as the price is currently actively fluctuating between the two.
Current market analysis indicates an initial recovery towards the Mean Resistance level of 113500, with the potential for further upward movement to the Mean Resistance level of 116000. However, it is crucial to acknowledge the possibility of a reversal at these resistance levels, which could extend to continue the Progressive In Force Retracement trend.
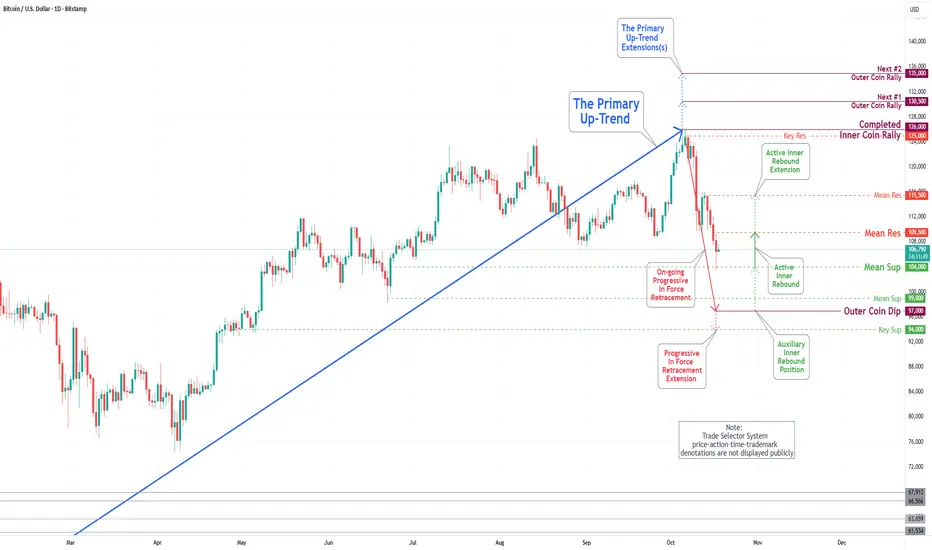
Bitcoin(BTC/USD) Daily Chart Analysis For Week of Oct 17, 2025Technical Analysis and Outlook:
In the most recent trading session, the Bitcoin market experienced a significant decline, falling below critical support levels of 108000 and 105700, as the price is currently actively fluctuating between these two points.
The current market analysis indicates an initial potential rebound towards the Mean Resistance level of 109500, with further extension possibilities up to the Mean Resistance level of 115500. It is essential to recognize and be aware that an Auxiliary Inner Rebound occurrence following the Outer Coin Dip, marked as a 97000, in conjunction with the Mean Support level of 99000. This scenario is particularly significant at the Progressive In-Force retracement extension, identified as the Key Support level of 94000.
Impact of Central Bank Policies on Global Indices1. Interest Rate Decisions and Stock Market Valuations
One of the most direct ways central banks affect global indices is through interest rate policy. When a central bank such as the U.S. Federal Reserve, European Central Bank (ECB), or Bank of Japan changes benchmark interest rates, it impacts corporate profitability and investor sentiment.
Rate cuts make borrowing cheaper, stimulating business expansion and consumer spending. This boosts earnings expectations, leading to higher stock prices and rising indices such as the S&P 500 or FTSE 100.
Rate hikes, on the other hand, increase borrowing costs, reduce spending, and pressure profit margins, leading to a bearish sentiment across global markets.
Thus, the direction of central bank rates often sets the tone for short- to medium-term movements in global indices.
2. Quantitative Easing (QE) and Liquidity Injection
During economic downturns, central banks often implement Quantitative Easing (QE)—the purchase of government and corporate bonds to inject liquidity into the financial system.
This policy increases the money supply, lowers long-term interest rates, and encourages investment in riskier assets like equities.
For example, the Federal Reserve’s QE programs after the 2008 financial crisis and during the COVID-19 pandemic led to massive rallies in global indices such as the NASDAQ, Dow Jones, and MSCI World Index.
Increased liquidity often pushes investors toward stocks, resulting in higher valuations and stronger index performance globally.
3. Tapering and Liquidity Withdrawal
Conversely, when central banks begin tapering QE or reducing asset purchases, it signals a tightening monetary stance. Markets perceive this as a withdrawal of easy money, often leading to volatility.
The “Taper Tantrum” of 2013, when the Federal Reserve hinted at slowing its bond purchases, caused global bond yields to spike and emerging market indices to decline sharply.
Tapering reduces the availability of cheap capital, which can deflate overvalued markets and cause corrections across global indices.
4. Currency Exchange Rate Impacts
Central bank actions significantly influence foreign exchange rates, which in turn affect multinational companies and stock market indices.
For instance, a strong U.S. dollar resulting from higher Federal Reserve interest rates can hurt U.S. exporters, leading to declines in indices such as the Dow Jones and S&P 500.
Conversely, a weaker yen due to the Bank of Japan’s accommodative policy benefits Japanese exporters, pushing the Nikkei 225 higher.
Exchange rate movements impact global trade competitiveness, profits, and valuations—key factors in index performance.
5. Inflation Control and Market Stability
A central bank’s mandate often includes maintaining price stability. When inflation rises beyond targets, banks respond by tightening policy (raising rates or reducing liquidity).
High inflation reduces purchasing power and increases input costs for companies, which negatively impacts profit margins and stock valuations.
For example, aggressive rate hikes by the Federal Reserve in 2022–2023 to combat inflation led to declines in major indices like the NASDAQ Composite and S&P 500.
Conversely, successful inflation management fosters confidence, encouraging investors to re-enter equity markets.
Thus, inflation control directly affects both short-term volatility and long-term market stability.
6. Impact on Bond Yields and Equity Valuation Models
Central bank policy decisions influence bond yields, which are critical to equity valuation models.
When central banks lower rates, bond yields fall, and the discount rate used in valuing future corporate earnings decreases. This leads to higher present values of future cash flows, making equities appear more attractive.
In contrast, rising yields due to policy tightening make bonds more competitive with stocks, often prompting a rotation from equities to fixed income.
This dynamic is visible across global indices, where valuation multiples (like P/E ratios) expand or contract depending on central bank yield policies.
7. Investor Sentiment and Global Risk Appetite
Central bank communication—through forward guidance and policy statements—greatly influences investor sentiment and global risk appetite.
Dovish statements (indicating a preference for low rates and economic support) often boost investor confidence and lead to index rallies.
Hawkish tones (signaling tightening or rate hikes) can trigger sell-offs as investors anticipate slower growth.
Markets often react more to the tone and outlook of central bank meetings than to the actual rate changes. The Federal Reserve’s or ECB’s policy stance thus sets the mood for global equity performance.
8. Global Spillover Effects and Policy Synchronization
In today’s interconnected world, central bank actions have global spillover effects.
For instance, when the U.S. Federal Reserve raises rates, capital often flows from emerging markets to the U.S. in search of higher returns. This leads to depreciation of emerging market currencies and declines in their stock indices.
On the other hand, synchronized easing policies—as seen during the 2020 pandemic—can drive global liquidity surges and push indices across continents to record highs.
Thus, the coordination (or lack thereof) among major central banks—Fed, ECB, BoJ, and PBoC—affects not just domestic markets but global equity trends.
9. Sectoral Impacts within Indices
Central bank policies impact different sectors of an economy unevenly, influencing the composition of index performance.
Financial sector stocks (banks and insurers) generally benefit from higher interest rates as they improve lending margins.
Technology and growth stocks, however, tend to perform better in low-rate environments where borrowing is cheap and future growth is highly valued.
Therefore, changes in monetary policy can shift the leadership within global indices, with cyclical or defensive sectors taking turns depending on policy stance.
10. Long-Term Structural Implications
Finally, central bank policies have long-term structural effects on market valuation, risk perception, and investor behavior.
Prolonged periods of ultra-low interest rates can lead to asset bubbles, excessive leverage, and distortions in capital allocation.
On the other hand, consistent and transparent policy frameworks strengthen financial stability, foster sustainable growth, and create confidence in long-term investments.
For example, the credibility of the U.S. Federal Reserve’s inflation targeting has historically anchored investor trust, supporting steady growth in indices like the S&P 500 over decades.
Thus, beyond short-term volatility, central bank credibility shapes the very foundation of global financial markets.
Conclusion
The impact of central bank policies on global indices is profound and multifaceted. From influencing interest rates and liquidity to shaping investor psychology and cross-border capital flows, central banks are the key architects of modern financial stability. Their actions ripple through bond, currency, and equity markets—driving both short-term volatility and long-term trends.
Ultimately, understanding central bank policy decisions is essential for investors, traders, and analysts seeking to interpret the movement of global indices. In an interconnected global economy, the pulse of equity markets beats in rhythm with central bank policy shifts—making monetary policy one of the most powerful forces in global finance.

Bitcoin(BTC/USD) Daily Chart Analysis For Week of Oct 10, 2025Technical Analysis and Outlook:
During the most recent trading session, the Bitcoin market experienced a notable decline, falling below significant support levels of 120000, 117500, and 114000, respectively. Current market analysis indicates an initial potential retracement toward the Mean Support level of 108000, with further extension possibilities to the Mean Support level of 105700 and the Key Support level of 100000. It is crucial to acknowledge that intermediary rebounds may occur at these defined levels, particularly at the Mean Resistance level of 113000.
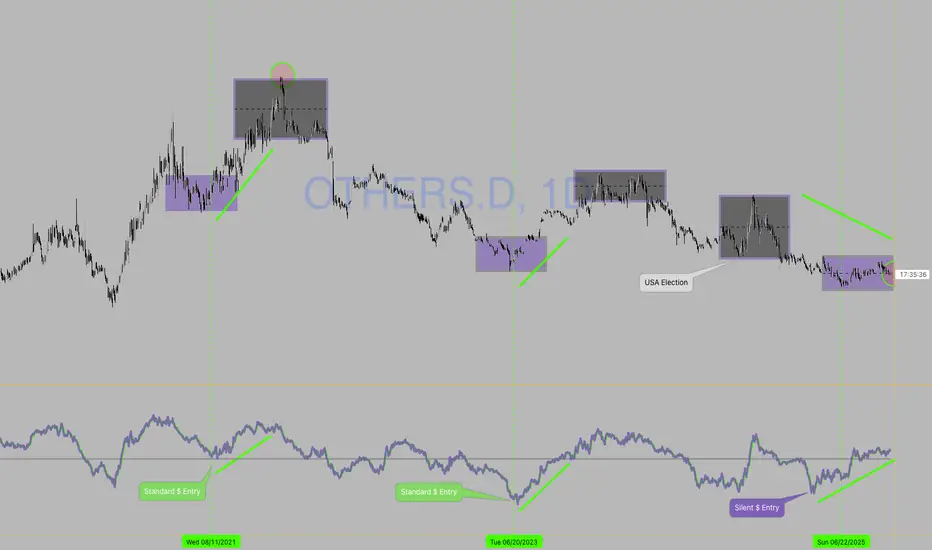
Macro Alert: The Stealth Flight 2 Alts (Tariffs, Gold & Privacy)🚨 MACRO ALERT: The Silent Surge — Altcoins Accumulating Undetected Since April
Chart: CRYPTOCAP:OTHERS.D
━━━━━━━━━━━━━━━━━━━━━━━━━━━━━━━━━━━━━━━━
📊 The Setup
While the mainstream remains fixated on Bitcoin's swings, a quiet but significant capital rotation into altcoins is underway. This move, largely undetected by the broader market, is being fueled by shifting global macroeconomic tides and a growing institutional hunt for wealth preservation and financial privacy .
━━━━━━━━━━━━━━━━━━━━━━━━━━━━━━━━━━━━━━━━
🔴 THE CRISIS: Multiple System Failures Converging
🏦 BIS Warning: Global Liquidity Crisis
↓
🇯🇵 Japan: Unsustainable debt from fiscal stimulus
🇫🇷 France: 0.6% growth in 2025, economic stagnation
↓
💸 Coordinated failure of fiat monetary policy
⛓️ Government Attacks on Safe Havens
↓
🇺🇸 U.S. Gold Tariffs: 39% on major imports
Physical metals face capital controls & taxation attacks
Traditional assets no longer safe from state control
🔒 Even Crypto Has Centralization Issues
↓
📜 GENIUS Act: Stablecoins expand M2 money supply (monetizing debt via blockchain)
🏢 XRP: Concentrated token control raises manipulation concerns
━━━━━━━━━━━━━━━━━━━━━━━━━━━━━━━━━━━━━━━━
🟢 THE SOLUTION: Where Capital Is Flowing
Smart money is seeking assets with:
• TRUE decentralization
• Privacy features
• Fixed supply
• Institutional-grade infrastructure
The Data Confirms It:
🔐 Privacy Coins (XMR, ZEC): +71.6% in 2025
📊 CRYPTOCAP:BTC: +27.1%
📊 CRYPTOCAP:ETH: +33.4%
📈 OTHERS.D: Rising quietly
This is sophisticated money moving in, not retail FOMO.
━━━━━━━━━━━━━━━━━━━━━━━━━━━━━━━━━━━━━━━━
💥 The Macro Catalyst: Why This Is Happening Now
⚡ Gold Under Attack: The recent 39% U.S. tariff on major gold imports has rattled the traditional safe-haven market, creating artificial scarcity and signaling a broader trend of government control over monetary assets . When even physical metals face intervention, capital seeks alternatives outside increasingly controlled systems.
🚨 The BIS Warning Nobody Is Discussing:
The Bank for International Settlements is quietly sounding alarms on global liquidity risks:
• 🇯🇵 Japan's fiscal stimulus → unsustainable debt levels
• 🇫🇷 France → 0.6% growth (stagnation)
• 💸 Result: Coordinated fiat monetary policy failure
🪤 The Stablecoin Trap:
The U.S. GENIUS Act is expanding M2 money supply through the back door via stablecoins:
→ Legitimizing stablecoin issuance backed by Treasury bonds
→ Monetizing debt while calling it "innovation"
→ This isn't decentralization—it's the Fed with a blockchain wrapper
━━━━━━━━━━━━━━━━━━━━━━━━━━━━━━━━━━━━━━━━
🎯 Macro Pressure → Altcoin Opportunities
😰 Worried About: Wealth Confiscation/Control
💡 Consider: Financial Sovereignty & Privacy
🔍 Examples: CRYPTOCAP:XMR , CRYPTOCAP:ZEC
📈 Catalyst: Zcash surged 150%+ on institutional demand (Grayscale Trust)
😰 Worried About: Currency Devaluation & Inflation
💡 Consider: Scarce, Decentralized Stores of Value
🔍 Examples: Altcoins with fixed supplies + robust decentralized governance
🔑 Key: Assets that can't be inflated or controlled by single entities
😰 Worried About: Traditional Finance Instability
💡 Consider: Institutional-Grade Blockchain Infrastructure
🔍 Examples: HBAR (corporate governance) & XRP (cross-border payments)
⚠️ Note: Focus on real-world utility beyond speculation
━━━━━━━━━━━━━━━━━━━━━━━━━━━━━━━━━━━━━━━━
What to Watch For
✅ Confirmation: Strong, high-volume breakout above recent range high on CRYPTOCAP:OTHERS.D
🔍 The Privacy Pulse: Continued strength in privacy coins ( CRYPTOCAP:XMR , CRYPTOCAP:ZEC , XVG.D) is a key leading indicator. Note: Privacy coins face regulatory challenges and have been delisted from some major exchanges.
❌ Invalidation: Break and close below key support zone (April low structure) would suggest macro fears haven't overcome broader market uncertainty.
━━━━━━━━━━━━━━━━━━━━━━━━━━━━━━━━━━━━━━━━
🎯 The Bottom Line
The gold tariff is a symptom of a larger disease: eroding trust in neutral, non-government monetary assets . This is forcing a "regime change" in capital allocation.
As this realization dawns on more investors, the quiet accumulation in altcoins—particularly those offering privacy, sovereignty, and real-world utility —could explode into the next major market narrative.
💭 Smart money is moving early. The question is: will you recognize this shift before it becomes obvious?
━━━━━━━━━━━━━━━━━━━━━━━━━━━━━━━━━━━━━━━━
⚠️ Disclaimer: This is macroeconomic observational analysis and is not financial advice. Always conduct your own research (DYOR) and manage risk appropriately.
Cheers!
Bitcoin Strategic Outlook: Macro and Technical SummaryMacroeconomic Context
Global liquidity is rising again. Over 50 rate cuts across G-20 economies, combined with China’s multi-trillion-yuan stimulus, have added roughly US $5 trillion to global liquidity this year. The world has entered an easing cycle, supporting risk assets.
The U.S. Federal Reserve has started cutting rates but remains cautious: strong fiscal spending on AI infrastructure and tight labor markets could reignite inflation. Analysts expect a pause in early 2026 if price pressures return. Real rates and Fed communication remain the key variables for traders.
Early-Cycle Momentum & Dollar Weakness
Global growth sits in an early-cycle phase. Manufacturing softness contrasts with steady service demand, while fiscal dominance—large government spending—keeps nominal growth near 3 %. Liquidity injections from China and other markets stabilize collateral values and suppress volatility. The U.S. dollar has weakened as capital rotates globally; historically, Bitcoin outperforms during dollar downtrends and post-geopolitical shocks, adding a macro tailwind.
Institutional Demand
U.S. spot ETFs continue to reshape supply. BlackRock’s IBIT surpassed US $15 billion in six months, while corporate holders of Bitcoin doubled to 134 firms. ETF and treasury accumulation now absorb most new issuance, muting volatility and creating a structural floor. Exchange outflows are at two-year highs, confirming long-term accumulation by whales and institutions.
Regulation & Policy Clarity
The GENIUS Act (2025) established a U.S. stablecoin framework, and FASB now requires fair-value accounting for crypto. Together with SEC listing standards, these changes reduce uncertainty for large investors. The U.S. shift toward clarity has improved confidence and should sustain institutional inflows.
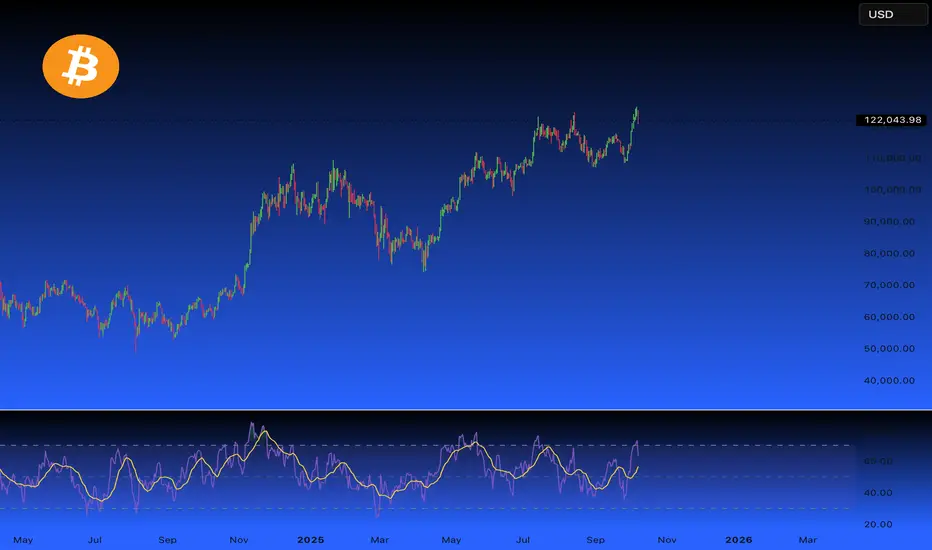
Technical Overview
After eight months of consolidation, Bitcoin broke to new highs above $100 k. June’s monthly candle formed a bullish pin bar, confirming demand near $102 k. Indicators remain neutral with balanced funding rates.
Key technical levels:
• Resistance $125 k – major sell zone; breakout opens $130 k–$135 k.
• Intermediate $104 k–$100 k – psychological support.
• Strong support $95 k–$90 k – 200-day EMA zone.
Losing $90 k risks a correction toward $82 k–$74 k.
On-Chain and Sentiment
Glassnode data show whales accumulating and exchange balances shrinking. Bitwise and Fidelity both note that ETFs and corporations now hold enough BTC to reduce daily float meaningfully. Market sentiment is bullish but measured—investors expect high volatility yet maintain multi-year confidence.
Expert Consensus
Standard Chartered, Tom Lee, and ARK Invest project $150 k–$200 k by end-2025, citing liquidity growth and adoption. VanEck and long-term macro investors place decade-end targets above $500 k–$1 million. RBC Capital Markets warns that inflation shocks could pause rate cuts; traders should watch CPI and real-yield trends closely.
Strategic Outlook
1–3 months: Range trading $112 k–$125 k. Break above $125 k → $130 k–$135 k target. Below $116 k → test $112 k support.
6–12 months: Liquidity expansion and ETF inflows point to $150 k–$200 k. Best opportunities likely on pullbacks to $95 k–$100 k.
3–5 years: Fixed supply, corporate adoption, and de-dollarization support an upward bias; structural forecasts $500 k–$1 million remain plausible.
Key Takeaways
Global liquidity is the dominant driver—monitor rate cuts and USD trends.
Institutional accumulation provides downside protection.
$125 k resistance defines near-term risk/reward.
Macro risks: renewed inflation, Fed policy reversals, geopolitical shocks.
Conclusion
Bitcoin enters Q4 2025 with a supportive macro backdrop, rising institutional demand, and technically strong structure. The path is volatile, but the long-term narrative of Bitcoin as a scarce, non-sovereign asset remains intact.
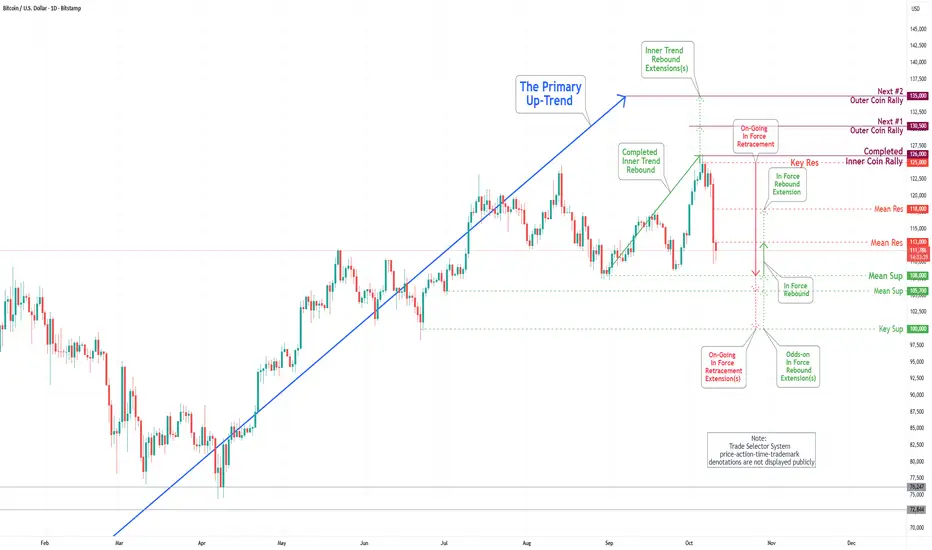
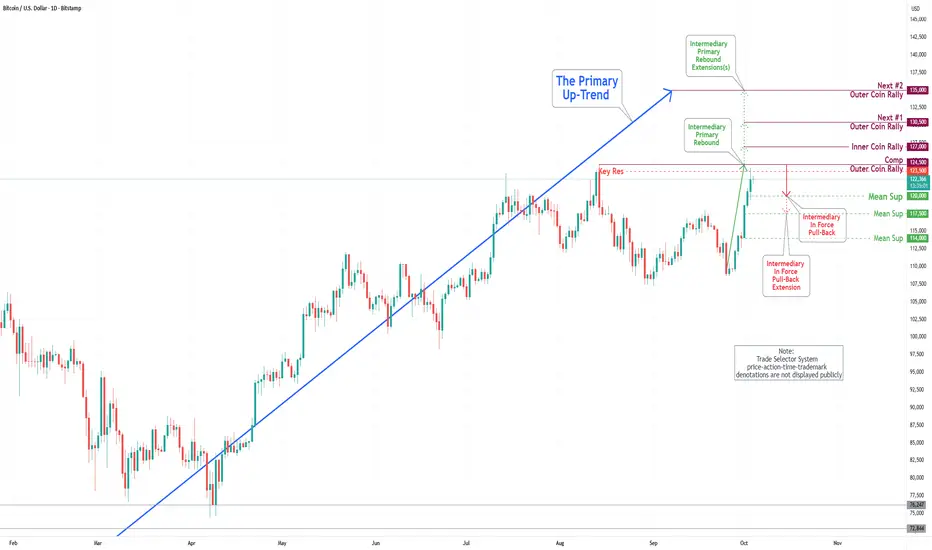
Bitcoin(BTC/USD) Daily Chart Analysis For Week of Oct 3, 2025Technical Analysis and Outlook:
During the most recent trading session, the Bitcoin market exhibited a notable surge, surpassing our Mean Resistance levels of 111600 and 113300, and the established Inner Coin Rally threshold of 117700. Currently, Bitcoin is fluctuating around the Key Resistance level of 123500 as it attempts to retest the completed Outer Coin Rally at 124500.
Following the conclusion of this retest, it is anticipated that the cryptocurrency may initiate an Intermediary In-Force Pullback towards the Mean Support target of 120000, with the potential for a further correction dip to Mean Support at 117500. Upon the completion of this phase(s), we expect Bitcoin to resume its upward trajectory.
Current analysis suggests the following designated upside targets: the Inner Coin Rally at 127000, the Next #1 Outer Coin Rally at 130500, and the Next #2 Outer Coin Rally at 135000. It is essential to recognize that Intermediary In-Force Pullbacks may occur at these specified levels.
Bitcoin(BTC/USD) Daily Chart Analysis For Week of Sep 26, 2025Technical Analysis and Outlook:
In the most recent trading session, the Bitcoin market experienced a significant decline, surpassing Mean Support levels at 114500 and 111500, and is currently fluctuating around the Mean Support level of 108300. Consequently, Bitcoin is continuing its trajectory in a primary downward trend, with the primary target identified as the Outer Coin Dip 102500.
Current analysis suggests a modest likelihood that the continuation of the primary downtrend could lead to a retest of the Mean Resistance at 111600, potentially extending to the Mean Resistance at 113300.
Nevertheless, it is essential to acknowledge that the prevailing sentiment within the Bitcoin market remains bearish. Following the conclusion of the primary downtrend at the outer support level of 102500, it is anticipated that Bitcoin will resume its upward trajectory.