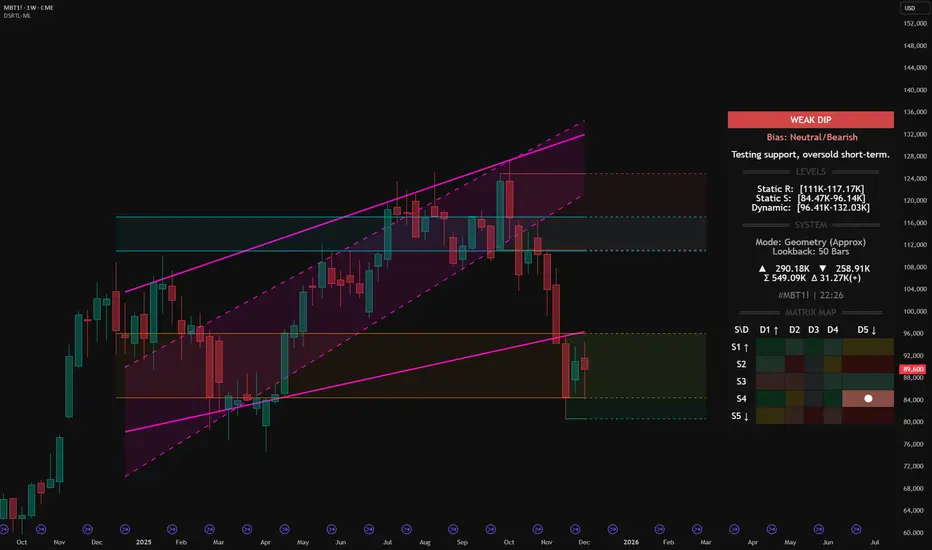
Micro Bitcoin Futures (MBT1!) – DSRTL‑ML Weak Dip at supportMicro Bitcoin Futures (MBT1!) – DSRTL‑ML Weak Dip at S4–D5 Support
We are analyzing the weekly structure of Micro Bitcoin Futures (MBT1!) using the institutional DSRTL‑ML support/resistance engine. On this bar the indicator classifies the state as WEAK DIP with a Neutral/Bearish bias and the system message:
Testing support, oversold short-term.
This reading comes from the current matrix position S4–D5 on the Matrix Map and defines the context for the price action inside this support zone.
1. DSRTL Matrix Diagnosis – State S4–D5
S4 – Static Support in Control
Price is trading inside the DSRTL Static Support band:
Static S: 84.47K – 96.14K
In the logic of DSRTL‑ML, this green support zone marks a historical high‑volume demand node where passive buy liquidity has previously absorbed aggressive selling. It behaves as a structural floor rather than a neutral price area.
D5 – Overshoot Below the Dynamic Channel
At the same time, price is positioned below the 5‑Point Dynamic Channel:
Dynamic Band: 96.41K – 132.03K
State D5 describes a downside extension beneath the lower boundary of the dynamic channel. Within this framework, that move is read as an oversold displacement away from the equilibrium path of the trend geometry, not as a fully confirmed new downtrend on its own.
Combined Reading – WEAK DIP with Neutral/Bearish Bias
The overlap of:
price sitting inside Static Support S4, and
price being oversold relative to the Dynamic Channel (D5)
produces the WEAK DIP classification. The Neutral/Bearish bias tells us that the dominant leg into this area is still downward, but the current candle represents a weaker phase of that dip occurring directly into a pre‑defined demand floor.
2. Key DSRTL Levels on This Chart
From the Levels and System panels on the chart:
Static Resistance (Supply Block): 111K – 117.17K
Upper structural ceiling derived from the DSRTL matrix of historical volume and price interaction.
Static Support (Demand Block): 84.47K – 96.14K
The active S4 floor where the current weekly bar is developing.
Dynamic Channel (Trend Geometry): 96.41K – 132.03K
The 5‑Point trend channel that defines the dynamic path of price; its lower edge around 96.41K is the first mean‑reversion checkpoint above the market.
Volume Metrics on This Bar:
Buying volume (▲): 290.18K
Selling volume (▼): 258.91K
Total volume (Σ): 549.09K
Delta volume (Δ): +31.27K
The positive delta together with the WEAK DIP label supports the idea that, inside S4, aggressive selling is meeting responsive buying rather than progressing as a fresh impulsive breakdown.
3. My Structural View Based on DSRTL‑ML
From a structural perspective, I read this configuration as follows:
Context of the Trend
The Neutral/Bearish bias confirms that the larger move into this zone is still a downward leg. The market is not flagged by DSRTL‑ML as a confirmed bullish reversal; instead, we are in a weak phase of the decline, pressing into defined support while the geometry is stretched.
Support Floor and Invalidation
As long as weekly closes remain above roughly 84.5K – the lower boundary of the S4 block – I consider this area a working demand floor for the current sequence. A decisive weekly close below that level would invalidate the weak‑dip narrative and shift the focus to a more developed breakdown of support.
Primary Path While S4 Holds
If S4 continues to hold, my expectation is that the oversold S4–D5 state will tend to resolve through mean reversion back toward the lower edge of the Dynamic Channel around 96.41K. In DSRTL terms, that is the first structural magnet above price once an overshoot has occurred.
Next Reference Above the Channel
Should price manage to re‑enter and hold inside the Dynamic Channel, the next major reference becomes the Static Resistance block at 111K – 117.17K. In my view, that zone represents the upper boundary of the current weekly structure and the area where I would expect supply and volatility to increase again.
In short, DSRTL‑ML currently maps MBT1! as a weak dip into S4 support with a still‑bearish background trend. My directional view is that, while this support holds, the structure favors a corrective mean‑reversion phase toward the dynamic band rather than an immediate continuation breakdown, with any weekly close below the S4 floor acting as a clear structural invalidation.
Indicator used for this analysis: DSRTL‑ML (Dynamic Support & Resistance Trend Logic).
Disclaimer: This publication expresses my personal opinion on the MBT1! chart based solely on the DSRTL‑ML indicator and standard price/volume analysis. It is not financial or investment advice and does not constitute a recommendation to buy or sell any instrument.
Chart-analyst
GBP/JPY Bullish Continuation Toward 215.00 TargetGBP/JPY is trading around 201.09, maintaining an upward trendline support. The pair is consolidating near resistance at 201.50, with a potential bullish target set at 215.00 if price breaks above the current range.

#Nifty 10th October Friday - #CatchAndRead Nifty50 10th October Friday - zigzag untadaa - #CatchAndRead
Follow my Yt channel link in dp
BTC/USD Trap to bullish Trend Still This chart shows *Bitcoin (BTC/USD)* on a daily time frame with a *bullish* outlook.
- *Current price*: 97,924
- *Target 1*: 101,980
- *Support level*: Around *81,053*
The price has recently made a correction from the highs, and there's a potential for a *bounce back* towards *101,980*. The support zone around *81,053* suggests a possible area for a reversal if the price drops. Traders should be cautious of any potential downside movement towards this level, but the overall trend appears to be *bullish* towards the target.
*Key points*:
- *Resistance* around 101,980
- *Strong support* near 81,053
- *Bullish scenario* in the short term
This setup suggests a potential price rise back towards *101,980*, with key support at *81,053* in case of a downturn. Always consider proper risk management and stay updated with market movements.

Shibainu ... Harmonic pattern I see an ascending butterfly pattern in this chart, it is likely to have significant growth. I see an ascending butterfly pattern in this chart, it is likely to have significant growth.

Shibausdt ,, tecnicall analyst 🐕From the number 663 in Shiba, we have been placed in the ascending channel, I also specified the ascending channel in (Rsi). Now we are waiting for the psychological number of 1000 for Shiba, in which Shiba has always reacted. So in the number 1000 . Maybe this will happen with a downward pullback, but it will happen very quickly, and it will continue its growth path soon, great choices always give great answers. Be profitable🌹

Market go up from here?NSE:BANKNIFTY
Price is supporting the trendline on the 1-day time frame, so is this fall just a retracement?

BITCOIN DUMPING? TIME TO BUY? What a crazy week! bitcoin goes to 25k then noise dives? be very careful guys I'm adding to my longs here at 23400 however go low leverage, you dont wanna get liquidated !

Sell IdeaHello traders, in today's trading session my team and I are monitoring GBPJPY for a selling opportunity below the 160.604 price level, once we get a bearish breach the pending order will be activated.
Pip Regards, DayBot6.
PS: Kindly COMMENT on what you think of this idea. Also LIKE, if you do.

BITCOIN HIT OUR SUPPORT! TIME TO BUY? As highlighted in my past video; the support for bitcoin is 22,800 to 22,400; we can wick below it and it will still be fair game. I see bitcoin running to 30,000 in the coming weeks if everything plays out accordingly.


WiproWIPRO
Currently Trading -364.20
Target 1-370.70
Target 2-377.55
Target 3-389.30
Reason
Macd cross over the signal line towards upward movement.
Short term investment Target


The buyers are pulling GOLD higherPrevious metal Gold on the 4 hours chart has been in an uptrend since 12 November 2019 when it registered the lowest price level of the period under study at 1445.54. Since then, the precious metal has been forming successfully higher tops and higher bottoms. At time of writing, Gold is moving around 1475.21 above the 20-period and 40-period simple moving average respectively.
Additionally, the oscillator analysis indicates positive sentiment for Gold. The 14 period RSI Oscillator (Relative Strength Index) is above the 50 level - a fact that shows that the buyers are control of the market. The 23 period Momentum Oscillator is also above the 100 mark, which illustrates bullish movement in the precious metal.
When attaching the Fibonacci Retracement tool from the top at 1469.14 and dragging it to the bottom at 1462.6, three price targets may be calculated. The first target level is projected at 1473.18 (161.8%), which has been successfully reached. The second target level is estimated at 1479.72 (261.8%). The third target level is forecast at 1490.30 (423.6.8%).
It remains to be seen how much higher the bulls will manage to pull the price of the Gold.


