Chart-patterns

Rising Wedge in AUDUSD.Hello my fellow traders, hope you'll making some profits. We are here with our new analysis so that we can increase those profits for you. Let’s get into the analysis. We have posted two charts. The D1 time frame chart is in the comment section, which indicates the support and resistance. On the H1 chart we can see that the pair is moving in the rising wedge with a new higher high while not breaking its previous higher lows. It will be interesting to see if it continues inside the wedge and move up till the resistance or it breaks the wedge support line and starts falling. On the weekly chart you can see that the long term trend is on the down side.
Let us know your views on this in the comment section. Thank you all.
There is a good news for our followers. We will be doing analysis on demand. So let us know which pair you want our analysis on and we will get it for you. Do like and follow us.
Ryan.R.Lopes

GBP/USD 4H SHORTGBP/USD May fall 80-100 pips
Insight - Price has pushed back up just below resistance at 1.2222 and support now at 1.2040 after forming a double bottom. Two touches at the resistance line after possibly a third rejection, this could mean more downside if entry for the sort is reached.
Intraday - 4H
Trade: Sell
Sell or Below 1.2040
Entry: 1.2117
Target TP: 1.2040 & 1.1915
Pivot and Support 1.2040
Alternative scenario:
Trade: Buy
Buy or Above: 1.1226
Target TP: 1.2297 & 1.2407


INVERSE HEAD AND SHOULDER SETUPLooking out for this as a possibility for VTC/USD.
We'll see what happens.
Who knows?
Good luck.

ETHUSD, Another great oportunity to make a quick profit
Hello, as you can see, resistance line was just tested for the third time. This offers us a great oportunity to make a quick profit by trading "candle color options". As always, we will place a bet on a green candle as soon as one of them closes above resistance line. We will keep on betting on a green candle untill we get stoped out by a first red candle. We will abandon this set-up if support line gets penetrated. I always update my trades as they develope, so please follow me and provide feedback in the comments bellow. Thanks.

Supports held! .30 cents within weeks once this happens...Our supports are holding tight traders. This is excellent. We still need to poke through that overhead as I mentioned in my last post (below). Other than this, all signs are looking good.

EURUSD : LONG TRADEThe active trend for Eurusd is bullish till around 1.11994 where we see a strong resistance zone ahead ! If price breaks above, we could be headed towards 1.12360 level .
Risk Warning : The risk of loss in trading Foreign Exchange (FOREX) can be substantial.
You should therefore carefully consider whether trading is suitable for you in the light of your financial condition.
Goodluck !

Possible Head & Shoulders Set-Up on NZD/USD FX:NZDUSD : Kiwi dollar rallied significantly last week with the RBNZ surprising markets; keeping the OCR at 1.00%
Price action is showing significant weakness at a key level of resistance, with the formation of a rather abnormal head & shoulders pattern.
A break of the neck line seen around the 23.6% fibonacci could see a longer term push to retest the yearly lows, and even start to set new lows for 2019.

NZDJPY head and shoulders!!!Hello everyone, nzdjpy has formed an head and shoulders, so we can short till the next support level...

20191105 XRPEUR Open Short PositionHi there,
Just and idea after analyzing XRPEUR Movement this year and areas, specially supply and demand, and some chart patterns that indicates the price could go down before it starts up.
Right now, it's starting to curve, giving sign of downtrend. As usual btc goes on the hand of btc and since you may see in some analysis i have made on BTC, this could go down too.
More than once i have noticed volume blocks on Kraken on 0.19 euros. This could be anothr sign too. So, in personal opinion, it could be a good place to open a short position for a couple of months while price goes down to demand area.
Again, Just personal Idea and not financial advice.
Cheers!
Charter X

EURJPY H4 BuyBuy EURJPY H4:
Support level holding up
Breakout of downward trendline
Retested the breakout area
Buy @ 117.800 - 117.900
TP: 119.800

The CORRECT way to trade chart patterns - Head & ShouldersSimplified psychology of chart patterns:
Traders learn chart patterns but are to impatient to wait for them to show up in the right places. The point of learning to spot patterns is to be in a position to enter a reversal before price takes off. The KEY to trading chart patterns is to only trade them when inside a channel. The attempt to enter into a position should be up against the top or bottom of a channel (selling the tops, buying the bottoms).
UNDERSTAND HOW PRICES MOVE:
Prices move in levels, creating new levels above or below a current level. These levels can be formed sideways or diagonal. It will do this on every time frame until it reaches a point it can't break through. When a breakout of a channel occurs, price will continue in a given direction until it forms a new top or bottom, which creates a whole new level. Price will continue to trade inside this newly formed channel (from top to bottom) until enough momentum is created to push price OUTSIDE the level. The same process will restart.
UNDERSTANDING HOW TO ENTER A TRADE:
The higher time frame trend should be the direction a trader intends to enter. Once channels are identified, a trader should be watching for well known chart patterns to form on lower time frames AT THE CHANNEL'S top (if trend is down) or bottom (if the trend is up). THE EXIT STRATEGY should be approached similarly. For example, if the entry was LONG (at the bottom of a channel), then the trader should anticipate selling half of the position at the TOP of the current channel once a newly forming chart pattern paints a picture of weakness.
CONCLUSION:
Chart patterns are only useful within identifiable channels/levels. The highest probability to win a trade is entering into a chart pattern that is formed at the tops or bottoms of these channels.
Exiting portions of the position should be approached the same way, in anticipation of chart patterns being formed on smaller time frames at tops/bottoms of channels/levels.

Gold/Euro buy ABCD opportunityThis chart show ABCD on XAUEUR buy opportunity for testing the area again, we have three targets, close 33.3% of the trade at each target, trade with care, cheers.

Sir, the channel has been takenThe channel is gone, just as we predicted.
It's a sad day to lose such a strong channel, especially for you bulls out there who stayed optimistic.
Earlier, bitcoin bounced out of the channel that it was steady trending in due to a quick 1 hour bump in bear volume.
If this pressure keeps up, expect to fall all the way down to the .5 fib level, where heavy bear volume bounced bullish earlier last week
For you bulls out there - it's a waiting game. Wait till you see confirmation after a new trend formation.
For you bears out there - you might see some more gains once this .382 fib level is broken.
For you newcomers, it's a 50/50 right now. be careful entering with leverage
What do you think? Is this just a head-fake, or are the bears taking back some control?
-Block

Churchill Downs even with good news, is in a time to short CHDNAll the news looks positive here
-BUT-
Looking at the charts, even with the recent split, it all shows sell short.
If you are in this stock long, it is time to sell now, and rebuy maybe in a few months.
I am shorting CHDN right now, as it seems to hit its peak on the trend line, and I have 4 targets laid out for those that want to hold on longer than others
I believe it could hit all 4 targets especially with people starting to watch their money at this time, until we hit the March Madness season and the actual Kentucky Derby race in May.
Thoughts?

Really all depends on BTC, doesn't it.So basically, we have a few scenarios. Mainly, watch BTC closely for a while. Everything is really based on the price of Bitcoin still. Infuriating. Anyways, Neo seems poised for greatness, however, there are a few larger channels we have been a part of much earlier. Blue is up - confirmed trends/channels. Orange is down - confirmed trends/channels. White is the general channel we have been stuck in for some time now. Price is likely to remain well within those ranges.
The current uptrend is pretty fun, but I'm not sure it will last. Price convergence on the channel intersections seems to play a role.
Not advice. Just a lonesome Crypt-Keeper.
Don't bet on me.

GOLD UPDATE 27-12-18Gold still manages to push further up. This is most likely due to the heavy volatility and uncertainty around the indices. Right now Gold is touching long term trend support that turned into a resistance after we broke it earlier this year. Next to that, the price has been moving up in a curve like structure which is never a sustainable move for the long term. Next to that, RSI is starting to near overbought areas and we are facing a very heavy resistance area soon. This resistance are is the area of bearish wave 2 that started at the previous interest hike of the FED. I would be very surprised to see this all break up. if it happens, it would be massive and we could be going to test 1300 again, even 1360 is possible then.
For now I am bearish, I expect a bearish movement after we are reaching overbought prices and when the price reaches the heavy resistances that lie ahead. From there a move down to the parabolic support line where we go sideways up for some days. Eventually I expect a break of that parabolic support to continue for more down-movement.

NZDCAD buy idea. Am I the only 1 looking at head and shoulders??Well i guess this is clearly a HEAD and SHOULDERS PATTERN for thouse who dont know about it head and shoulers is a pattern that can show us
that the price will probably go on back to the way it came and the way the last shoulder goes on. so in our case it looks like a BUY to me but always keep in mind the supports and be ready all the time :)

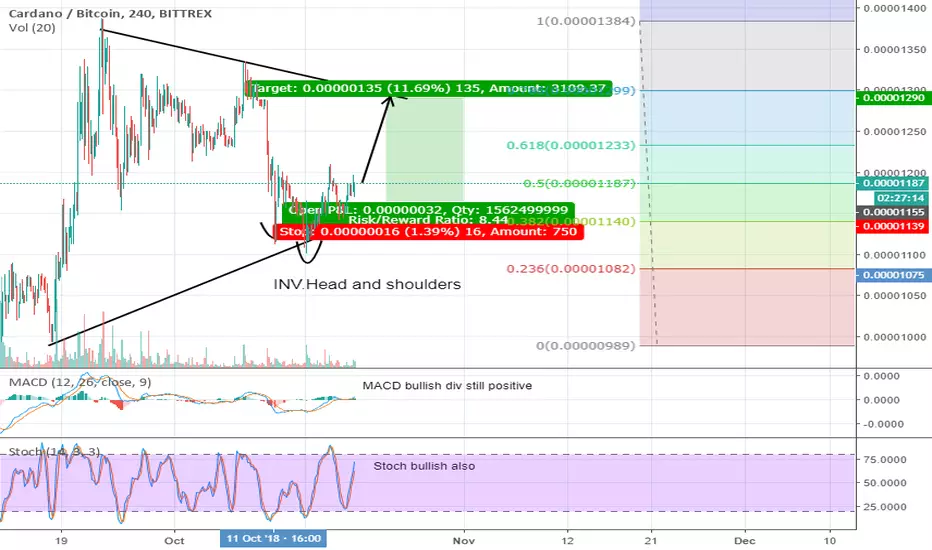
ADA BTC 11.7% scalping opportunityADA is situated into a wedge which is can be both bearish or bullish but if we zoom a little bit the picture we can see there inversed head and shoudler which can breakout soon
We have a target of 0.786 fib resistance which is 1299 sats -0.02% and also the top of this wedge .It s a really nice breakout setup to a long scalping
Targets: we put below fib resistance to be sure they will hit
1)1230 sats -0.02%
2)1270-1287 sats -0.02%
Stoploss:1138 sats -0.02%
USD JPY Patterns idea for going long?I went long at the yellow highlighted area where I hoped it would keep the bull trend going. The last two purple highlighted areas seemed like a on going pattern where the third purple area near the yellow, is doing the same thing where I predict it may follow the dark green and dark blue lines, getting as close as it can to 113.000.
If it does not go that way then it may follow the dark red line becoming a bearish trend, maybe a twin buy for a come back.

Intraday USDCHF shark patternshort shark pattern intraday for USDCHF, looking to bearish from up and show target and stop loss.
