GOLD holidng upside ? going to supporting areas ??#GOLD... market hold our yesterday resistance area that was around 4170-73
and from yesterday market trade below that resistance area so be ready and stay sharp guys.
below that we can expect a drop towards our supporting areas.
NOTE: we will go for cut n reverse above 4172 on confirmation.
good luck
trade wisely
Chartanalysis

USDJPY Just Broke Out — Early Trend Reversal or Fake Strength?1. Market Structure – Dow Theory Perspective
On the H1 chart:
- Price has consistently printed Lower Highs – Lower Lows, forming a descending channel.
- The most recent move shows:
+ A higher low (HL) forming at the bottom of the channel
+ A clear break of structure (BOS) at the upper trendline
This signals a transition phase, where sellers are losing momentum and buyers are starting to dominate.
According to Dow Theory:
➡ A trend changes when the market forms a higher high followed by a higher low.
USDJPY is currently in that exact phase.
2. Breakout Confirmation
The breakout from the channel is valid because:
✔ The candle closed above the trendline
✔ Volume increased slightly on breakout
✔ Price retested the broken structure (blue arrow) and bounced cleanly
This adds strong confirmation that the breakout is not a fakeout.
3. Key Zones to Watch
🔹 Support Zone
Located around the lower channel and green zone — this is the origin of the bullish rejection. As long as USDJPY holds above this zone, the bullish scenario remains intact.
🔹 Strong Resistance Zone
Marked at the top of the chart — multiple liquidity pools exist here. TP2 and TP3 align with these resistance levels.
4. Bullish Scenario – Primary Outlook
After the breakout, the market is expected to follow a classic break → retest → continuation pattern:
🎯 TP1: 156.832
First liquidity target — where the first wave of profit-taking is likely.
🎯 TP2: 156.984
A stronger resistance level — aligns with prior price congestion.
🎯 TP3: 157.200+
Located at the strong resistance zone.
If buyers maintain momentum, this is the final upside extension.
This aligns perfectly with bullish structure + breakout momentum.
5. Technical Summary
-Breakout from descending channel ✔
- Higher low formation → early trend reversal ✔
- Retest confirmation ✔
- Clear upside liquidity targets ✔
Everything aligns with a bullish continuation scenario for USDJPY.
🔥 Conclusion
USDJPY has broken out of its descending channel, signaling a potential short-term bullish reversal. As long as price holds above the retest area, the market favors an upward move toward TP1 → TP2 → TP3.
This is a clean structure-based opportunity for trend traders and breakout traders alike.

Bitcoin: Internal countermoveBitcoin currently appears to be forming an internal countermove within the ongoing orange wave a. Nevertheless, our primary outlook remains that this a-wave will ultimately extend into our green Target Zone, which ranges from $62,395 to $51,323. From this low, we expect another corrective move to the upside before the final downward leg of the wave (ii) correction—an overall pattern that has been developing since January—reaches completion.

ExxonMobil: Fresh Selling PressureExxonMobil recently came under renewed pressure, pulling back from resistance at $126.34. In our primary scenario, we continue to expect the high of the magenta wave (B) to remain below the resistance at $134.38, before wave (C) drives the stock into our green Target Zone between $75.37 and $50.05. However, if the stock soon drops below support at $95.77, we may have to assume that the high of the turquoise wave alt.2 is already in place, which would likely result in an earlier move toward our Target Zone (probability: 35%).

GOLD at cut n reverse area? whats next??#GOLD.. market just made a fresh resistance area that is around 4170
keep close and if market hold it in that case we can expect a drop from here.
NOTE: we will go for cut n reverse above 4170 on confirmation.
good luck
trade wisely

Key Levels & Bullish Bias – Intraday XAUUSD Outlook for Nov 26Gold Market Analysis – M30 Intraday Outlook
- Gold continues to push higher on the M30 timeframe, maintaining a strong bullish structure after the previous breakout.
- Current price is around 4155–4160, showing clear buyer strength and healthy continuation behavior.
- From a structural perspective, the market continues to print higher highs and higher lows, confirming that bullish momentum is still dominant.
- As long as gold remains above the 4128 pivot zone, the probability favors further upside expansion toward the next liquidity targets.
Key Levels
- Pivot Level: 4128
- Resistance / Target Zone: 4185 – 4210
- Support: 4109
- Extended Support: 4083
Trading Recommendations
✅ Primary Strategy – BUY Bias
Buy above 4128
Target 1: 4185
Target 2: 4210
As long as price holds above 4128, bullish continuation remains the most likely scenario.
🔁 Alternative Scenario
If price breaks and sustains below 4128:
Target 1: 4109
Target 2: 4083
This signals a deeper pullback into previous demand zones before any continuation attempt.
Technical Insight
- RSI remains in bullish territory, supporting further upside momentum.
- Market structure is clean and bullish, with no confirmed reversal patterns at this stage.
What are your thoughts on GOLD? Comment now or join my group to trade with me on description

Zscaler: Downward Shortly after our last update, Zscaler faced significant downward pressure—completely in line with our primary scenario. This move allowed the stock to turn lower in time, staying below the resistance at $340.25 and avoiding our alternative scenario of an early breakout above that level. However, a quicker peak for the turquoise wave alt.Y remains a possibility, as we still assign a 37% probability to such an accelerated sequence. Primarily, though, we expect further sell-offs as part of the magenta wave , which should eventually give way to renewed gains above the support at $164.78. With wave , the regular wave Y should then complete above $340.25.

Coca-Cola: Approaching Key Resistance LevelCoca-Cola shares continue their upward trajectory, marked by minor pullbacks and brief periods of sideways movement. Overall, the stock maintains a bullish trend and is currently trading just below resistance at $74.38, which is likely to be tested next. We anticipate that the blue wave (y) will push the stock into our red short Target Zone between $76.58 and $81.51. Within this range, we expect the beige impulse wave III to complete. Once this high is reached, a significant correction is likely. As such, we view this zone as an opportunity to establish short positions. If a new high fails to materialize, it could indicate that the beige wave alt.III has already concluded. In that scenario, a direct drop below $65.35 would be expected (probability: 30%).

GOLD at Cut n Reverse Support? Major Bottom? holds or not??#GOLD perfect move as per our last idea regarding gold and now market just near to his current supporting area that is around 4040-50
that is market major supporting area and market holds in morning as well.
keep close that area and keep in mind that is our major and cut n reverse area.
don't be lazy here and stay sharp ..
NOTE: we will go for cut n reverse below 4045 on confirmation.
good luck
trade wisely

EURCHF – Outlook for the Coming Month1. Monthly View
On the monthly timeframe, the overall structure is still bearish, but there’s room for a potential bullish shift. The major liquidity resting at the previous lowest point—formed in November 2024—has already been swept. With that liquidity taken, the market now has the space to push higher if buyers step in.
2. Weekly View
Last week’s candle swept liquidity as well, leaving behind a strong rejection wick. That tells us many stop orders below were triggered. This week’s candle is currently trading within the range of last week’s candle, which suggests we could see some sideways movement for a bit. However, since downside liquidity from higher timeframes has already been taken, the market could be setting a liquidity trap before moving upward to hunt the liquidity sitting above.
3. Daily View
Yesterday’s candle showed solid buying pressure, confirming a daily low. I’m looking for a pullback into the discount zone before expecting the next move to the upside. The structure is starting to shift in favor of buyers.
4. 4-Hour View
The market had been in a bearish trend for quite some time, failing to break previous highs. But today, we finally saw a break of structure to the upside, followed by a new lower low—hinting that a more meaningful move may be developing. Still, I expect EURCHF to pull back once more on the 4H to create a trap before continuing upward, and this pullback shouldn’t break the lowest low.
Final Thoughts
EURCHF has already cleared major downside liquidity on the higher timeframes, and that shifts the draw toward the upside. With the monthly low from 2024 swept, last week’s liquidity taken, and the daily low confirmed, the pair is setting the stage for a potential bullish continuation once the market finishes its pullback.
I’m keeping an eye on how price behaves during this expected retracement. As long as the market doesn’t break the recent lowest low, the structure favors a move higher. A clean reaction from the discount zones on the daily or 4H would strengthen the bullish narrative and open the door for the next upward leg.
Overall, EURCHF looks prepared to build momentum—but confirmation will come from how it handles the upcoming pullback. Stay alert to those key zones, because that’s where the next major move will likely begin.
----------------------------------------------------------------------------------------------
Thanks for checking out this analysis! If you enjoyed it, hit that follow button so you don’t miss future updates. And if this breakdown helped you out, drop a like 👍 and share your thoughts in the comments 💬—I always appreciate the feedback!

S&P500: Poised for Further Pullback The S&P 500 futures are currently trading just above support at 6,540 points, but are expected to see a temporary pullback within magenta wave (4). In our primary scenario, we anticipate the sell-off will extend into the green Long Target Zone between 6,163 and 5,912 points. From this area, we expect the start of wave (5), which would complete the magenta five-wave sequence and push the index higher—ideally above resistance at 6,952 points. This move would also mark the final high of the broader blue wave (III). However, if selling pressure intensifies and the Long Target Zone is breached, our alternative scenario will come into play (probability: 31%). In this case, blue wave alt.(III) would already be complete, and the index would enter a significantly deeper correction phase.

Litecoin: Target Zone Within ReachLTC has recently continued its decline, leading us to believe that the high for green wave B is likely already in place. Price is now just a short distance from our green Target Zone, which ranges from $78.52 to $64.53. Within this zone, we expect to see the low of orange wave ii. Afterward, orange wave iii should drive price above the resistance levels at $118.71 and $147.06.

Bitcoin at the Edge – What Comes Next?Over the past couple of months, Bitcoin has been navigating a complex mix of macro shifts, liquidity changes, and sector-specific catalysts that, in our opinion, have pushed the market into a critical decision zone. Sentiment has become increasingly divided: long-term structural bulls remain confident, while short- and medium-term flows have turned more cautious.
1. Recent Developments & Market Sentiment
In the past half a year, crypto markets have been influenced by several overlapping narratives. Regulatory tone has eased globally, with more pro-innovation stances emerging in key regions. Political developments—particularly renewed efforts in the U.S. toward clearer crypto frameworks—have added a layer of optimism. Institutional participation has also continued to expand, with ETF flows stabilizing after earlier periods of volatility.
Yet despite these supportive headlines, market behavior has shown hesitation and sold off in the past month. In our opinion, this was driven primarily by the resurfacing of Trump’s aggressive tariff threats, reigniting trade-war fears, a sharp drop in expected Fed rate cuts, and massive institutional ETF outflows plus leveraged liquidations. Sentiment has flipped from extreme greed to extreme fear.
In our view, the inability to sustain acceptance at recent highs points to exhaustion in the prior uptrend. Overall sentiment is less euphoric and more cautious—this current zone would likely be a battleground between long-term accumulation and shorter-term mean reversion.
2. The Underlying Driving Forces
Bitcoin’s medium- and long-term structural drivers remain intact: institutional adoption, the growing integration of digital assets into traditional finance, the post-halving supply dynamics, and Bitcoin’s increasing correlation with broader macro conditions.
Macro factors such as real yields, liquidity conditions, and risk appetite continue to play a major role. As markets position for next year’s rate lowering expectations and potential fiscal shifts, Bitcoin, in our opinion, is behaving more like a liquidity-sensitive asset than a speculative outlier. This is especially apparent in how it has reacted to major economic releases and policy signals. The bottomline is that Bitcoin’s major swings are increasingly tied to macro liquidity flows—the same forces that drive equities, especially high-beta tech.
Market structure is equally important. Bitcoin’s auction process—how price accepts or rejects value—often drives multi-month cycles. When value areas break or hold, the market tends to transition into new regimes. That is exactly where the market appears to be now.
3. Chart Analysis – A True Decision Area
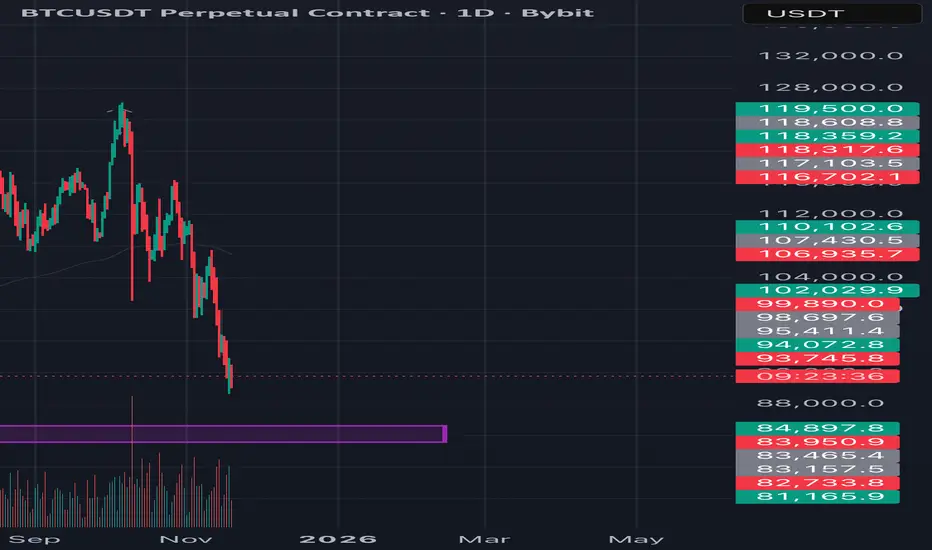
Bitcoin is currently sitting at what we believe is a major inflection point: the 2024 Low-Value Area (LVA), where Bid Block 1 formed in March 2025. This zone acted as the structural base where buyers initiated up to new all-time highs earlier this year.
From July to October 2025, the market attempted to accept near the top of the range, with buyers defending Bid Block 2. By mid-October, however, bid support weakened. Longs unwound, driving price back into Bid Block 1 near 84,600, which is confluent with yearly support and the prior trendline break from November 2024.
Going into the next quarter, Bitcoin sits atop a critical area of demand. In our opinion, how price responds here could determine whether this pullback stabilizes or it becomes a deeper liquidation phase.
Key Levels:
82,000 – 2025 developing low / Bid Block 1 low / 2024 TL breakout
77,000 – 2024 VPOC
Bearish Scenario:
If buyers cannot recover quickly back above 87,700 (2024 VAH), and bids fail to hold the 81,000–77,000 region, the market may open the door to further long liquidation. That could lead to a move through the 2024 Value Area, potentially targeting the 60,000 region (2024 VAL).
Bullish Scenario:
If buyers reject strongly up from the 82,000 area, a move through 94,200 (Bid Block 1 high) could shift control back toward buyers. This may open a path toward 100,000/102,550 (2025 developing VAL / Bid Block 2 low), where sellers could be expected. Acceptance above that could set up a move toward 123,050 (2025 developing VAH) and possibly a revisit of the all-time highs.
Neutral Scenario:
Without any new catalyst, the market may consolidate and form a two-way auction between 99,700 and 82,000 as it digests recent volatility. This could serve as a base for the next directional expansion.
In our view, how Bitcoin behaves around this zone will set the tone heading into 2026. I’d love to hear your views—drop your thoughts in the comments and give this post a boost so others can join the discussion.
This post reflects our personal market views and is for educational discussion only. It should not be interpreted as financial or trading advice. Market conditions can change rapidly, and the levels discussed here may shift as new information emerges. Always conduct your own research and consult a licensed financial professional before making trading decisions.

Solana: Room for moreSOL recently dipped further into the now green Target Zone between $155.80 and $113.20. Within this area, we expect the low of wave ii in orange to be established imminently. Afterward, we anticipate a strong wave iii rally, which should peak above resistance at $295.31.

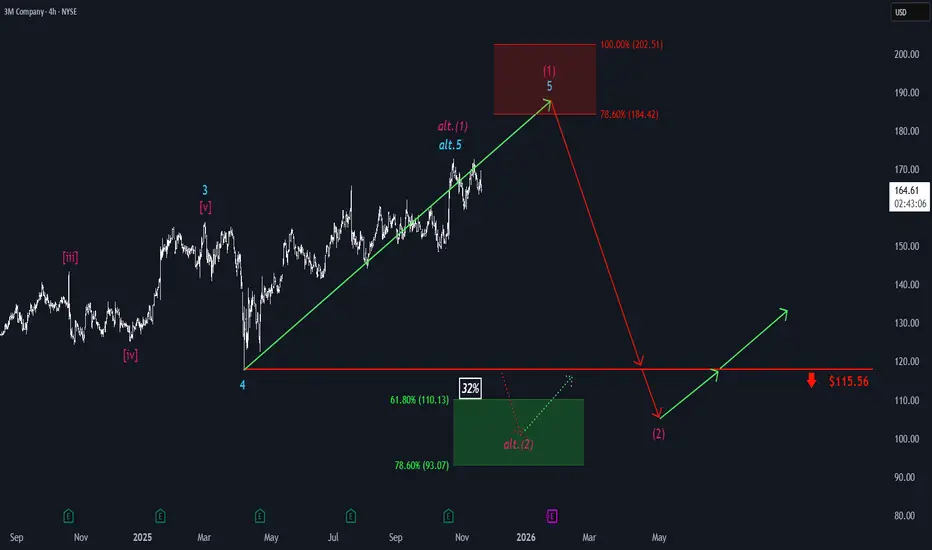
3M: Approaching the Target Zone3M stock has recently traced a zigzag pattern on the chart. In the short term, we anticipate further upside, with shares moving into our Target Zone between $184.42 and $202.51. Within this range, we expect to see the peak of the magenta impulse wave (1). Once this level is reached, a corrective wave (2) is likely to set in, pushing price below support at $115.56. Alternatively, it’s possible that the high for wave alt.(1) has already been established. In that scenario, the ongoing alt.(2) would bottom out within the alternative Target Zone between $110.13 and $93.07 (probability: 32%).
Apple: Pause - but New Highs Likely Ahead Apple has recently shown signs of sluggishness, trading mostly sideways. For now, we expect this pause to give way to renewed gains, allowing the green wave to reach a new high. However, there is also a 31% chance that the current consolidation could break to the downside, leading to imminent sell-offs below the $212.94 support level. In that scenario, we would view the previous advances as merely corrective and anticipate a new, broader corrective low in the blue wave alt.(IV), although this would still form above the lower $168 mark.

LULU HOLIDAY LONGLULU has been falling hard in the past few months/weeks, down to support from March 2020 at $160~
With support from the bottom of the channel on this downtrend also meeting the support from over 5 years ago we see a confluence of support.
Also with a rising MACD and a rising RSI showing signs of volume and interest at this HUGE support line, I see an approximate 15%-35% return on investment.
The Financials on LULU also look very good with a P/E of 11.62 and little debt sitting at $1.76B. I find this to be a good thing because they have $1.16B of cash equivalents and a market cap of over $21B so little to no stress in the financials
I am not a financial advisor, and the information in this post is for educational or discussion purposes only. Please do your own research and consult a licensed professional before making any investment or trading decisions.

USDJPY 4H Buy Setup with Levels!Hello Everyone,
Let's see how this pair will perform based on the analysis.
Based on my analysis I'm sharing my view.
Make sure you do your research, and based on your confluence, please look for the entry.
Don't rush your trades without any confirmation.
Use proper risk management always and trade safe.
Thank You All in advance for checking my trade idea for your Likes, Comments & Follows, Highly Appreciated your support!
Get the updated ideas.
FOLLOW | LIKE | COMMENT | SHARE
If this analysis helps you plan better 📈

Nvidia: Downside Pressure Nvidia has recently faced notable downward pressure, but so far has managed to hold above the support level at $176.21. As a result, we continue to anticipate an imminent rally as part of the beige wave V, which should lift the stock into the now-red Target Zone between $227.38 and $260.60. However, if the stock immediately drops below the $176.21 mark, we would expect a new low for the beige wave alt.IV, with the lower $145.50 level still likely to hold.

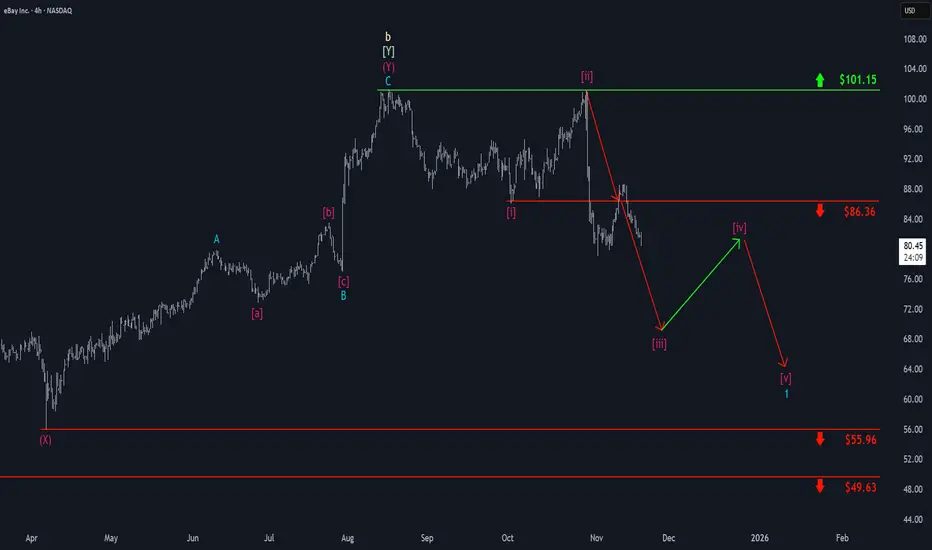
eBay: Set for Further DeclineseBay has recently made another move higher, briefly reclaiming the $86.36 level. However, the stock has since resumed its downward trajectory as anticipated and is expected to continue selling off soon as part of magenta wave . Overall, this magenta downward impulse should push price closer to support at $55.96, completing turquoise wave 1.
BTC DAILY KEY LEVEL APPROACHING BTC has been on a down trend for a while now and is currently approaching a daily demand zone which is the zone that caused the break of structure of the previous high on the daily time frame. So let wait for price to Tap into the zone and see if buyers will eventually kick in or probably break below it to continue the downtrend. Let wait for clear confirmation.
SONACOMS: Bullish Momentum ActivatedThis is the daily timeframe chart of SONACOMS.
The stock is trading within a well-defined upward channel, with the lower-boundary (LOP) support positioned near the 470–480 range. It is currently sustaining above this support zone.
If the stock continues to hold this level and the ongoing bullish momentum remains intact, SONACOMS may potentially move toward the channel resistance near the 600 level.
Thank you.

XAUUSD Bullish Setup Toward 4100XAUUSD is showing a bullish setup after sweeping liquidity and rejecting strongly from the order block zone. Price is pushing upward toward the 4100 target, supported by previous range breakout, FVG imbalance, and clear resistance levels above. The chart signals continuation to the upside.
