CAKE 3D AnalysisHere is an analysis of CAKE on 3 Day time frame. It has broke long term down trendline on 3 Day time frame. We can expect the next targets as expected on chart. NFA DYOR.
Chartanalysis

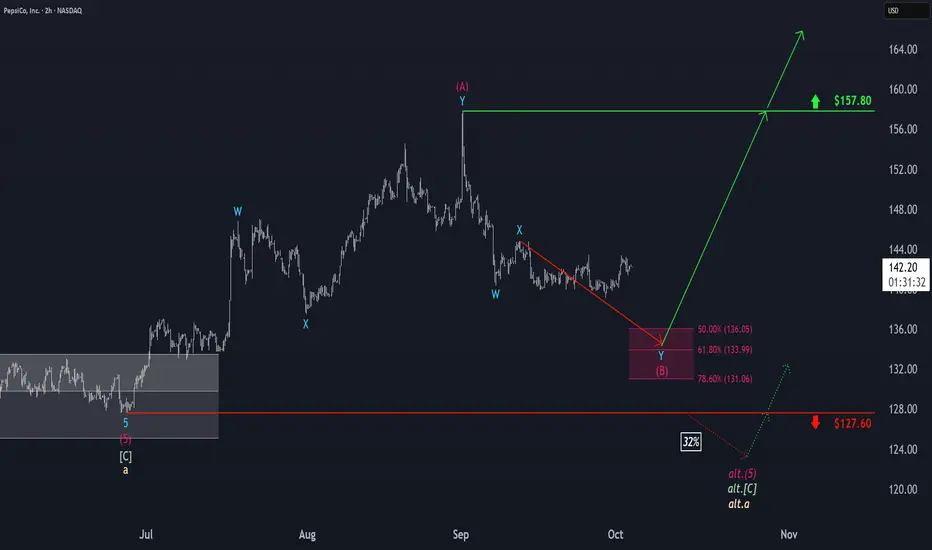
PepsiCo: Approaching the Target ZonePepsi shares have traded mostly sideways within a broader range over the past two weeks. Our primary outlook is that the ongoing magenta wave (B) will continue to move lower, eventually bottoming within the similarly colored long Target Zone between $136.05 and $131.06. From that point, we expect the broader upward trend to resume. However, a sustained move below the $127.60 support level would trigger our alternative scenario (probability: 32%). In this case, the larger beige wave alt.a would remain incomplete, suggesting the correction phase could be deeper and longer than projected in the primary scenario.
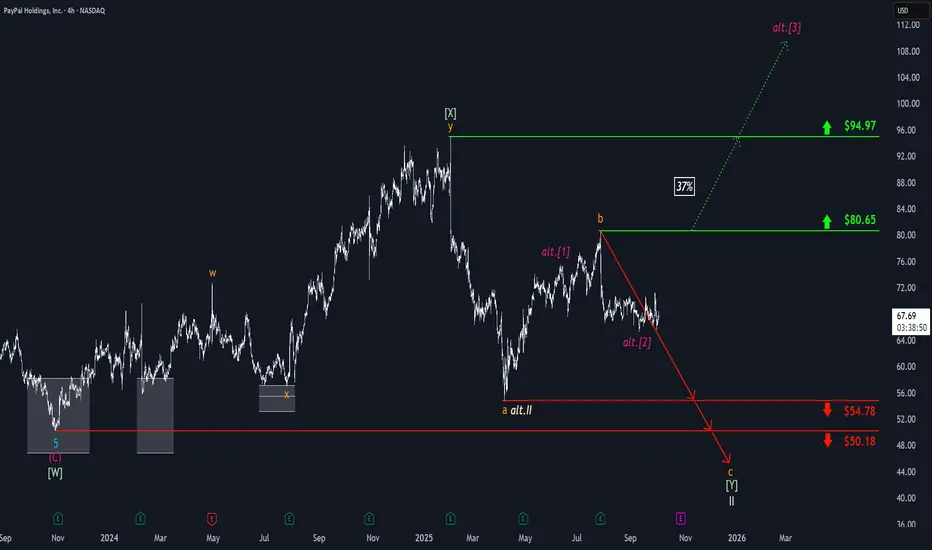
PayPal: Trading Sideways Amid VolatilityPayPal has recently experienced notable volatility but has continued to trade sideways within a certain range. Our primary expectation is that further downward momentum will dominate, potentially driving price below both support levels at $54.78 and $50.18 to complete the correction of beige wave II. However, there is also a 37% chance that PYPL has already finished beige wave alt.II at $54.78. In that scenario, the stock would already be building a sustained magenta upward impulse and could break out above the resistance levels at $80.65 and $94.97 during wave alt. .
ATOM 4H Trade ideaATOM is going good. We can execute long trade here. Entry & Exit points are given on chart. NFA DYOR
Uni 4H Trade IdeaHere is a trade idea for UNI on 4 hour TF. Entry & Exit Points are given. NFA. DYOR.

SUI: Alternative Scenario in Play as SUI Breaks Key SupportSUI has continued its downward trend since our last update, breaking below the $3.11 support level and triggering our alternative scenario. As a result, we now place the altcoin in the beige wave (C). We primarily expect this downward wave to drive price lower, with a bottom likely to form within the green long Target Zone between $2.76 and $2.30. This low should also mark the end of the larger wave 2 in bright green, which we had previously considered finished. From this price range, we anticipate a new upward impulse: green wave 3 is expected to push the coin above resistance at $4.44. Accordingly, prices within this zone could be considered for long entries.

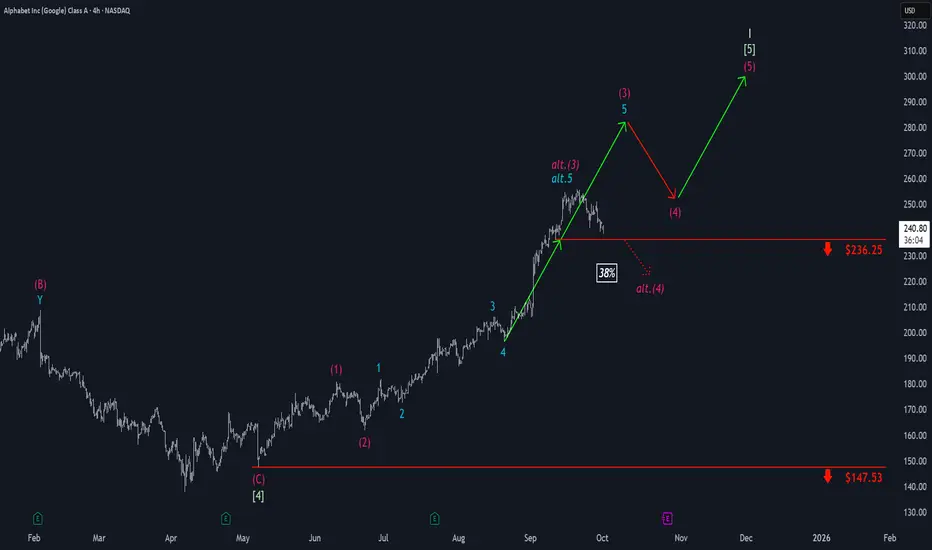
Google: Uptrend StallingFor Google, upward momentum has faded recently, with price edging closer to support at $236.25. If the stock drops below this level, we will need to consider magenta wave alt.(3) as already complete and anticipate an earlier—and lower—wave alt.(4) low (probability: 38%). However, our primary expectation remains for a higher high as the regular wave (3) progresses, with the wave (4) retracement holding above $236.25. With wave (5), waves in green and I in beige should ultimately conclude at new all-time highs.
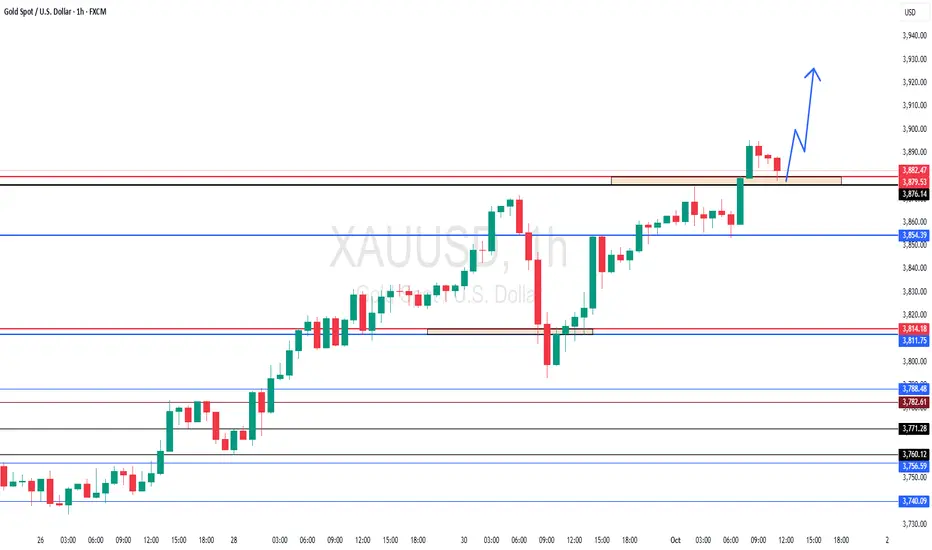
GOLD at immediate Support ? whats next??#GOLD.. perfect move as per our couple of ideas regarding gold and now again market make a immediate supporting area that is around 3876 to 3880
keep close that region and if market staying above that means there is further roam to upside,.
good luck
trade wisely
AVAX: Wave Count Adjusted for AVAX After 20% Drop Avalanche (AVAX) has pulled back about 20% from its recent peak since our last update, prompting us to adjust our wave count. At present, we see the coin in green wave , which is subdivided into a beige (a)-(b)-(c) three-part move, with wave (c) currently in progress. Once it bottoms out, wave should also be complete. From there, we expect wave to push AVAX above the newly established resistance at $36.19.

Coca-Cola: Support BreachedAfter nearly two weeks of indecision, Coca-Cola shares have now slipped below the $66.05 support level. In the near term, we expect further declines as part of the final wave (c) of the blue three-wave pattern, which should complete the broader corrective wave X in turquoise, just above the $60.62 support. After this, we anticipate a trend reversal, with the stock advancing in the final upward leg of the large beige wave III, targeting the beige short zone between $76.58 and $81.51. The peak of this third wave is likely to be established within this range before a significant correction sets in. Alternatively, it’s possible that beige wave alt.III has already concluded (probability: 39%). This scenario would be confirmed by a break below the $60.62 level.

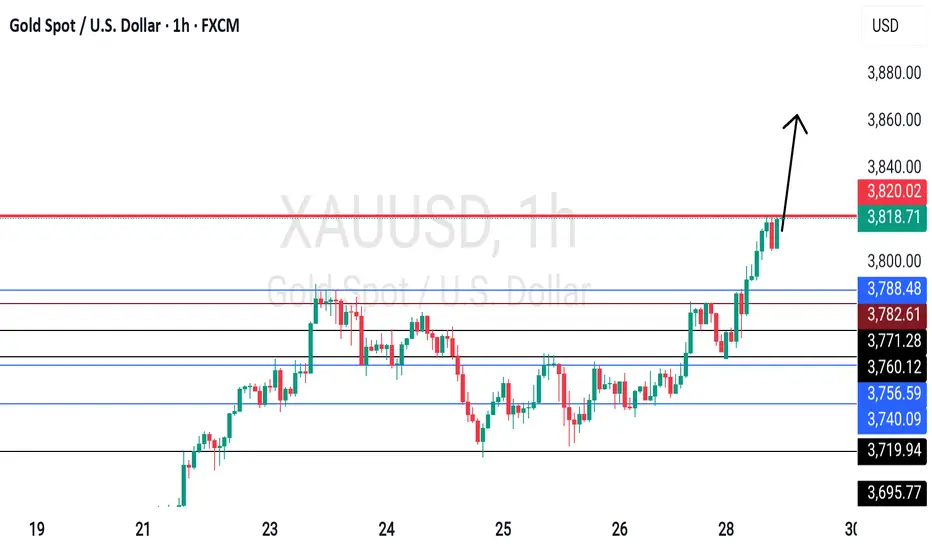
GOLD Breakout Resistance ? What's next??#GOLD.. market just broke his resistance n sustain above.
Now it should stay above 3822-14
Then further rise expected.
Good luck
Trade wisely
ETH : Accumulation Before Next Big Rally??Ethereum continues to show strength on the weekly timeframe.
Weekly structure remains firmly bullish, IMO. Pullbacks are natural, but the weekly structure favors continuation.
Weekly closing about 4.2-4.3K could trigger massive rally on weekly TF.
Chart is self explanatory. This is purely my interpretation of the chart and it could go wrong.
Note: This post reflects my personal views for educational purposes. It is not financial advice. Always DYOR before making any and every decision.

S&P500: More Upside Likely Before PullbackThe North American Mass Index kicked off the new week with some momentum, extending its climb within the ongoing magenta wave (3). For now, we anticipate this upward trend could continue before reaching a new high. Afterward, we expect a pullback as part of the subsequent wave (4), likely bringing the index into the magenta long Target Zone between 6,283 and 5,781 points. In our view, this price range offers attractive opportunities for long positions, as wave (5) is expected to follow—potentially pushing the index significantly higher and completing the larger blue wave (III). To protect newly established long positions, a stop can be set 1% below the lower boundary of the Target Zone.

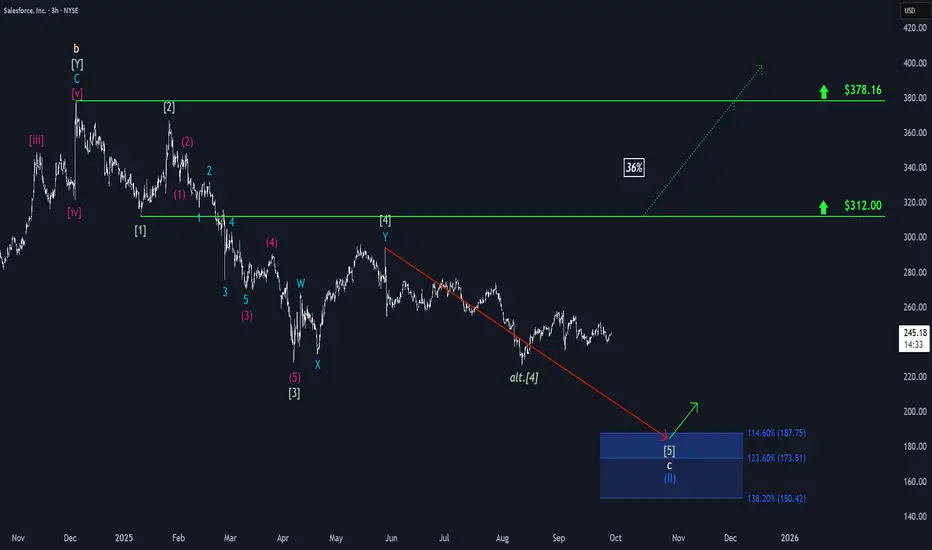
Salesforce: Trading SidewaysSalesforce has struggled to gain clear momentum in either direction over the past two weeks, which has resulted in mostly sideways trading. Looking ahead, we continue to anticipate renewed downward pressure in the near term, which could push the stock into our blue Target Zone between $187.75 and $150.42, thereby completing the broader correction of blue wave (II). After this move, we expect a new upward trend to emerge, which makes the blue zone an attractive entry point for long positions. For risk management, a stop can be placed 1% below the lower boundary of the zone. However, there remains a 36% chance that CRM will not reach our Target Zone and instead will break out directly above resistance at $312, potentially surpassing the higher $378.16 level as well. In that scenario, we would place the stock in a broader (green) upward impulse.
BCH 4H Trade IdeaMarket is doing recovery and I have find opportunity on BCH. Entry & Exit point are given. NFA. DYOR.

XAUUSD - MARKET CONTEXT I SEP/29/2025-After yesterday’s PCE session, gold continues to maintain its bullish structure and is currently trading around 3816.
-Defensive flows remain in place as the USD has yet to show a strong recovery.
-On the H1/H4 chart, gold is still in a clear uptrend, consistently forming Higher Lows.
🔎 TECHNICAL ANALYSIS
📊PRICE STRUCTURE
Main trend: Bullish
Key support zones:
3795 – 3800 (Liquidity + Old High zone) → critical retest zone if price pulls back.
3780 – 3785 (PoC zone) → confluence with the rising trendline.
Resistance zone:
3828 – 3830 (Liquidity zone & short-term resistance).
If broken, the next target could be 3845 – 3850.
📊VOLUME PROFILE
Current POC: around 3780, acting as strong support.
VaH: 3803 – 3805 → if price holds above this area, the bullish trend remains dominant.
📊PRICE ACTION
After a strong rally, the market may consolidate sideways around 3810 – 3820 before breaking out.
If 3795 is broken, gold may retest 3780 before recovering.
🟢 SCENARIO 1 – BUY PULLBACK AT SUPPORT
Entry: 3795 – 3800 or 3780 – 3785 (Liquidity + Old High + POC zone).
SL: below 3770
TP1: 3825
TP2: 3845
TP3: 3855+
✅ Rationale:
Confluence of Old High + Liquidity + rising trendline.
Main structure still shows Higher Low – Higher High → prioritize buying dips at support.
Declining volume during pullbacks → high probability of rebound.
🟡 SCENARIO 2 – BUY BREAKOUT
Entry: When H1 candle closes above 3828 – 3830.
SL: below 3810.
TP1: 3845
TP2: 3860+
✅ Rationale:
This is short-term resistance.
If broken with strong volume, the market will confirm a new bullish structure.
A successful breakout could extend targets toward 3850 – 3860.
📌 STRATEGY SUMMARY
Prioritize BUY with the main trend at support (3795 – 3800 / 3780 – 3785).
Consider BUY BREAKOUT if H1 closes above 3830.
⚠️ Disclaimer:
This analysis is for educational and informational purposes only and should not be considered financial advice. Trading in financial markets involves significant risk, and you should only trade with capital you can afford to lose. Always do your own research before making any trading decisions.

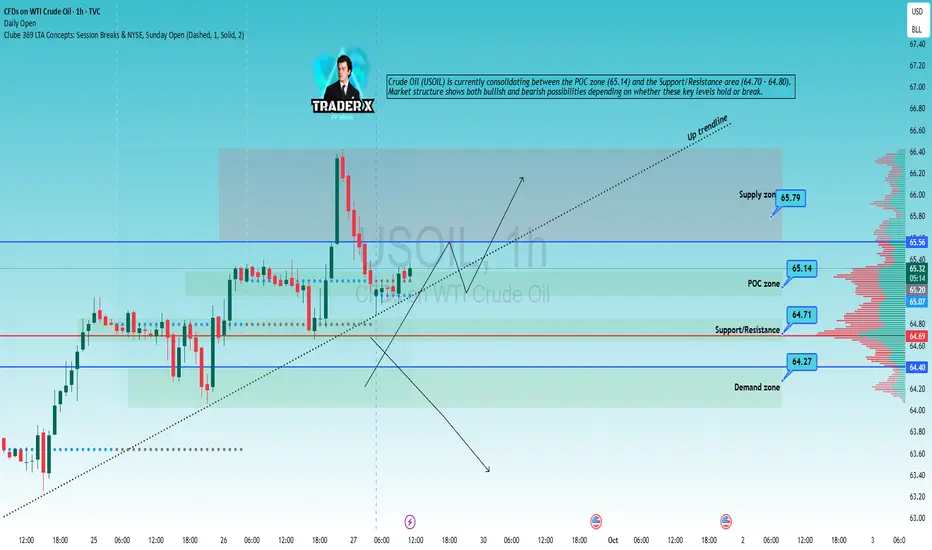
USOIL H1 – Trading Plan I SEP/29/2025Crude Oil (USOIL) is currently consolidating between the POC zone (65.14) and the Support/Resistance area (64.70 – 64.80). Market structure shows both bullish and bearish possibilities depending on whether these key levels hold or break
Here are 4 possible scenarios with entry signals to watch:
📊 Scenario 1 – Rebound from Support/Resistance
Watch zone: 64.70 – 64.80 (Support/Resistance).
Price action: Bullish reversal candlestick (Pin bar, Bullish engulfing) with volume confirmation.
Trading signal:
👉 Buy around 64.70 – 64.80
🎯 TP1: 65.14 (POC zone)
🎯 TP2: 65.56 – 65.79 (Supply zone)
⛔ SL: below 64.40 (Demand zone).
📊 Scenario 2 – Breakout above Supply Zone
Watch zone: 65.56 – 65.79 (Supply zone).
Price action: H1 candle closes above 65.80 with strong volume.
Trading signal:
👉 Buy breakout above 65.80
🎯 TP1: 66.20
🎯 TP2: 66.80
⛔ SL: below 65.40.
📊 Scenario 3 – Breakdown of Support/Resistance
Watch zone: 64.70 – 64.80.
Price action: H1 candle closes below 64.70 with strong bearish momentum.
Trading signal:
👉 Sell on pullback to 64.70
🎯 TP1: 64.40 (Demand zone)
🎯 TP2: 63.80
⛔ SL: above 65.10.
📊 Scenario 4 – Breakdown of Demand Zone
Watch zone: 64.20 – 64.40 (Demand zone).
Price action: H1 candle closes below 64.20 with increasing volume.
Trading signal:
👉 Sell breakout below 64.20
🎯 TP1: 63.60
🎯 TP2: 63.00
⛔ SL: above 64.60.
👉 Summary:
Holding above 64.70 favors Buy setups.
Breaking below 64.70 favors Sell setups.
Key short-term battle zone: 65.56 – 65.79 Supply area.
⚠️ Disclaimer:
This analysis is for educational and informational purposes only and should not be considered financial advice. Trading in financial markets involves significant risk, and you should only trade with capital you can afford to lose. Always do your own research before making any trading decisions.
ZEC 4HZEC Looks bullish here. Broke trendline on 4H timeframe. We can expect the targets as shown on the charts. NFA DYOR

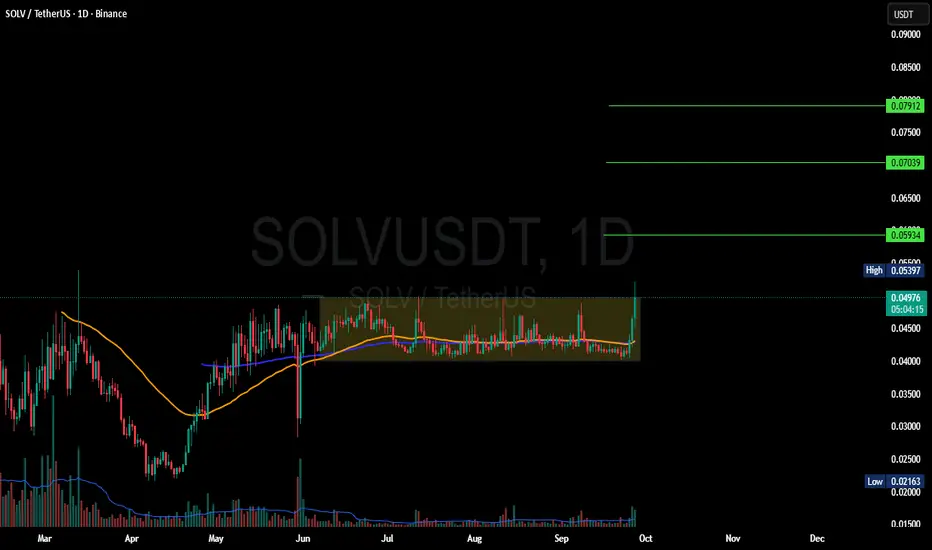
SOLV 1D AnalysisSolv is breaking out the accumulation zone on daily TF. Daily close above the BOX can lead it higher. Expected targets are given on the chart. NFA DYOR.
I'm still long biased @ $XAUUSD (but deleveraging)Technical View
A potential bullish cup & handle pattern is forming, often seen as a continuation signal.
Price has already broken out of a bearish channel, which suggests that buyers have taken control.
Triangle and wedge formations point to pressure building upward.
The broader macro channel remains intact, so the larger trend has not been broken.
Clear invalidation levels are visible near 3,730 and 3,612, which provides trade structure from a technical perspective.
Overall, the technical picture continues to lean bullish.
Macro View
US CPI remains sticky while jobless claims are softening, hinting at stagflation dynamics.
The Federal Reserve is under pressure to cut rates, with real interest rates already negative.
Historically, when real rates are negative, gold tends to outperform bonds as a store of value.
Global central banks remain net buyers of gold as they diversify away from Treasuries.
This combination is similar to the 1970s stagflation backdrop: falling rates with inflation uncertainty often encouraged capital flows into gold.
Opinion
Technicals suggest upward momentum. Macro factors also support a bullish bias. The main caveat is that positioning in gold is already heavy, which can lead to sharp short-term volatility. Directionally, however, the long bias aligns with both the charts and the macro backdrop.
Disclaimer
This post reflects only my personal market observations and opinions, shared for educational and informational purposes. It should not be considered financial advice, investment recommendation, or a call to action. Trading financial markets involves risk, and you should carefully assess your own situation and risk tolerance before making any trading decisions. Past performance or historical patterns do not guarantee future results. Always do your own research and consult a licensed financial professional if needed.

Master Horizontal Lines on Trading Charts | Signal & Structure 2In this second episode of the Signal and Structure series, we dive deep into one of the most fundamental yet powerful tools in technical analysis - horizontal support and resistance lines. This practical tutorial demonstrates a systematic approach to identifying and marking key price levels across multiple timeframes.
What You'll Learn:
Color-Coded Line System for Multiple Timeframes:
Monthly (Black, thickness 4) - The strongest levels from monthly candle closes
Weekly (Maroon/Brown, thickness 3) - Key weekly support/resistance zones
2-Day (Red, thickness 2) - Intermediate term levels
12-Hour (Orange, thickness 1-2) - Short-term trading levels
3-Hour (Yellow, thickness 1) - Day trading reference points
Key Concepts Covered:
Why monthly candle closes often matter more than wicks (with live examples)
How previous resistance becomes new support - demonstrated on Bitcoin's chart
Identifying distribution and accumulation ranges using horizontal levels
The importance of avoiding chart clutter - when NOT to add more lines
Using transparent candles to see through to your levels and indicators
Practical Techniques:
Live demonstration on TradingView using Bitcoin/USD charts
How to identify the most significant levels from each timeframe
Creating "boxes" to visualize trading ranges and distribution zones
Brief introduction to Wyckoff theory concepts (spring patterns)
Tips for maintaining clarity when working with multiple overlapping levels
Chart Setup Tips:
Why exchange charts (KuCoin, Gate.io) provide better volume data than index charts
Continuing emphasis on logarithmic scale for crypto analysis
How to organize your workspace for multi-timeframe analysis
This 20-minute tutorial walks you through the exact process of building a professional-grade support and resistance framework on your charts. The presenter demonstrates each concept in real-time on TradingView, making it easy to follow along and implement these techniques immediately.
Perfect for traders who want to move beyond random line drawing and develop a systematic, color-coded approach to identifying key market levels. Whether you're scalping on the 3-hour or position trading on the monthly, this hierarchical system helps you see exactly where the important levels are at a glance.
Next episode preview: Diagonal trend lines, channels, and Fibonacci levels - including a unique approach to stacking channels that provides an edge in the markets.

BTCUSDT (H1) – Trading ScenariosScenario 1 – Rebound from Demand Zone
The demand area at 108,500 – 108,700 remains the strongest short-term support.
If bullish reversal patterns (Pin Bar, Bullish Engulfing) form here with confirming volume, a rebound is likely.
Trade Setup: Enter long around 108,600 – 108,700, targeting 109,800 (PoC) as the first objective, and 111,900 – 112,100 (VAH) as the second.
Stop Loss: Below 108,300.
Scenario 2 – Consolidation around PoC
The PoC area at 109,400 – 110,200 represents the equilibrium zone where price may consolidate.
In this case, short-term scalping strategies can be applied: buying near the lower bound (109,400) and selling near the upper bound (110,200).
Take Profit: Quick targets of 30–50 USD.
Stop Loss: 0.3–0.5%, depending on position sizing.
Scenario 3 – Breakout above VAH
A decisive close above the 111,900 – 112,100 (VAH) zone would confirm bullish continuation.
This breakout would likely attract momentum buyers and trigger stop orders.
Trade Setup: Place buy stops at 112,150 – 112,200, aiming for 112,800 as the first target and 113,500 (liquidity zone above) as the second.
Stop Loss: If price falls back below 111,700.
Scenario 4 – Breakdown of Demand Zone
If price closes firmly below 108,500 with high volume, it signals bearish continuation.
Such a breakdown opens the path to lower liquidity levels.
Trade Setup: Enter short via sell stops at 108,450 – 108,500.
Targets: 107,800 initially, followed by 106,500.
Stop Loss: Above 108,900.
✅ Summary
Bullish setups: Buy from 108,600 – 108,700 (Demand Zone) or on breakout above 112,100.
Bearish setups: Sell if 108,500 breaks, or look for rejection signals near 113,000.

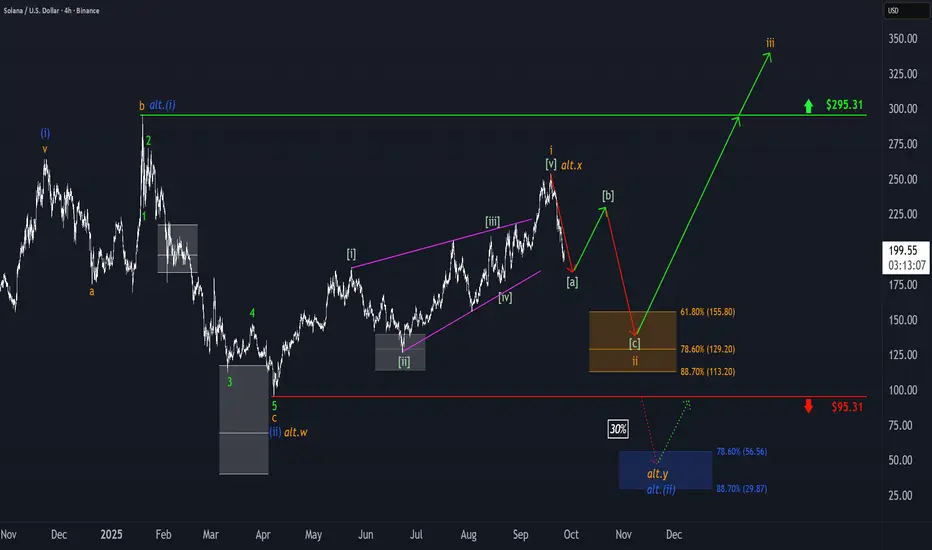
Solana: Target Zone in FocusSOL has dropped more than 20% from last Thursday’s high. In light of this, we now believe that last week’s high—reached on Thursday—marked the top of wave i in orange, and that price is currently undergoing a wave ii corrective phase. This correction should play out as a downward, three-part move labeled - - in green, ultimately targeting our orange zone between $155.80 and $113.20. We expect the low of this wave ii to occur within that Target Zone, which should set the stage for a bullish reversal. The following wave iii in orange is projected to push SOL to new all-time highs, breaking through resistance at $295.31.