Nifty 23500 Either buying opportunity or just short covering !today on 13 June nifty again support on 23500 which is talking by us very important support level, look at here ultra-high volume appear on 9.15 candle, and we are seeing bounce back from here. it could become a good opportunity buy on dips but if really smart money pending order near 23500 so why this bounce back come with falling volume, I cleared on chart it might be just short covering. what is your opinion comment please.
Chartanalysis

GBPCAD SHORT FORECAST Q2 W24 D13 Y25GBPCAD SHORT FORECAST Q2 W24 D13 Y25
Professional Risk Managers👋
Welcome back to another FRGNT chart update📈
Diving into some Forex setups using predominantly higher time frame order blocks alongside intraday confirmation breaks of structure.
💡Here are some trade confluences📝
✅Weekly highs POI
✅1H order block rejection
✅4H order block rejection
✅15’ order block identification
🔑 Remember, to participate in trading comes always with a degree of risk, therefore as professional risk managers it remains vital that we stick to our risk management plan as well as our trading strategies.
📈The rest, we leave to the balance of probabilities.
💡Fail to plan. Plan to fail.
🏆It has always been that simple.
❤️Good luck with your trading journey, I shall see you at the very top.
🎯Trade consistent, FRGNT X

BEST XAUUSD M30 BUY SETUP FOR TODAYGold (XAU/USD) is showcasing strong bullish momentum after breaking above the key resistance zone near $3,404, now acting as fresh support. 🔄 The price formed a bullish structure with clean higher highs and higher lows on the 30-minute chart, confirming buying strength. 🟣 The marked demand zone around $3,392–$3,404 is critical—if price retests and holds this level, we can expect a continuation toward $3,420 and beyond. 🚀📌 Traders should watch for bullish confirmations on pullbacks to this zone for potential long setups. 🧠⚡

BTC/USDTDo you think Bitcoin has just formed a double top, or is it showing a different pattern? Personally, I think we might range a bit from here and then possibly continue the uptrend. I'm not really into pattern trading—so you tell me, are we bullish or bearish?"

Visa: Resistance ApproachingThe next key step for Visa should be overcoming resistance at $394.49 during magenta wave . However, if support at $339.61 fails to hold, our alternative scenario (33% probability) will be activated—suggesting the recent high already marked the end of the corrective wave alt. in magenta. In that case, a renewed decline below the $299 mark would be likely, aiming to complete the alternative turquoise wave alt.4 on a larger scale.
📈 Over 190 precise analyses, clear entry points, and defined Target Zones - that's what we do.

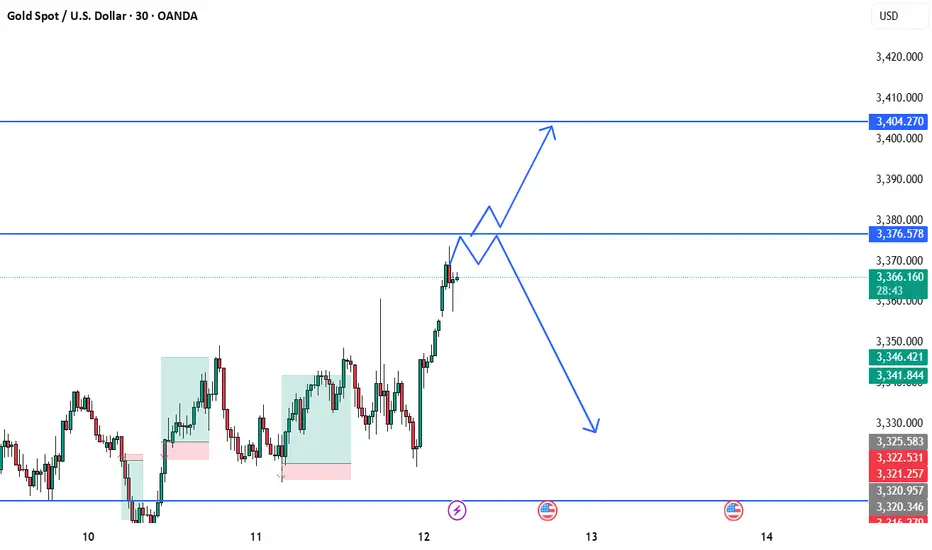
BEST XAUUSD M30 BUY AND SELL SETUP FOR TODAY Gold has shown a strong bullish push, breaking above recent consolidation and approaching a key resistance zone around $3,376. ⚔️ This area will be decisive — if price holds above it and confirms support, we could see a further rally toward $3,404. 📈✨ However, failure to sustain above this level could trigger a bearish rejection, pulling the market back toward the $3,330–$3,340 range. 📉🔄 Traders should wait for clear price action confirmation before entering. React, don’t predict! 🎯🧠
BEST XAUUSD M30 BUY SETUP FOR TODAYPrice is showing signs of bullish strength after reclaiming key demand zones near 3,310.926–3,315.098 🟦. The recent CHoCH (Change of Character) and strong bullish reaction from the demand block suggests a potential move toward the 3,360 resistance area 🔼. Buyers are likely stepping in with momentum, aiming for a break above previous highs 📉➡️📈. As long as price stays above the 3,315 support, the bullish scenario remains valid — watch for continuation toward higher highs. 🚀💹

S&P500: Within reachThe S&P 500 has edged past the 88.70% retracement and is now trading within our magenta Target Zone (Coordinates: 5,880 points to 6,166 points). This places magenta wave (B) likely near its peak - a move that could soon give way to a sharper decline as part of the anticipated wave (C). At current levels, the setup remains favorable for initiating short positions. To manage risks, a stop just 1% above the upper boundary of the Target Zone is recommended. If the index breaks above resistance at 6,6675 points, however, we would shift to an alternative interpretation: a bullish continuation in the form of the wave alt.(III) in blaue. We currently assign a 40% probability to this scenario. One final note: the minimum technical requirement for wave (B) has already been fulfilled by the entry into the Target Zone. This means wave (C) could begin any time.
Over 190 precises analyses, clear entry points and defined Target Zones - that's what we do.

₿ Bitcoin: Further Upside ExpectedBitcoin (BTC) pulled back slightly in yesterday’s session but remains on track to continue its corrective rally within green wave B. In line with our primary scenario, this advance is expected to reach the blue Target Zone between $117,553 and $130,891. Afterward, we anticipate the onset of wave C, which should initiate a substantial decline—driving the price down into the lower blue zone between $62,395 and $51,323. This is also where we expect orange wave a to conclude. From there, wave b should provide a temporary rebound before wave c resumes the broader downtrend, ultimately completing blue wave (ii). That said, there’s still a 30% probability that blue wave alt.(i) has not yet topped. In this alternative scenario, BTC would extend higher, potentially breaking above resistance at $130,891 before the corrective phase resumes. The daily chart illustrates the entire five-wave blue sequence and shows our expected low for wave (ii) within the blue zone between $37,623 and $26,082.
📈 Over 190 precise analyses, clear entry points, and defined Target Zones - that's what we do.

Caterpillar: Countertrend ActionCaterpillar’s green wave has further room to run. However, this rise represents only an internal countertrend – the broader correction in beige wave IV is still ongoing. Under our primary scenario, we expect the price to form another low before launching into a sustained advance, which should ultimately push above resistance at $409.40. Meanwhile, our alternative scenario—carrying a 38% probability—suggests that beige wave alt.IV has already bottomed. If that’s the case, the correction is complete, and a direct breakout above $409.40 could follow.
📈 Over 190 precise analyses, clear entry points, and defined Target Zones - that's what we do.

BONK/USDTThis time, we reached a resistance area for this currency and I think this currency has the potential to be bullish. I have specified the target for you. Remember, this is an analysis, not an entry point. Tell me your opinion.

TMGH Rebound AnalysisTMG Holding trend is reaching a new peak zone at the resistance line 58.624. Historically, it is expected to rebound to the support line at 58.538, then the support line 58.452 and finally 56.734. In conclusion, it increased by 0.17%.

₿ Bitcoin: Push to the Upside! Bitcoin has made a significant push to the upside, which brought it closer to the upper blue Target Zone between $117,553 and $130,891, where we primarily expect the corrective rise of green wave B to conclude. We consider this price range an opportunity to take partial profits or to open short hedges for tactical protection of existing long positions — thus, we don't plan to sell all our Bitcoin holdings there. Potential short hedges could be secured with a stop 1% above the upper edge of the zone since there's a 30% chance that price could exceed this zone to develop a new high for blue wave alt.(i) before reversing later. Primarily, however, green wave C should commence in the upper blue zone and drive BTC down into the lower blue zone between $62,395 and $51,323—and thus to the low of orange wave a.
📈 Over 190 precise analyses, clear entry points, and defined Target Zones - that's what we do.

Tencent: Searching for Wave A’s LowTencent’s corrective A-B-C structure is struggling to finish wave A. Our primary scenario calls for a drop toward support at HK$364.80, where wave A should bottom. That should open the door for wave B, followed by a deeper leg down in wave C—into the magenta Long Target Zone between HK$325.60 and HK$229.00. This zone should mark the completion of wave (2), setting up a long-term bullish reversal in wave (3), which may eventually target resistance at HK$715. However, if price breaks below HK$188.60, our wave alt. scenario will take over (36% probability), signaling an even deeper low before the next bullish impulse.
📈 Over 190 precise analyses, clear entry points, and defined Target Zones - that's what we do.

EURJPY Technical Breakdown (MMC Strategy) : Target Zone 🧠 Concept Focus: MMC – Mirror Market Concept
The Mirror Market Concept (MMC) helps identify pattern inversions, price reflection zones, and structural symmetry that hint at upcoming market turns. This chart reflects a curve-based reversal logic rooted in smart money behavior, volume analysis, and pattern exhaustion.
📊 Technical Structure Breakdown
🔹 1. Volume Contraction + Breakout (June 6–7)
Early signs of bullish pressure were detected with volume contraction, forming a tight range wedge/triangle.
This is often a liquidity trap where weak hands sell into strength.
Smart money absorbed sell-side liquidity before impulsively breaking out.
This is a common MMC move: contract > trap > expand.
🔹 2. 50% Area Used – Smart Money Trap (June 9)
After the breakout, price tapped into the 50% equilibrium zone of the previous major move.
This level often acts as a liquidity sweep zone, ideal for smart money to unload or build counter positions.
The rejection wick here confirms that institutional traders reacted at this level.
🔹 3. Curve Bending Pattern – Exhaustion in Play
The market has now entered a curve bending phase, visible with the arching price movement.
This signifies momentum exhaustion, where bullish attempts get weaker.
Think of this curve like a mirror ceiling — as each high gets tapped, it bends, showing the market can't sustain higher levels.
🔹 4. Next Reversal Zone (Projected Target: ~164.150–164.200)
Based on MMC symmetry and previous demand zones, the area highlighted as Next Reversal is a key structure zone.
This is where we expect price to react — either bounce (for buyers) or break (for continuation shorts).
A clean bounce here could mirror the earlier pattern in reverse, hence the Mirror Market Concept.
🔁 Summary of Market Psychology
🧲 Volume contraction signals manipulation.
🎯 50% zone rejection shows trap completion.
🪞 Curve bending shows buyers losing strength.
🔻 Price likely to drop into the reversal zone, completing the mirror leg.
🧩 What Traders Should Watch
Indicator/Zone Notes
50% Area Used Smart Money Exit or Entry Trap
Curve Bending Reversal Geometry (Momentum Exhaustion)
Next Reversal Zone Smart Money Demand Zone (~164.150)
Break Below 164.100 Confirms deeper bearish continuation
🎯 Trading Strategy Outlook
🔍 Short Bias: Look for confirmation (e.g., bearish engulfing, BOS on lower TFs) to enter shorts below curve zone.
🛑 Invalidation Level: Clean breakout above 165.500 would invalidate the mirror structure and shift to continuation long.
🎣 Reversal Scouting : If price respects the Next Reversal Zone, there could be a potential long scalp back into mid-range.
🧠 Educational Note: MMC in Action
The Mirror Market Concept is powerful for intraday trading. It uses pattern reflection, liquidity logic, and price symmetry to forecast reversals before typical indicators catch up. If mastered, this concept can give early reversal entries and trap avoidance.

EURUSD Analysis (MMC Strategy) : Structure Mapping + Target🧠 Overview
This analysis is based on the MMC (Market Mapping Concept), combining smart money principles, structure mapping, and price behavior analysis. EUR/USD has been showing strong bullish activity over the past few months, but we are now approaching a critical decision zone. Let’s break it all down.
🔹 1. Arc Structure – Accumulation Phase (Dec 2024 – Feb 2025)
The chart starts with a well-defined Arc formation, signaling accumulation by large players.
Price showed a series of higher lows within the arc, compressing volatility.
This is where smart money quietly loads positions before pushing price.
Key Insight: This arc often precedes an impulsive breakout, as seen next.
🔹 2. Central Zone Breakout (Feb – Mar 2025)
The price exploded out of the arc, breaking through the central compression area.
Marked as the Central Zone, this acted as both support and a launchpad.
This phase included imbalance filling, reaccumulation, and clean price action.
Observation: Notice the aggressive bullish candles—clear indication of institutional interest.
🔹 3. Structure Mapping & QFL Zone (April 2025)
A classic QFL (Quick Flip Level) was formed after the initial rally.
Price pulled back into a structure support zone, respected it cleanly, and bounced back.
This gave a textbook smart money entry.
Structure Mapping highlights how each leg of the trend is forming based on supply/demand reaction.
🔹 4. Major BOS – Break of Structure (May 2025)
Price broke the previous swing high, giving us a Major Break of Structure.
This BOS confirms a change in character (CHOCH) from ranging to trending.
After BOS, the market retested the breakout zone—providing a second ideal long entry for continuation traders.
🔹 5. Minor Resistance Zone (Current Price)
Currently, price is testing a Minor Resistance zone around 1.1400–1.1450.
This level acted as resistance earlier and may slow price down temporarily.
However, there’s still room for bullish continuation unless reversal patterns emerge.
Key Watch Point: If price shows weakness here (e.g., rejection wicks, bearish engulfing), short-term retracement may follow.
🔹 6. Next Reversal Zone (Projected Target: 1.1700–1.1800)
The green box above marks the Next Reversal Zone, based on historical supply, Fibonacci extension levels, and structure analysis.
Expect this area to act as strong resistance unless momentum is very strong.
This is a potential TP zone for long traders or an area to scout for short opportunities if reversal signals appear (divergence, order block rejection, liquidity grab).
📌 Key Levels
Zone Price Range Role
Central Zone 1.0800–1.1000 Support/Accumulation
Minor Resistance 1.1400–1.1450 Immediate Hurdle
Next Reversal Zone 1.1700–1.1800 Target / Short Setup
QFL Zone 1.1100–1.1200 Smart Money Entry Point
🧠 Strategy Outlook
✅ Bullish Bias: Structure is clearly bullish. Buyers are in control.
🕵️♂️ Watch for Reaction at Minor Resistance – a clean break = continuation, rejection = short-term pullback.
