Chart Patterns

bearish analysis of Super Micro Computer Inc. (SMCI)Here's a bearish analysis of Super Micro Computer Inc. (SMCI), with a focus on identifying a potential re-entry point below $20.28:
#📉 Bearish Analysis of SMCI with Buyback Target Below $20.28
1. 🕯️ Technical Breakdown
- **Current Price**: $30.12, showing weakness with a minor drop of -0.13%.
- **Trend Indicators**: The chart displays declining momentum, with red bands signaling bearish pressure.
- **Moving Averages**: Price action is below key moving averages, suggesting a downtrend continuation.
- **Volume**: 25.03M — elevated volume near resistance zones may indicate distribution rather than accumulation.
2. 📊 Support & Resistance Zones
- **Immediate Resistance**: $32.00 and $38.23 — price has failed to reclaim these levels.
- **Support Levels**:
- $24.00: Minor support, already breached in past cycles.
- $20.28: Psychological and technical threshold — a break below this could trigger panic
selling.
- **Target Zone**: $16.00–$18.00 — historical support and potential re-entry zone for value buyers.
3. 🔍 Bearish Catalysts
- **Sector Rotation**: Tech stocks are showing mixed performance; SMCI may be underperforming relative to peers like NVDA and GOOG.
- **Valuation Compression**: If earnings disappoint or growth slows, SMCI could reprice toward its lower support band.
- **Market Sentiment**: Broader tech sentiment is cautious, with META and INTC showing notable declines.
4. 🎯 Buyback Strategy
- **Ideal Re-entry Range**: $18.00–$20.00
- **Confirmation Criteria**:
- Oversold RSI below 30
- Bullish divergence on MACD
- Stabilization in volume near support
Subscribe to TSXGANG guys! Enjoy!
This information are not mean to be financial advices or any trading strategy. You are responsible for your own decision.

GBPJPY BULLISH MOMENTUMwith the current bullish trend and the close of monday as bullish
expecting Tuesday to make some reversal into modays open then possible movement to the upside just my point of view
your ideas are welcomed

Xauusd UP(Educational | Non-Executable | Peace-Driven)
Market: Gold (XAUUSD)
Context: Multi-Timeframe Market Observation
Intent: Educational & Conceptual Analysis
⸻
Market Structure
Gold continues to trade within a constructive bullish structure on higher timeframes.
Price behavior shows:
• Trend-aligned movement
• Controlled pauses after strong impulses
This reflects market balance, not randomness.
⸻
Price Behavior & Liquidity (Conceptual View)
Markets naturally revisit prior activity zones where participation previously occurred.
This behavior represents:
• Re-engagement
• Order balancing
• Healthy price discovery
Such movements are a normal part of market mechanics.
⸻
Time & Market Rhythm
Price does not move linearly.
Instead, it progresses through cycles of expansion and pause.
Current behavior suggests:
• A short-term pause
• Within a broader trend framework
Patience and structure awareness remain key.
⸻
Risk & Responsibility
This insight intentionally avoids:
• Trade execution details
• Specific price levels
• Time-based instructions
Its purpose is to encourage:
• Independent thinking
• Risk awareness
• Calm decision-making
⸻
Educational Conclusion
As long as the broader structure remains intact, gold continues to reflect trend-consistent behavior.
Short-term fluctuations should be seen as part of market rhythm, not emotional triggers.
Markets reward understanding — not fear.

Higher High for SPXBut still with bearish divergences. Some mega cap stocks to me still look bearish.
At the end of the day was a small sell off - let's see if it gains momentum tomorrow. good luck

BTCUSD: Triangle Compression After Trendline BreakHi!
Bitcoin broke the long-term descending trendline, but instead of expanding, the price moved into a large triangle range. This shows hesitation; the market is building energy, not trending yet.
Current structure:
Broken downtrend → consolidation
Clear triangle with rising support and horizontal resistance
Key levels & scenarios:
Bullish scenario:
If price breaks and holds above the top of the triangle (93,500–94,000)
→ First target: 99,200
→ Extension target: 104,400
Bearish scenario:
If price loses the rising trendline support
→ Downside opens toward 81,300
For now, this is a wait-for-breakout structure. Direction will be decided only after a clean break, patience matters here.
Disclaimer: As part of ThinkMarkets’ Influencer Program, I am sponsored to share and publish their charts in my analysis.


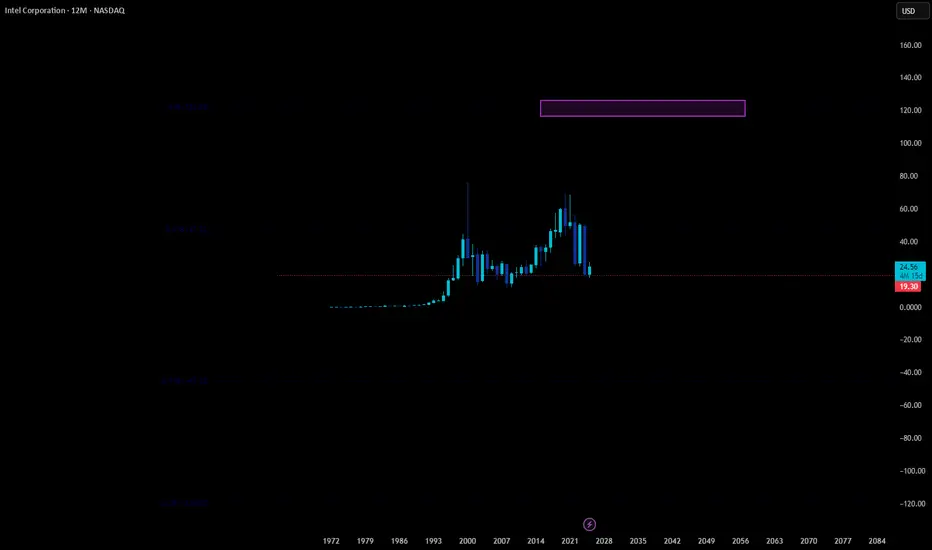
$120 Intel in the next few yearsI bought intel 20 minutes before the news a couple days ago. Very lucky timing! But I dont plan on selling until we hit $120. $40 is tested. Could see some downward pressure before we see trend reverse.
AudNzd Trade IdeaAudNzd currently trending in a bullish range. Price is currently at a 1hr HL with the 15m time frame flipping from bearish to bullish. I personally entered some longs with stops just below structure. Looking for price to continue the bullish range with targets just above for a 1:3 risk to reward. We'll see what happens.

XAUUSD:Start shortingThe gold short strategy sent out today is now in profit, and a short-term top is starting to form.
From the current 1-hour chart of gold, the short-term resistance of gold is around 4635, and the support below is around 4560. The speed of the rise has slowed down. Moreover, I analyze that gold will experience a downward correction in the short term. It is expected that the decline will start when it reaches the range of 4635-4650, and we can start preparing to go short.
Gold trading strategy for today:
xauusd sell@4635-4650
TP:4590-4570
I will provide accurate signals every day for a month. All signals will be accurate, so don't miss them. If the market changes, I will provide further updates.

XAU/USD Analysis: The Liquidity Sweep & ReversalGold has out a liquidity sweep on the 1H timeframe, signaling a potential short-term reversal. After an aggressive rally to new highs, we witnessed a "stop hunt" where price briefly pierced the previous structure to clear out liquidity before immediately rejecting. This false breakout suggests that institutional sellers are stepping in to trap late buyers, creating a probable setup for a corrective move lower.
While the broader trend remains undeniably bullish due to ongoing fundamental catalysts, this technical exhaustion points to a mean reversion trade. We are eyeing a pullback toward the origin of the recent impulse leg, specifically targeting the demand zone around $4,490–$4,500. Traders should watch for a confirmed rejection at current levels ($4,610–$4,630) to validate the bearish bias, keeping a tight invalidation point above the recent sweep high to manage risk against the strong prevailing trend.
OANDA:XAUUSD

Gold Analysis & Trading Strategy | January 13-14
🔥Congratulations to members who followed our trading strategy and profited over 600 PIPS!👏👏👏
✅ 4-Hour Chart (H4) Trend Analysis
1️⃣ Overall Structure: High-Level Consolidation After Spike
Gold completed a strong impulsive rally from 4274 → 4634.
Price is now consolidating around the 4600 pivot belt, entering:
➡ Spike completed → High-level consolidation → Correction digestion phase (main trend still bullish).
Recent small-bodied candles show profit-taking and distribution at highs, not a fresh trend acceleration.
2️⃣ Bollinger Bands: Upper Band Rejection → Mean Reversion
Upper band rejected price near 4660
Candles drifting toward mid-band (4531)
➡ Indicates post-spike digestion & corrective consolidation.
✅ 1-Hour Chart (H1) Trend Analysis
1️⃣ Structure: Intraday Corrective Channel
Price rejected at 4634
➡ Sideways-to-bearish corrective rhythm.
2️⃣Bollinger Bands: Mid-Band Lost → Support Test
Price below mid-band
Lower band near 4575–4565
➡ Downside test zone active.
🔴 Resistance Levels
4595 – 4602
4610 – 4623
4630 – 4650
🟢 Support Levels
4575 – 4565
4555 – 4545
4533 – 4520
✅ Gold Trading Strategy Reference
🔰 Strategy 1 — Sell on Pullbacks (Main Strategy)
📍 Sell Zone 1: 4595 – 4602
📍 Sell Zone 2: 4620 – 4630
⛔ SL: Above 4635
🎯 Targets:
TP1: 4575
TP2: 4565
TP3: 4545
TP4: 4533 – 4520
🔰 Strategy 2 — Buy the Dip (Conditional Only)
Only when stabilization signals appear:
📍 Buy Zone: 4575 – 4565
📍 Backup Zone: 4545 – 4555
⛔ SL: Below 4550 / 4545
🎯 Targets:
TP1: 4595
TP2: 4610
TP3: 4630
✅ Trend Summary
H4: Mid-term bullish but in post-spike consolidation
H1: Short-term corrective & weak — rebounds = selling opportunities
Rhythm: Sell rallies first, dip-buy only at key supports

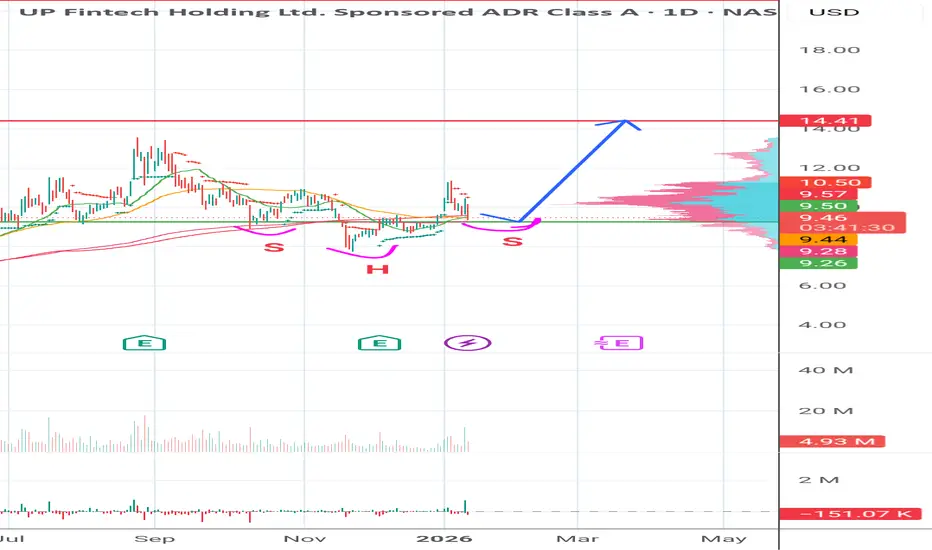
$TIGR Inverse Head And ShouldersThe stock is forming the right shoulder of an inverted head and shoulders pattern after a higher low. The price is holding above the 200 EMA, volumes are stabilizing, and sellers are weakening. A breakout and consolidation of the neckline will confirm the trend reversal.
EURUSD Will Explode! BUY!
My dear friends,
Please, find my technical outlook for EURUSD below:
The instrument tests an important psychological level 1.1635
Bias - Bullish
Technical Indicators: Supper Trend gives a precise Bullish signal, while Pivot Point HL predicts price changes and potential reversals in the market.
Target - 1.1656
Recommended Stop Loss - 1.1625
About Used Indicators:
Super-trend indicator is more useful in trending markets where there are clear uptrends and downtrends in price.
Disclosure: I am part of Trade Nation's Influencer program and receive a monthly fee for using their TradingView charts in my analysis.
———————————
WISH YOU ALL LUCK

Careful Up Here TrumpProbably goes higher, but on the long timeline this is destined to grind down to $20 or less
Always have a plan


BTC/USD: The Breakout & Critical RetestBitcoin (BTC) has successfully broken out of a key descending triangle structure on the Daily timeframe and is currently in the "Retest Phase." After weeks of compression, the price is holding above the upper trendline, testing previous resistance as new support. A successful defense of this zone would serve as strong technical confirmation for the next leg up.
Why this setup is on our radar:
Bullish Confirmation: The market has invalidated the bearish bias typically associated with descending triangles. By breaking to the upside and holding, the structure has shifted from "Correction" to potential "Continuation."
The Retest Mechanics: We are currently observing a classic "Break and Retest" scenario. This is often the highest probability entry point, as it allows traders to join the trend with a clearly defined invalidation level, rather than chasing the initial impulse.
Market Structure: As noted, the macro structure remains constructive as long as the price maintains stability above the triangle's baseline support.
Technical Levels & Plan:
Buy Zone: The current retest region (90,000 - 92,000) offers an optimal entry for trend continuation.
Invalidation Level: The bullish thesis depends on holding the structure. A breakdown followed by a retest of the triangle’s horizontal support (below ~84,500) would signal a "Fakeout" and the start of a deeper corrective leg.
Structural Resistance (Targets): Short Term: 96,000 - 102,000 (Recent Lower Highs) Mid Term: 112,000 - 120,000 (Major Supply Zones)
Macro / Moonbag: If the retest holds, we look towards a re-challenge of the ATH (128,000+) and price discovery beyond.
Risological Note: The "Retest" is the moment of truth. We do not front-run the market here; we wait for candle closures to confirm that the roof has indeed become the floor.
Disclaimer: This analysis is for educational purposes only. Crypto assets are highly volatile. This is not financial advice.

EURUSD bullish consolidation supported at 1.1630The EURUSD remains in a bullish trend, with recent price action showing signs of a consolidation within the broader uptrend.
Support Zone: 1.1630 – a key level from previous consolidation. Price is currently testing or approaching this level.
A bullish rebound from 1.1630 would confirm ongoing upside momentum, with potential targets at:
1.1700 – initial resistance
1.1743 – psychological and structural level
1.1790 – extended resistance on the longer-term chart
Bearish Scenario:
A confirmed break and daily close below 1.1630 would weaken the bullish outlook and suggest deeper downside risk toward:
1.1615 – minor support
1.1590 – stronger support and potential demand zone
Outlook:
Bullish bias remains intact while the EUPUSD holds above 1.1630. A sustained break below this level could shift momentum to the downside in the short term.
This communication is for informational purposes only and should not be viewed as any form of recommendation as to a particular course of action or as investment advice. It is not intended as an offer or solicitation for the purchase or sale of any financial instrument or as an official confirmation of any transaction. Opinions, estimates and assumptions expressed herein are made as of the date of this communication and are subject to change without notice. This communication has been prepared based upon information, including market prices, data and other information, believed to be reliable; however, Trade Nation does not warrant its completeness or accuracy. All market prices and market data contained in or attached to this communication are indicative and subject to change without notice.

MARA HoldingsNASDAQ:MARA
Perfect bounce off the 0.5 extension on the monthly timeframe.
The key question is when the 4-year range will finally break.
Next resistance is the Tenkan and 21 MA around $16.20.
Above that, the 0.618 level around $19.55 comes into play.

Symmetrical Triangle Signals an Imminent ExpansionGold is currently trading in a high-compression environment on the H1 timeframe after a strong impulsive rally that printed a fresh all-time high (ATH). Following this aggressive bullish expansion, price has transitioned into a symmetrical triangle consolidation, reflecting a temporary balance between buyers and sellers rather than a structural reversal.
The triangle is forming above the rising EMA, which is a key bullish characteristic. This indicates that the broader trend remains intact and that the current consolidation is likely a pause for continuation, not distribution. Higher lows are being respected, while lower highs reflect profit-taking and short-term supply entering the market near the ATH.
From a price action perspective, the triangle is developing after an impulsive leg higher — a classic continuation setup. Each rejection from the upper trendline has been met with shallower pullbacks, suggesting sellers are losing strength while buyers continue to absorb supply near the apex. This behavior typically precedes a volatility expansion.
The bullish scenario favors a clean breakout and acceptance above the descending trendline, which would confirm continuation toward the next upside objective near 4,648 and potentially beyond, as breakout traders and trapped shorts add momentum. Given the ATH context, upside liquidity remains largely untapped, increasing the probability of an expansion move once price escapes compression.
Alternatively, a temporary downside sweep toward the lower triangle boundary or EMA could still occur as a liquidity grab, but as long as price holds above the rising EMA and the structure remains intact, such a move would be considered corrective rather than bearish.
In summary, Gold is coiling tightly beneath ATH in a symmetrical triangle continuation pattern. The broader bias remains bullish, and the market is approaching a decisive moment where compression is likely to resolve into a strong directional move with upside continuation currently holding the technical advantage.

GBPUSD resume uptrend?GBPUSD has got rejected off the daily order block with multipel liquidity sweep on the daily support level.
4H timeframe has crossed over 20ema and 10ema with multiple rejection off the key support level.
Daily down move previous week that was a full breakdown to daily order block which is a signal of potential rejection fromt he support level.
Therefore it is high probability price may continue to rise upto the daily resistance level.

BTCUSD at a Decision Point On the H1 timeframe, Bitcoin is currently trading inside a clear liquidity-driven range, where both upside and downside scenarios remain technically valid, but the market is approaching a decision zone. After the prior impulsive sell-off, price formed a base at the lower range and gradually transitioned into a recovery phase, printing higher lows and reclaiming mid-range value. This behavior suggests that sell side liquidity has already been absorbed, and the market is now actively probing for the next pool of resting orders.
At present, BTC is pressing into a key equilibrium area around 92,000–92,500, which acts as a short-term inflection zone. If price can hold above the nearby support band around 91,000 and continue to build acceptance, the bullish scenario becomes dominant. In that case, Bitcoin is likely to expand higher toward the upper liquidity shelves near 93,000 and 94,200–94,500, where prior highs and buy-side liquidity are clearly resting. The projected pullbacks along this path would be corrective in nature, serving as re-accumulation before continuation.
However, failure to maintain acceptance above the current support would signal that the recent upside is merely a liquidity grab into resistance. A rejection from this zone could trigger a rotation back into the lower range, with price targeting the 90,500 area first, and potentially extending toward the deeper liquidity pool near 89,200–89,000 if bearish momentum accelerates. That downside path would represent a full range rotation rather than a trend continuation.
In summary, BTCUSD is not trending impulsively yet it is coiling within a liquidity box. Acceptance above current value favors upside continuation toward higher liquidity targets, while rejection opens the door for a deeper corrective sweep. The next sustained expansion will be defined by which side of liquidity the market chooses to reward.

EURUSD Defends Key Support — A Broader Bullish Repricing On the H1 timeframe, EURUSD is showing a clear shift from bearish continuation into a bullish repricing phase, driven by strong rejection from a well-defined support zone. After an extended sell-off that systematically cleaned downside liquidity, price printed a sharp bullish displacement, signaling that sell-side pressure has likely been exhausted. Since that impulse, the market has transitioned into a consolidation phase above support, where price is holding its ground rather than retracing aggressively a behavior typically associated with accumulation rather than distribution. The current structure suggests that buyers are actively defending the support region around 1.1650–1.1647, using it as a base to build higher continuation legs. The projected path higher reflects a natural bullish expansion: initial push into nearby resistance, followed by shallow pullbacks and continuation toward higher liquidity pools. As price continues to respect support and avoids acceptance back below it, the bullish scenario remains dominant, with upside targets aligning toward the 1.1700, 1.1730, and ultimately the 1.1740–1.1750 region where resting buy-side liquidity is concentrated.
From a market structure perspective, this is not a random bounce but a post-liquidity-sweep rebalancing, where the market is repricing higher after filling sell orders at discount levels. Any short-term pullbacks into the support zone are likely to be corrective in nature, serving as fuel for the next expansion leg. A clean breakdown and sustained acceptance below support would be required to invalidate this bullish outlook; until then, EURUSD remains structurally positioned for continued upside.
