Bitcoin blow off top to $160k? - January 2026** The next 4 to 12 weeks, after that the idea is obsolete **
Without Worries has a number of bearish Bitcoin posts at the moment since the $120k area, perhaps you noticed?
They are observations from a variety of timeframes, like using different lens under the microscope. This is multi-timeframe analysis.
@ $110k
“ Bitcoin enters 2-day Gaussian channel, 3 months of sideways?” - August 2025
It was clear from looking left as far back as August price action was in trouble for a number of months ahead as influencers were gaslighting audiences with alt-season nonsense.
@ $123k
“ Is a Bitcoin crash to $40–45k next? – October 2025 ”
This post generated a log of disagreement. The fact was price action has broken a multi year channel of support.
@ $110.5k
“ Is a visit to $100k about to print for Bitcoin? - October 15th ”
During October price action began to enter the weekly Gaussian channel. A clear warning for collapse and *time* the market will spend in no mans land. Fell on deaf ears as usual!
@ $90k
“ A continued crash to $45k for Bitcoin? - December 2025 ”
Everyone is wondering why price action crashed in the last 24hrs, Isn’t it obvious? TA works, sorry.
@ $106k
Perhaps the idea that will trigger the most, a 5 month chart that identifies a multi year bearish divergence following a 15 year bull market.
“ Bitcoin in multi year collapse back to $1k - December 2025 ”
There’s no doubt in my mind the “experiment” that is Bitcoin has failed in a dramatic way. Instead of furnishing the many with an equal distribution (Are Bitcoin maxis socialists?!), we’ve instead ended up with a system controlled by the few. I’m certain those were not Satoshi goals.
What’s this business of $160k?
The idea for a test of $160k before price action enters a bear market is not a new one, in fact amidst the bearish ideas Ww published “The end of Bitcoin…. begins in 40 days time @ ~$160k in Oct 2025”.
Now obviously the date set in the title has now come to pass, however, the idea itself is no less valid. In this idea it is detailed how Bitcoin is rotating from growth to decline. If you’re smart, you’ll stay away from Bitcoin those next 10 years. Regardless, price action remains in an uptrend. The real test of a continued uptrend will be the $109k area. Make a note of that value. The market structure at this level is essentially the entirety of 2025.
Bullish Hook reversal pattern
This will be the 1st time this pattern has printed on Bitcoin. Let me repeat, this pattern has never printed on the 10 day chart of Bitcoin in its 16 year history. Go’ann, look left you’ll not find it. The complete Hook Reversal Pattern (HRP) is a psychological storyboard of market participants. Where people see price action panic, I see what people are thinking and let me tell you, it’s quite a story.
HRP definition: Marks the potential end of a downtrend and the start of a energetic bullish reversal. Each candlestick in green on the main 10 day chart:
1. Psychology: Capitulation and despair. Unified panic, sellers exit the market. This is the point where raw emotion is in control. No price is too low, must get out at any cost.
2. Sellers push deep into buyer territory with little resistance. The long wick highlights the waiting buyer demand, but there’s no rush. These are smart buyers waiting for panic sellers to fill long orders, those investors allow the emotional traders to fill their positions even if that takes weeks. While retail tracks the 5 minute chart, seasoned investors are out enjoying the pistes.
3. Buyers and sellers match trading volume, an indecision candle prints. This is an inflection point.
4. Evident seller exhaustion. This one is important. Sellers have no more Bitcoins to sell. Notice the buyer volume pushing into seller territory? Sellers push back, but the selling strengthen is now remarkably weaker. At this point sellers were also buyers from the inflection point.
5. Cautious buyers enter the market, but where are sellers? Explosive energetic moves follows, shorts squeezes etc.
10 day chart of TESLA stock in April 2025 printed such a pattern before launching 50% in a very short window of time.
The more you look, the most you’ll see them.
Conclusions
The Bearish Thesis is primary: The core analytical view, supported by multi-timeframe analysis (Gaussian channels, broken macro support, bearish divergences), points to a significant and sustained decline in Bitcoin's value, with targets ranging from $45k down to a catastrophic $1k over a multi-year period. The recent crash is framed as validation of this technical outlook.
The $160k "Blow-Off Top" is a contingent: Within the overarching bearish structure, a final parabolic surge to ~$160k is proposed as a last gasp possibility, more likely than not driven by a short squeeze event with all the liquidity piling up around the $100k area.
Let me be clear, this is not a bullish endorsement but rather the potential final phase of distribution before a protracted bear market. The $109k level is identified as the critical structural pivot that must be reclaimed to enable this final rally.
The "Hook Reversal Pattern" is the proposed trigger, which in many respects has already confirmed. It will cause a huge FOMO like event lasting 3-12 weeks at best. (P’s if you’re reading this, remember the thesis in time post? Isn’t it a coincidence this HRP timeline shows alignment?)
Anytime price action nears 90.5k, you grab it.
Where does the volume that drives this move come from? No idea, however it would not be a far leap to imagine the speculation that is driving Gold and Silver markets at this time rotates into Bitcoin.
Ww
========================================================
Disclaimer
Right then. Let's be absolutely crystal clear, shall we?
What you've just read is the financial equivalent of a man in his pants, standing on a cardboard box, yelling at pigeons. It's a story. A narrative glued together with lines on charts, patterns with silly names, and enough hindsight bias to rebuild the Titanic.
I am not your financial advisor. I am, at best, a mildly observant comedian pointing at the circus and laughing. If you take any of this doom, the gloom, the magical $160k fairy tale and bet your kids' inheritance or, God forbid, your collection of novelty mugs on it, you are a plonker.
So, if this happens to be right, I'm a genius. If it's wrong which, let's face it, is the overwhelming statistical likelihood…. I was just joking. It's satire. Of course I'm not ;-)
Chart Patterns

Chainlink (LINK): Risk & Reward Is Too Good | Looking For LongYou can’t really disagree that the R:R on LINK here looks very solid. Price has established a strong support zone that has been tested multiple times already, and on the bigger picture we are still trading inside a sideways channel.
Looking at those two things, a few points stand out. There is a lot of room to the upside, support is clearly formed, the range is still valid, and we are not in a bear market yet.
For me personally, being too bearish from this area would be a big miss.
Swallow Academy

GBPJPY: Bulls in Full ControlHello traders,
GBPJPY is presenting a clearly bullish picture, where macroeconomic factors and technical structure are working in alignment rather than against each other.
From a fundamental perspective, the Japanese yen continues to face downside pressure following news of a potential early election in Japan and expectations of a more expansionary fiscal policy . This has weakened the yen’s short-term support, despite ongoing speculation about a future BoJ rate hike . Meanwhile, the British pound is trading cautiously ahead of key employment and inflation data, but the current macro backdrop does not pose a clear threat to GBP’s bullish trend.
Technically, GBPJPY remains in a stable uptrend . Price continues to form higher lows and is well supported by the rising trendline below. The 211.9–212.3 zone is acting as a key support area, where price has reacted positively and quickly reclaimed levels above the Ichimoku cloud. This confirms that buying pressure is still in control of the market structure. On the upside, 214.0–214.3 stands as near-term resistance, and a decisive break above this zone could open the door for further upside continuation.
From a price-action perspective, current pullbacks are technical retracements rather than reversals . Buyers remain patiently positioned around support levels, while selling pressure is not strong enough to invalidate the existing bullish structure.

GOLD Best Places To Buy And Sell Cleared , 500 Pips Waiting !Here is m y opinion on GOLD On 30 Mins T.F , We have a Good movement since Last 3 weeks , and we have a range now for 3 Weeks started between 4550.00 to 4640.00 so we can buy and sell Gold This Week from 2 areas , 4640.000 will be the best place for Buy cuz the price broke it and never retest it so it will be my fav place for buy specially the main direction still very bullish and any short setup it`s a scalping setup to collect some pips and then continue to the main direction .
The range between 4678.00 to 4691.00 will be the best place for Sell as a scalping as i mentioned , now the price very near selling area so we can wait the price to retest the res area and then enter a sell trade and targeting 4550.00 and when the price touch it and give us a good bullish P.A , we can enter a buy trade and targeting 4690.00 , It`s All Depend On Price action , if we have a daily closure below our support then the price will go down more and more after huge movement to upside .
Entry Reasons :
1- Highest Level The Price Touch It
2- Broken Res
3- New Support Created .
4- Clear Price Action .
5- Clear Support & Res .
6- Price Range Cleared .

TheGrove | CHFJPY Sell | Idea Trading AnalysisYou can expect a reaction in the direction of selling from the specified Resistance zone,
CHFJPY moving higher as it tests the strong resistance level..
We expect a bearish move from the confluence zone.
Hello Traders, here is the full analysis.
I think we can soon see more fall from this range! GOOD LUCK! Great SELL opportunity CHFJPY
I still did my best and this is the most likely count for me at the moment.
-------------------
Traders, if you liked this idea or if you have your own opinion about it, write in the comments. I will be glad 🤝

AUUSD Breaks New Highs – Bulls in ControlGold is currently consolidating just above the 4710 level, indicating a potential bullish setup. If the price breaks above this entry, it may aim for the target of 4778, capturing a favorable upward momentum. It’s important to monitor the support level and maintain the stop loss at 4595 to manage risk in case of a pullback.

Price Returning to Equilibrium After Fast RallyHello everyone,
On the H4 timeframe, ETHUSDT previously experienced a very sharp and aggressive rally, with little time spent consolidating. Price was pushed almost vertically from the 3,10x area up toward 3,35x–3,40x, stretching far away from the EMA cluster in a short period. This created a strong impulsive move, but with a relatively thin price base underneath.
The issue emerged right at the top. ETH failed to maintain acceptance around the 3,35x–3,40x zone, consolidating only briefly before being clearly rejected. On the chart, this reflects a lack of acceptance — the market was not ready to value ETH at those higher levels, forcing price to rotate back toward areas with greater prior trading activity and liquidity.
Once the pullback began, EMA 34 was the first level to give way, signaling that short-term bullish momentum had ended. Price then continued sliding toward EMA 89, which represents the medium-term equilibrium of the trend. ETH stabilizing around the 3,11x–3,12x region suggests the market is mainly correcting the earlier overextended rally, rather than entering a full breakdown phase.
At this point, the key focus is the price reaction around EMA 89. If ETH can hold this zone and avoid a clear H4 close below it, the most reasonable scenario is a period of consolidation to rebuild structure, before potentially attempting a rebound to retest EMA 34.
Wishing you all a great trading session!

Gold Strengthens as Trump Fuels Global UncertaintyGold Strengthens as Trump Fuels Global Uncertainty
From our previous analysis, gold rose after finding a strong support area near 4550.
This new bullish pattern that was finalized today, increased the chances of gold rising further to 4700; 4750 and 4800 are rising further.
Fundamental analysis:
The upward movement in gold today can only be attributed to President Trump. He is still increasing geopolitical tension around the world. Over the weekend, tariffs on eight European countries will increase to 25% if they do not support his purchase of Greenland.
🔴The US president said that the new taxes will apply to France, Germany, the United Kingdom, the Netherlands, Denmark, Norway, Sweden and Finland, and will increase to 25% in June.
His actions are already creating a Geopolitical Crisis.
You may find more details in the chart!
Thank you and Good Luck!
❤️PS: Please support with a like or comment if you find this analysis useful for your trading day❤️
Previous analysis:
Previous analysis:

Bearish HTF Bias with Short-Term Bullish Flag CorrectionGold is still trading under a bearish higher-timeframe structure, and the dominant trend remains to the downside. However, after the recent impulsive move, price appears to be forming a bullish flag / corrective structure, suggesting the possibility of one more short-term upward pulse before continuation.
This setup is counter-trend relative to the higher timeframe, therefore confirmation is mandatory. The bullish move is considered only as a corrective rally, not a trend reversal.
Key observations:
Higher Timeframe (HTF) structure remains bearish
Current price action shows a flag-type correction
Potential for a final bullish push into nearby resistance zones
Strong resistance areas are marked above, where selling pressure is expected to reappear
Main demand zone lies around 4400 – 4410, acting as a key invalidation area
Trading approach:
Prefer confirmation-based long entries only within the corrective structure
Be cautious with aggressive buys due to bearish HTF context
Primary focus remains on short opportunities at higher resistance levels after the correction completes
This idea is context-driven, not a blind signal. Directional alignment with higher timeframes remains critical.
Key Levels
Demand / Support: 4400 – 4410
Resistance 1: 4484 – 4495
Resistance 2: 4525 – 4550
Major HTF Resistance: 4605+
Invalidation
A strong breakdown and acceptance below the demand zone (4400) invalidates the bullish correction scenario and favors direct continuation to the downside.

Gold- What Do You Do When Price Becomes Untouchable?Yesterday, Gold opened with a bullish gap above the old ATH and quickly printed a new all-time high at 4690. With the U.S. holiday reducing liquidity and participation, the market spent most of the session trading inside a range.
Overnight, the Asian session delivered once again and pushed Gold into a fresh ATH at 4717 (at the time of writing).
And in a situation like this, the big question becomes simple:
👉 What do you do now?
✅ The Most Obvious Answer: Stay Out
At these levels, both directions become dangerous.
Buying at 4710 forces an extremely wide and unrealistic stop-loss
(the nearest “clean” technical stop is easily 500+ pips lower)
Selling is even worse — because it becomes pure top-guessing and even if the market does correct, it might do so only after it squeezes you out first
This is exactly the type of market where traders lose money not because they are wrong…
…but because they refuse to accept that there is no good trade.
📌 Scenarios I Would Need to See for a Trade
Instead of forcing a decision, I’m watching for clear triggers.
1️⃣ Short Scenario (Sell Setup)
What I want to see:
- a spike higher
- clear reversal behavior
- and a drop back below 4670
✅ If price re-enters under 4670, and started to rise back in a overlapping manner, I will consider entering short.
2️⃣ Long Scenario (Buy Setup)
Here I want the opposite:
- a pullback lower
- but without breaking below 4670
✅ If price holds above 4670 and prints strong bullish candles (15-30 min), I will consider a long entry.
The advantage here is obvious:
stop-loss becomes more reasonable
➡️ around 200 pips, not 500+
✅ Conclusion
Sometimes the best position is no position.
No trade is also a trade — and at 4700+ Gold is currently offering more emotion than opportunity.
So if I’m going to “gamble” today, I’d rather do it in a casino placing 25–36 zone on the table — at least there I get a clean 1:3 risk-to-reward. 🚀

Why Micron’s 26,000% Legacy is Just the BeginningWhy Micron’s 26,000% Legacy is Just the Beginning
To learn how to operate in the stock market it is interesting to stop thinking about money for a while and start understanding what is actually happening.
Today I bring you an example with NASDAQ:MU a company that in less than 20 years has offered a 26,000% return and is now a global benchmark.
However this has not always been the case and certain events have determined market movements for months and years. Learning from these movements helps you better capture the long term essence of the market what is valued and what is not. Understanding that suffering is temporary if the company knows how to reverse it and that these drops can offer wonderful opportunities.
1️⃣ Micron did not start as a multinational. In fact it was 4 people with a consulting vocation in the 70s but they quickly pivoted to manufacturing DRAM the short term memory of a computer and became famous for being the scrappy low cost leader . While many American chipmakers quit when faced with fierce Japanese competition in the 80s Micron survived by being leaner and more efficient than anyone else.
2️⃣ From the year 2000 Micron was a slave to PC cycles . As seen in the 2000 Dot Com crash and the 2015 price wars if people stopped buying computers Micron’s profits vanished . But they transformed the company. During these winters Micron played a game of Last Man Standing . When competitors like Qimonda in 2009 went bankrupt Micron did not just survive they expanded . By acquiring rivals like Elpida in 2013 they helped turn a crowded chaotic market into a stable Oligopoly dominated by just three players Samsung SK Hynix and Micron .
3️⃣ Recently Micron has made one more masterstroke . It has no longer just achieved being part of a commodity oligopoly. They are now the architects of HBM or High Bandwidth Memory. Think of HBM as a super highway for data . This is CRUCIAL since AI chips like those from Nvidia are incredibly fast but they need memory that can keep up. Micron’s transformation into a specialized AI partner means they now command higher prices and stronger loyalty than ever before.
On the other hand I leave you a chronology of the most outstanding fundamental events and how they fit with the chart and the trend change points.
Key Historical Market Movers
🔴 September 21 2000 -> The Dot Com Crash and Intel Warning Intel issued a massive profit warning due to weak PC demand in Europe triggering a sector wide collapse . Micron’s stock plummeted as the era of irrational exuberance for hardware components came to a violent end.
🔴 October 4 2006 -> Lexar Integration and Windows Vista Delay Micron reported disappointing quarterly margins following the acquisition of Lexar Media. The market reacted negatively to the integration costs and the delayed launch of Windows Vista which stalled the expected PC refresh cycle.
🟢 January 23 2009 -> Qimonda Bankruptcy and Market Bottom German rival Qimonda filed for insolvency significantly reducing the global supply of DRAM . This event created a long term price floor for the industry and marked the start of a massive recovery for surviving players like Micron.
🔴 January 7 2015 -> Samsung’s Price War and PC Weakness Concerns peaked as Samsung signaled aggressive capacity expansion despite slowing PC sales. Investors fled Micron fearing a return to the race to the bottom in memory pricing leading to a sharp double digit decline.
🟢 May 23 2016 -> The Bernstein Upgrade , analysts at Bernstein upgraded the stock spotting a fundamental shift toward supply discipline among the big three. This call accurately predicted the end of the memory winter and the start of a multi year bull run .
🟢 March 20 2024 -> AI Validation and Nvidia Partnership Micron reported a surprise profit and confirmed that its high bandwidth memory HBM3E was sold out for the year. This solidified the company’s role as a critical pillar in the AI infrastructure alongside Nvidia.
🟢 May 22 2025 -> The AI Supercycle Peak Guidance Capitalizing on the insatiable demand for AI servers Micron issued record breaking guidance for the second half of the year. This news triggered a massive rally as the stock broke through major psychological resistance levels.
🧑💻 Taking advantage
This transformation can make MU prices go to levels never before seen or imagined but we also have the support of the charts.
Recently we have broken a Double Top to the upside and this usually implies very very significant increases in the long term.
It seems that NASDAQ:MU can easily exceed 1,000 dollars in the coming years as it has such important technology for the new era of AI. I will not go into the technical part but almost 75 percent of cases of a double top breakout send the price to the equivalent of a 700 percent rally from the breakout of this double top.
That is why it is vital to be attentive to chart patterns to catch these types of operations where the fundamental and technical parts match perfectly. Furthermore knowing this about the long term it is very easy to find bullish entries in the short term and take advantage of the small rallies that arise within a rally of so many years like this one for MU.
👇 WANT MORE?
Hit the rocket , read my profile or follow so we can find each other again.

GOLD - Consolidation after the rally before the rally...FX:XAUUSD started the week with growth, hitting a new all-time high amid geopolitical risks and threats of new tariffs from the US, and is now consolidating around $4,700...
Fundamental situation
Trump threatened to impose tariffs on eight European countries over the issue of buying Greenland.
Escalating tensions around Ukraine and Iran.
Fed:
Expectations of policy easing are supporting gold, but the appointment of a new Fed chair could slow down aggressive rate cuts. The investigation into Powell continues...
This week, PCE inflation data (Thursday) and US GDP for the third quarter are important.
Gold's rise since the beginning of the year has been independent of the strengthening dollar, underscoring the strength of internal drivers. However, a confident breakout to $5,000 will require confirmation of lower inflation in the US and continued high demand for safe-haven assets. Corrections may be profitable against the backdrop of an aggressive bullish trend...
Resistance levels: 4678, 4691, 4700
Support levels: 4656, 4650, 4640
Within the current range, I focus on the zones 4656 - 4650 - 4639. There is a high probability of a long squeeze/false breakout of support. However, I do not rule out the possibility of a local correction due to the holiday in the US (low liquidity, profit-taking may trigger a correction) before growth.
Best regards, R. Linda!

Natural Gas – Trend Shift in Progress?After being bearish bearish for a while, Natural Gas has broken out of the descending red trendline, signaling a clear shift in momentum from bearish to bullish.
What stands out here is how price reacted after the breakout. Instead of selling off again, it held above the recent support zone and started building higher structure.
As long as this new bullish structure holds, the bias remains to the upside, with room for continuation toward higher levels. Any pullbacks that stay above support are, for me, opportunities to watch.
⚠️ Disclaimer: This is not financial advice. Always do your own research and manage risk properly.
📚 Stick to your trading plan regarding entries, risk, and management.
Good luck! 🍀
All Strategies Are Good; If Managed Properly!
~Richard Nasr

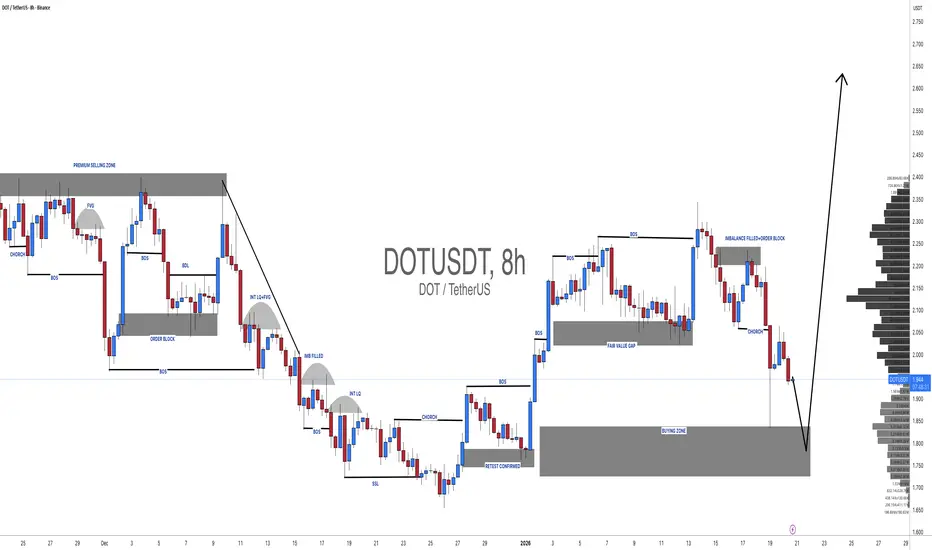
DOTUSDT: One Last Drop And Then Strong Bullish Move To Start?Dear Traders,
DOTUSDT is poised for a strong bullish reversal, potentially reaching all-time highs. Both fundamental and technical analysis support our bullish bias, but we need strong bullish volume to confirm this view. If you enjoy our work, please like and comment for more.
Team Setupsfx_
EURUSD Pullback Underway – Will 1.1700 Hold the Trend?EURUSD Pullback Underway – Will 1.1700 Hold the Trend?
Following Trump's comments on tariffs and Greenland, the high liquidity of the US dollar created unexpected weakness in it.
The price is currently correcting after the aggressive upward moves we had yesterday.
However, volatility is high given that the market is not clear about Trump's future decisions.
Price is near the first and strongest area of the structure from where it could bounce off 1.1700 to resume the uptrend.
However, we need to be careful because if 1.1700 is broken, the next support area could be found near 1.1660.
Both scenarios are possible with this crazy marker. Watch carefully for signs of a reversal near these areas.
You may find more details in the chart!
Thank you and Good Luck!
❤️PS: Please support with a like or comment if you find this analysis useful for your trading day❤️

Hellena | GOLD (4H): LONG to 161.8% Fibo 4728 .Colleagues, the price is updating its maximum, and I think we shouldn't stop there.
After re-marking the waves, I realized that it would be more correct to place wave “3” at the 4549 level, since 5 waves fit well into it.
This means that the price is now in wave “5,” which can be quite unpredictable, but if we look at the blue waves, we can assume that there is now a medium-term impulse wave “3,” which means we can apply Fibonacci extension levels and see the 161.8% level as the target.
But I don't want to take such a risk and will set a slightly lower target - in the 4728 area. At the moment, we need to be very careful.
Manage your capital correctly and competently! Only enter trades based on reliable patterns!

TheGrove | USDJPY buy | Idea Trading AnalysisUSD/JPY is trading within a rising channel, with price holding above the ascending support line after a clear bullish and is moving on Resistance level.
We expect a decline in the channel after testing the current level.
We expect a decline in the channel after testing the current level
Hello Traders, here is the full analysis.
I think we can soon see more fall from this range! GOOD LUCK! Great SELL opportunity USDJPY
I still did my best and this is the most likely count for me at the moment.
-------------------
Traders, if you liked this idea or if you have your own opinion about it, write in the comments. I will be glad ⚜️

EURGBP H4 | Bullish Bounce Off Pullback SupportMomentum: Bullish
Price is currently above the ichimoku cloud.
Buy entry: 0.86893
- Pullback support
- 50% Fib retracement
- 100% Fib projection
- Fair value gap
Stop Loss: 0.86693
- Multi-swing low support
Take Profit: 0.87221
- Swing high resistance
High Risk Investment Warning
Stratos Markets Limited (fxcm.com/uk), Stratos Europe Ltd (fxcm.com/eu):
CFDs are complex instruments and come with a high risk of losing money rapidly due to leverage. 69% of retail investor accounts lose money when trading CFDs with this provider. You should consider whether you understand how CFDs work and whether you can afford to take the high risk of losing your money.
Stratos Global LLC (fxcm.com/en): Losses can exceed deposits.
Please be advised that the information presented on TradingView is provided to FXCM (‘Company’, ‘we’) by a third-party provider (‘TFA Global Pte Ltd’). Please be reminded that you are solely responsible for the trading decisions on your account. Any information and/or content is intended entirely for research, educational and informational purposes only and does not constitute investment or consultation advice or investment strategy. The information is not tailored to the investment needs of any specific person and therefore does not involve a consideration of any of the investment objectives, financial situation or needs of any viewer that may receive it. Past performance is not a reliable indicator of future results. Actual results may differ materially from those anticipated in forward-looking or past performance statements. We assume no liability as to the accuracy or completeness of any of the information and/or content provided herein and the Company cannot be held responsible for any omission, mistake nor for any loss or damage including without limitation to any loss of profit which may arise from reliance on any information supplied by TFA Global Pte Ltd.
Stratos Trading Pty. Limited (fxcm.com/au):
Trading FX/CFDs carries significant risks. FXCM AU (AFSL 309763), please read the Financial Services Guide, Product Disclosure Statement, Target Market Determination and Terms of Business at fxcm.com/au

**GOLD H1 — Bullish SMC Continuation | BOS, FVG & Order Block toMarket Context
Gold is trading in a strong intraday bullish structure, showing clear momentum continuation after a clean impulsive move. Price respected higher lows and remains supported above key demand, favoring upside continuation toward premium levels.
Key SMC Concepts
Clear Break of Structure (BOS) confirming bullish market intent.
Strong displacement leaving a well-defined Fair Value Gap (FVG).
Price originated from a valid Bullish Order Block, acting as demand.
Price is respecting an ascending channel, supporting trend continuation.
Trade Idea
Look for pullbacks into the FVG or channel support for long entries.
Target previous highs and projected premium liquidity.
Disclaimer: This analysis is for educational purposes only and not financial advice. Always manage risk and confirm setups with your own strategy before trading

GOLD 1H CHART ROUTE MAP UPDATE & TRADING PLAN FOR THE WEEKHey Everyone,
Please see our 1h chart levels and targets for the coming week.
We are seeing price play between two weighted levels with a gap above at 4598 and a gap below at 4539, as support. We will need to see ema5 cross and lock on either weighted level to determine the next range.
We will see levels tested side by side until one of the weighted levels break and lock to confirm direction for the next range.
We will keep the above in mind when taking buys from dips. Our updated levels and weighted levels will allow us to track the movement down and then catch bounces up.
We will continue to buy dips using our support levels taking 20 to 40 pips. As stated before each of our level structures give 20 to 40 pip bounces, which is enough for a nice entry and exit. If you back test the levels we shared every week for the past 24 months, you can see how effectively they were used to trade with or against short/mid term swings and trends.
The swing range give bigger bounces then our weighted levels that's the difference between weighted levels and swing ranges.
BULLISH TARGET
4598
EMA5 CROSS AND LOCK ABOVE 4598 WILL OPEN THE FOLLOWING BULLISH TARGETS
4634
EMA5 CROSS AND LOCK ABOVE 4634 WILL OPEN THE FOLLOWING BULLISH TARGETS
4666
EMA5 CROSS AND LOCK ABOVE 4666 WILL OPEN THE FOLLOWING BULLISH TARGETS
4700
EMA5 CROSS AND LOCK ABOVE 4700 WILL OPEN THE FOLLOWING BULLISH TARGETS
4729
BEARISH TARGETS
4564
EMA5 CROSS AND LOCK BELOW 4564 WILL OPEN THE FOLLOWING BEARISH TARGET
4539
EMA5 CROSS AND LOCK BELOW 4539 WILL OPEN THE FOLLOWING BEARISH TARGET
4496
EMA5 CROSS AND LOCK BELOW 4496 WILL OPEN THE SWING RANGE
4459
4427
As always, we will keep you all updated with regular updates throughout the week and how we manage the active ideas and setups. Thank you all for your likes, comments and follows, we really appreciate it!
Mr Gold
GoldViewFX

XAUUSD (Gold) Short Setup | Trendline RejectionGold has reached a strong rising trendline resistance after an aggressive bullish move. Price is showing signs of exhaustion near the top, forming a potential pullback structure.
🔴 Sell Zone: Near trendline resistance
🎯 Take Profit: 4802 area (previous demand zone)
🛑 Stop Loss: Above recent high / resistance
📊 Timeframe: 1H
This setup follows trendline rejection + pullback continuation, offering a clean risk-to-reward opportunity. Wait for confirmation before entry and manage risk properly.
⚠️ Always follow your risk management. This is not financial advice.

Ethereum's bullish bias remains intact —Good news and bad newsFeels like it was just yesterday when I told you that Ethereum is not likely to grow "right on Monday, it might happen on Tuesday." This is what I see happening.
Ethereum's bullish bias remains intact. People know the market is bullish. Ethereum's correction ended already two months ago. Think about it.
Some people are still having nightmares about crashes and bearish action, but there hasn't been a single new low now in two full months, since 21-November. More than that, Ethereum has been rising all this time.
With two months of a slow recovery, bullish consolidation, we can expect a strong advance next. This is good news and bad news.
It is good news because we know we get to enjoy higher prices. Bad news because we are already two months into this relief rally, which means that it will soon end. But, there is more.
Bitcoin is the one doing the relief rally. What happens if Bitcoin and Ethereum de-couple?
Notice how as Bitcoin moved lower, another five days long retrace, the altcoins market produced a strong bullish breakout. The initial reaction is marketwide but the altcoins recovered right away.
That is to say, Bitcoin can start a descent while some projects, many others, continue to grow for several weeks or months before peaking to move lower. Money will flow from Bitcoin to the altcoins, make no mistake. This is because Bitcoin is worth $2T and it is set to move below $80,000 later this year. All this capital will fuel the altcoins market bull run already in place.
Ethereum's bullish bias remains intact; trades weekly above EMA8. The action is happening above $3,000 and long-term support. Last week produced the strongest close in seven months... Rest easy, we will see additional growth.
Namaste.

XAUUSD Holding Firm — Bulls Preparing the Next Expansion
Price is holding above the key support zone at 4825–4807, while strong demand remains around 4760–4740. As long as price stays above the demand zone, the bullish structure remains intact, with upside potential toward the 4997 target.
Note: This is for educational purposes only.
If you’d like more updates, please like and comment to boost the post!
