BITCOIN IS BULLISH!!!!! (but watch out for this) Yello Paradisers! Enjoy the video!
And Paradisers! Keep in mind to trade only with a proper professional trading strategy. Wait for confirmations. Play with tactics. This is the only way you can be long-term profitable.
Remember, don’t trade without confirmations. Wait for them before creating a trade. Be disciplined, patient, and emotionally controlled. Only trade the highest probability setups with the greatest risk to reward ratio. This will ensure that you become a long-term profitable professional trader.
Don't be a gambler. Don't try to get rich quick. Make sure that your trading is professionally based on proper strategies and trade tactics.
Chart Patterns


GBPUSD Delivered GBPUSD H4 — Delivered Exactly as Planned ✅
Price ran liquidity, tapped into premium,
then reacted perfectly from our marked zone.
No indicators.
No guesswork.
Just HTF bias + liquidity + location.
This is why we wait.
This is why we plan.
This is why patience pays.
Market did exactly what it was supposed to do.
📍 ERL → IRL
📍 Premium → Reaction
📍 Structure respected
Execution > Emotion.

Needs to hold here.I didnt post this chart because i forgot. My fib levels are absolutely insane. Super accurate!

continue to the weekly cycle idea its ticking like a clock
lets see if new FRS guy will break it
dont think so - they want cheap bitcoin

SELL Signal: XAU/USD (Gold Spot)
Entry: ~4,847–4,859 (bearish Order Block rejection area)
SL: >4,899–4,920 (above OB high / recent structure invalidation)
TP1: 4,800–4,760 (next support / prior BOS target)
TP2: 4,682–4,640 (deeper extension if breakdown continues) Reason: Price rejecting hard at bearish Order Block (~4,847–4,859 zone) after multiple BOS to the downside. Strong bearish structure + rejection wick in downtrend → high-probability continuation sell setup. #Gold #XAUUSD #Trading #Bearish #OrderBlock #Downtrend #PreciousMetals Not financial advice. Trading involves high risk of loss. Always do your own research (DYOR), use proper risk management, and never risk more than you can afford to lose.

HBARUSDTHBARUSDT is currently trending upwards with noticeable strength. There is a strong possibility that the price may break above the current trendline. Traders should keep an eye out for breakout confirmation, as a successful breach could signal continued bullish momentum. Attention should also be given to nearby resistance levels and potential retracements

SHIBUSDFrom my observation, SHIBUSDT is currently displaying strong upward momentum. The price action suggests a high probability of breaking the current trendline. Traders should monitor for confirmation signals, as a successful breakout could indicate further bullish continuation. Caution is advised around resistance levels and possible pullbacks

WLDUSDT is currently showing stronFrom my observation, WLDUSDT is currently showing strong upward momentum. The price action indicates a high probability of breaking the current trendline. Traders should watch for confirmation signals, as a successful breakout may lead to further bullish movement. It’s important to remain cautious around key resistance levels and potential pullbacks.

ICEUSDT appears bullish, with a high probability of breaking theFrom my observation, ICEUSDT is currently exhibiting strong upward momentum. The price action suggests a high likelihood of breaking the existing trendline. Traders should monitor for confirmation signals, as a successful breakout could indicate further bullish continuation. Caution is advised around resistance levels and potential pullbacks.

$BTCXAU possible bottomHead & Shoulders completed, thoroughly oversold on weekly mimicking past cycle bottoms or near bottoms.

NVDA Weekly Quant Signal — Macro Headwinds Take Control📍 NVDA Weekly Trade – 2026-01-30
Signal: BUY PUTS (Bearish)
Conviction: Moderate
Time Horizon: Weekly (Expires Jan 30)
Regime: Neutral / Volatile
🎯 Core Thesis
Expect mean reversion lower into the Weekly VWAP (~$189.50) as macro pressure from surprise inflation data offsets broader AI optimism.
📊 Key Levels
Current Price Zone: Above $190
Major Resistance (Gamma Wall): $195
Weekly VWAP Target: ~$189.50
Psychological Support: ~$190
🧠 Why This Trade
Katy AI Bearish Vector: ~62% probability to slide toward ~$189
Technical Resistances: Strong resistance near the $195 gamma wall
Institutional Positioning: Heavy put interest at $192.5 & $197.5
Momentum Cooling: RSI and MACD project short-term exhaustion
Strong breakout above $195 on heavy volume
Macro reversal that boosts tech sector leadership
🧾 Trade Management
Take 50% profits at Target 1 ($3.95)
Move stop to breakeven
If underlying hits support (~$189), close the rest regardless of premium

Gold collapses, falling back to 3900!
I've been bearish on gold for a while now, and I issued warnings in advance, posting several days of downward predictions. At that time, many people didn't believe me.
These past two days have proven that my previous predictions were correct.
So, my new prediction is that gold will fall below 4000! It will head towards 3700!
Now is a good time to sell, don't miss this opportunity!
Feel free to leave comments and discuss further.

APLD Quant Signal: Institutional Call Flow Aligns📊 APLD Trading Info (Weekly Setup)
Signal: BUY CALLS
Timeframe: Weekly (expires Friday)
Market Regime: High Volatility / Neutral
Conviction: Moderate
🎯 Trade Idea
APLD is showing bullish momentum driven by AI & data-center demand. QS V4 + Katy AI both point to a move toward $42 resistance.
🧠 Key Levels
Current Zone: ~$38–39
VWAP (Key Trigger): $39.07
Target Stock Price: $42.00
Major Resistance: $42.27
📈 Options Play
Contract: $38 Call
Expiration: This Friday
Entry: $2.05 – $2.20
Katy AI bullish (65% probability, +12.6% move)
Strong institutional call activity at $38
Long-term uptrend (well above 200-day MA)
Potential gamma push if price reclaims $39+
Risk:
If APLD fails to reclaim $39 VWAP, momentum weakens
Market-wide selloff could cap upside
🛠 Trade Management
Take 50% profit at $2.70
Move stop to breakeven


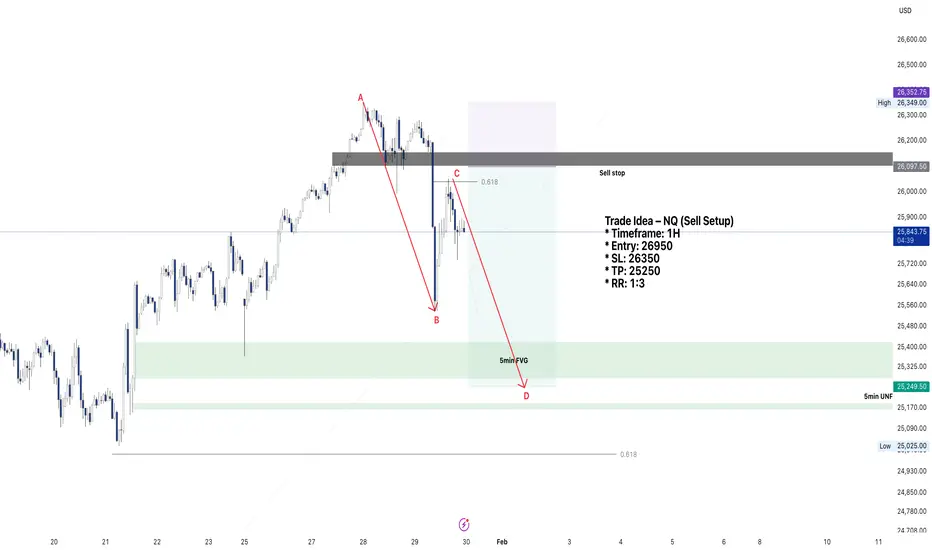
NQ Sell Setup – Dead Cat Bounce After BOS (1H, 1:3 RR)Trade Idea – NQ (Sell Setup)
* Timeframe: 1H
* Entry: 26950
* SL: 26350
* TP: 25250
* RR: 1:3
- We dropped from 26349 to 25536 after moving from the Jan2026 lows near 25000 to the Jan highs at 26349, which marked a 0.618 Fib retracement.
- From the sharp sell-off between 25536 and 26050, price has already completed another 0.618 retracement, which I consider a classic dead cat bounce.
- The break of structure (BOS) was confirmed once we closed below 26,100, so this move back to 26050 is corrective rather than impulsive.
- The decline from 26349 to 25536 formed Wave A to B. After the current 0.618 retracement up to 26050, I expect price to complete Wave C to D, targeting the 25250 area.
- The RR setup is excellent, with approximately 255 points of stop loss versus 848 points of potential profit, giving a 1:3 RR.
- There is also a strong probability of a deeper move back toward 25000, which aligns with the 0.618 Fib retracement from the Nov 2025 lows to the Jan 2026 highs.

Sugar Raw - Cash (NYSE) added to watchlistSugar Raw - Cash New York. is the bottom near? will W3 kick in to new highs?

AUD/USD | Testing the IFVG (READ THE CAPTION)As you can see in the hourly chart of AUDUSD, it is currently going towards the IFVG, and I expect a drop in price from AUDUSD once it reaches there.
Afterwards, I would like to see it go down and sweep the sellside liquidity and then make another upwards move.
Current bullish targets: 0.70350, 0.70420 and 0.70450.
Bearish targets: 0.70180, 0.70100, 0.70020 and 0.69940.

XAU/USD | Targets ahead (READ THE CAPTION)By examining the hourly chart of Gold, we can see that it has had several 1000+ pips moves in the past couple of days! 3-4 1000+ pips moves in just the past 3 hours!
Since last night, gold has dropped over 4000 pips! Going as low as 4941, going through the NWOG, and sweeping the Sellside Liquidity there before going back up and now it's being traded at 5100. The wicks did their damage, they swept the liquidity and then went back up, and the Body of the candle closed just above the Jan 26 NWOG High.
At the moment, Gold is moving towards the Liquidity pool above the 5241 level, should it make it above the Daily FVG, it'll go for it.
However, if Gold closes below the Jan 26th NWOG low, I can see it going for the Sellside Liquidity below the 4899 level.
Bullish targets for Gold: 5170, 5200, 5230 and 5260.
Bearish Targets: 5060, 5030, 5000 and 4970.

EUR/USD | What's next? (READ THE CAPTION)As you can see in the hourly chart of EURUSD, it's been consolidating in the same zone in the past 3 days, touching the NDOG and the Consequent Encroachment (C.E.) of the wick several times and going back again to them.
If it holds itself above the low of C.E., I expect it to go higher, closing the Jan 29th NDOG, and then going for the Jan 30th NDOG.
If it fails to stay above the C.E., I can see EURUSD going for the Sellside Liquidity and Jan 27th NDOG.
For now, the bullish targets are: 1.19400, 1.19550, 1.19700 and 1.19850.
Bearish targets: 1.19200, 1.19050, 1.18900 and 1.18750.

Bitcoin SELL prediction of the End of january 2026After big sell extenntion price pulled back to a supply zone. Also created breakout of structure to the downside then pulled back for another time that gave us power to decide to take short position. Also,considering price and time theory we had confirmation that was right time take a short position

RKLB plans till June spaceX IPORKlb needs to hold low $40 if not we will head lower in to the $20s
Rocket lab usually runs up around June so it will be inline with SpaceX IPO for a run up
before June neutron might be introduce into the market for a test flight which will explode 100% which will cause the price to tank to low $20s either way in the weekly time frame RSI MADC and everything is pointing down.
RKLB will come back to the 200 EMA or below which will offer a really good entry for myself
See u in june RKLB take care
