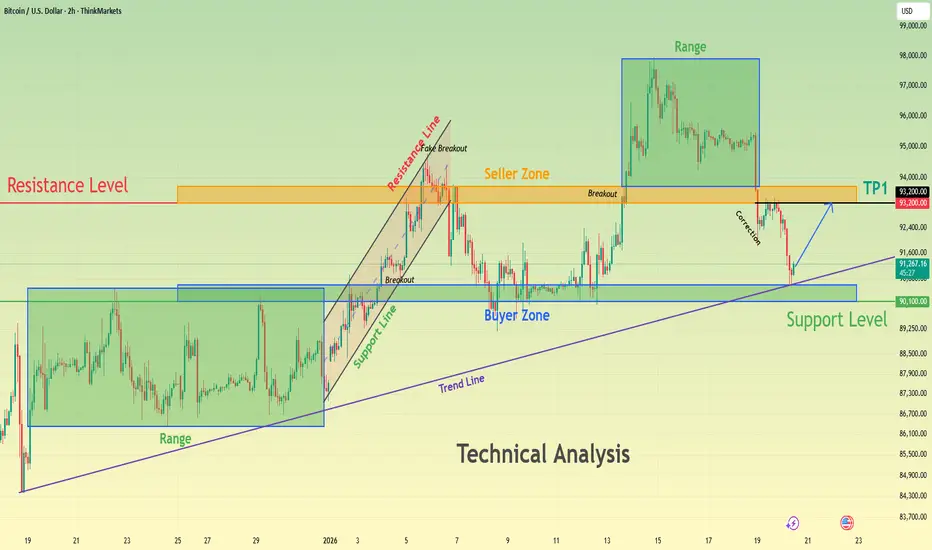
BTCUSD Holds Above Demand - Next Move Toward 93,200 ResistanceHello traders! Here’s my technical outlook on BTCUSD (2H) based on the current chart structure. Bitcoin is trading within a clear bullish environment after transitioning from a prolonged consolidation phase into an impulsive upward move. Earlier on the chart, price was moving inside a well-defined range, indicating balance between buyers and sellers and a period of accumulation. This range was eventually resolved to the upside, confirming a shift in market control in favor of buyers. Following the breakout, BTCUSD accelerated higher and successfully established acceptance above the former range highs. Currently, price is trading above the Support Level around the 90,100 area, which aligns with a clearly defined Buyer Zone and a previous structural level. This area is now acting as a key demand zone after the breakout and is reinforced by the rising trend line, strengthening its importance. The recent pullback into this support appears corrective rather than impulsive, suggesting healthy profit-taking instead of aggressive selling pressure. Buyers are actively defending this zone, keeping the bullish structure intact as long as price remains above support. If buyers continue to defend the 90,100 Buyer Zone, BTCUSD could resume its upward move toward the 93,200 Resistance Level, which serves as the next key objective. A clean continuation and acceptance above this resistance would confirm further upside momentum and open the door for continuation toward higher targets (TP1 and beyond). However, a decisive breakdown and acceptance below the support zone and rising trend line would signal a deeper correction and weaken the bullish setup. For now, the overall structure favors buyers while price respects support. Please share this idea with your friends and click Boost 🚀
Chart Patterns
XAUUSD Long: Uptrend Holds as Price Respects Rising Trend LineHello traders! Here’s a clear technical breakdown of XAUUSD (1H) based on the current chart structure. Gold is trading within a well-defined bullish structure after forming a clear pivot low earlier on the chart. From this pivot point, a rising trend line has been established, highlighting consistent buyer participation and a gradual shift in market control toward the upside. This trend line has been respected multiple times, confirming it as a key dynamic support guiding the bullish move. Following the pivot, price advanced and broke above a descending supply line, signaling a structural change from corrective pressure to bullish continuation. This breakout was impulsive, indicating strong demand entering the market. After the breakout, XAUUSD transitioned into a consolidation range, where price moved sideways as buyers and sellers reached temporary equilibrium. This range acted as a continuation structure rather than distribution.
Currently, price eventually broke out of the range to the upside, confirming renewed bullish momentum. After the breakout, gold pulled back and successfully retested the former resistance area, which is now acting as a Demand Zone around 4,700. This retest appears corrective, not impulsive, suggesting healthy price action and continued buyer dominance rather than trend exhaustion. On the upside, the next key level is the Supply Zone near 4,770, where previous selling pressure is expected to reappear. The current structure shows higher highs and higher lows, and price remains firmly above both horizontal demand and the rising trend line, keeping the bullish bias intact.
My scenario: as long as XAUUSD holds above the 4,700 Demand Zone and continues to respect the ascending trend line, the bullish structure remains valid. I expect buyers to defend this area and potentially push price toward the 4,770 Supply Zone (TP1). A clean breakout and acceptance above this level would confirm further bullish continuation. However, a decisive breakdown below the demand zone and trend line would weaken the bullish bias and signal a deeper corrective move. For now, market structure clearly favors buyers. Manage your risk!

EURUSD: A Pullback to 1.1680 is Planned Before Further GrowthHello everyone, here is my breakdown of the current EURUSD setup.
Market Analysis
EURUSD previously traded within a well-defined upward channel, confirming a bullish recovery phase with higher highs and higher lows. During this advance, price respected the rising support line and produced several breakout attempts, showing strong buyer control at that stage. However, as the pair approached the upper boundary of the structure and the broader Resistance Zone around 1.1735–1.1740, bullish momentum began to weaken. Near this resistance area, EURUSD formed multiple fake breakouts, signaling seller absorption and exhaustion at the highs. Price failed to achieve acceptance above resistance and subsequently lost upward momentum. This failure marked a structural shift, as EURUSD broke below the rising channel support and transitioned into a clearly defined descending channel. From that point, price started forming lower highs and lower lows, confirming that sellers have taken control in the short to medium term. After the breakdown, EURUSD continued to respect the downward channel, with pullbacks acting as corrective moves rather than impulsive bullish legs.
Currently, price broke above the short-term descending channel support, triggering a corrective bounce. This move, however, appears to be a retracement into prior resistance, not a trend reversal. The current rally is testing the Resistance Zone near 1.1735–1.1740, which also aligns with previous support turned resistance and the upper boundary of the bearish structure. On the downside, a key Support Zone / Buyer Zone around 1.1680 remains critical. This level has acted as a reaction area multiple times and represents the next downside objective if sellers regain control.
My Scenario & Strategy
My primary scenario remains bearish as long as EURUSD stays below the 1.1735–1.1740 Resistance Zone and fails to gain acceptance above it. I expect sellers to defend this area and push price back toward the 1.1680 Support Zone (TP1). A clean rejection from resistance would confirm continuation within the broader bearish structure. If price breaks and holds below 1.1680, it would open the door for a deeper bearish continuation toward lower support levels.
However, a strong bullish breakout and acceptance above 1.1740 would invalidate the short setup and suggest a shift back toward consolidation or renewed bullish recovery. For now, the market structure favors sellers, and the current move looks corrective within a broader bearish phase.
That’s the setup I’m tracking. Thank you for your attention, and always manage your risk.

Trendline Resistance SetupThis chart represents a detailed intraday analysis of gold prices, focusing on key levels and potential price movements for January 19, 2026. The chart highlights crucial support and resistance zones, trendline resistance, and expected price reactions at various levels. Key strategies include waiting for a breakout above 4620.851 for potential upside, or monitoring a break below 4657.992 for potential downside. The final target is set at 4550.000, providing a clear risk-to-reward setup for traders.

Gold 30-Min — Volume Buy Reversal Triggered⚡Base : Hanzo Trading Alpha Algorithm
The algorithm calculates volatility displacement vs liquidity recovery, identifying where probability meets imbalance.
It trades only where precision, volume, and manipulation intersect —only logic.
Technical Reasons
/ Direction — LONG / Reversal 4760 Area
☄️Bullish momentum confirmed through strong candle body.
☄️Structure shifted with higher-low near key demand base.
☄️Volume expanding confirms order-flow alignment upward.
☄️Buyers reclaimed imbalance with sustained clean break.
☄️Algorithm detects rising momentum under low liquidity.
⚙️ Hanzo Alpha Trading Protocol
The Alpha Candle defines the day’s real control zone — the first battle of momentum.
From this origin, the Volume Window reveals where the next precision strike begins.
⚙️ Hanzo Volume Window / Map
Window tracked from 10:30 — mapping true market behavior.
POC alignment exposes institutional bias and breakout potential zones.
⚙️ Hanzo Delta Window / Pulse
Delta window monitors real buying vs. selling power behind each move.
Tracks volume aggression to expose who controls the candle — buyers or sellers.
When Delta aligns with Volume Map, momentum becomes undeniable.

GOLD - Aggressive bullish trend. Test of the 4725 zone...FX:XAUUSD continues to update its historical maximum, currently testing the 4725 zone, against the backdrop of escalating geopolitical risks and declining risk appetite...
Fundamental situation
Trump's threats to impose new tariffs on goods from the EU and the union's retaliatory measures have heightened fears of a trade war.
Escalation of the Russia-Ukraine conflict
The economic backdrop is contributing to the decline of the dollar, which in turn is supporting gold.
The key events of the week will be the US PCE inflation data (Thursday) and the revised GDP report for the third quarter.
Gold continues to rise due to geopolitical uncertainty and the weakening of the dollar. Further dynamics will depend on US inflation data — weak figures could strengthen the upward momentum, while strong figures could trigger a correction.
Resistance levels: 4725, 4750
Support levels: 4707, 4700, 4691
Growth has been halted by the psychological resistance zone of 4725. Since the opening of the session, the market has exhausted its intraday potential and may form a correction (profit-taking) and test the key support zones of 4710-4700 before continuing to grow.
Best regards, R. Linda!

Gold near $5,000 — this is where bull markets turn parabolic🚨 As we are closing in 5,000 USD in gold prices, the bull market is entering its parabolic stage. Let’s review the current bull market stats + historic bull markets in more detail. Let’s go.
________________________________________
✅ Executive Summary — Top 10 Key Takeaways
1.🟡 Gold just printed a new ATH: $4,887.82/oz (Jan 21, 2026) and is hovering around $4,885.
2.🧠 From the 2016 low (~$1,080) to today: ~+352% (≈ 4.5×).
3.🎯 $5,000 is the magnet level: Reuters notes traders are watching/holding for the $5,000 psychological threshold.
4.🏦 This cycle’s signature: central banks remain the anchor buyer — 1,045t added in 2024 (3rd straight 1,000t+ year).
5.💧 ETFs are back: physically backed gold ETFs saw record-setting demand bursts
6.🧨 The 2026 catalyst (right now): fresh safe-haven demand tied to elevated geopolitical/trade stress.
7.🧱 Structure matters: the multi-year base/breakout thesis (2024) has evolved into an “ATH staircase” into 2026.
8.🥈 Silver is also in a historic move: it hit an all-time high around $95.87
9.📊 Relative performance: S&P 500 finished 2025 up ~16.39%, while gold’s 2025 run was widely described as exceptional
10.🔥 Upside framing is now mainstream: some strategists explicitly model paths to $7,500/oz in 2026
________________________________________
🔥 What’s Different About This Bull Market 2026
•🏦 Central-bank dominance is the backbone
•💸 ETF flows returned in size, adding a powerful Western liquidity bid.
•📉 Rates/real-yield expectations still matter, but now gold also trades as a trust/sovereign-risk hedge during political and trade shocks.
________________________________________
🏆 Historic Gold Bull Markets — Timeline & Stats
1) 1968–1980 “Super Bull”
•Start/End: ~$35 → $850
•Gain: ~2,330%
•Drivers: End of Bretton Woods, oil shocks, double-digit inflation, geopolitics
•Drawdown: ~–45% before the final blow-off run
2) 1999–2011/12
•Start/Peak: ~$252 → ~$1,920
•Gain: ~650%
•Drivers: Commodities supercycle, EM demand, USD weakness, GFC safe-haven bid
3) 2016/2018–Present The “CB-Led” Cycle
•Cycle low (key anchor): ~$1,080 (2016)
•Latest / ATH: ~$4,885 spot; ATH $4,887.82 (Jan 21, 2026)
•Gain since 2016 low: ~+352%
•Primary drivers:
o🏦 Central banks: 1,045t added in 2024 (3rd straight 1,000t+ year)
o💧 ETF inflows: major re-acceleration, including record Q3 2025
o🌍 Geopolitics/trade shocks: renewed safe-haven urgency into Jan 2026
________________________________________
📊 At-A-Glance Comparison
Metric 1968–80 Super Bull 1999–2012 2016–2026 Current
🚀 Total Gain ~2,330% ~650% ~+352% (from ~$1,080)
⏲️ Duration 12 yrs 13 yrs ~10 yrs (ongoing)
💔 Max Drawdown ~–45% ~–30% ~–20%ish (not a deep secular washout so far)
🏦 Main Buyer Retail/Europe Funds/EM Central banks + ETFs/investors
🏛️ Pattern Secular parabolic Cyclical ramps Breakout → staircase ATHs → $5k magnet
________________________________________
📈 Top 10 Stats of the Current Bull Jan 2026 Edition
1.🟡 Price / ATH: $4,885 spot; ATH $4,887.82
2.🧮 Bull-cycle gain (2016 low): ~+352% from ~$1,080
3.🧲 Next magnet: $5,000 psychological level
4.🏦 Central banks: +1,045t in 2024 (3rd straight 1,000t+ year)
5.💧 ETF surge: Q3 2025 logged the strongest quarter on record (WGC)
6.🌍 2026 impulse: safe-haven bid tied to geopolitical/trade escalation
7.🥈 Silver confirmation: record ~$95.87 (Jan 20, 2026)
8.🧱 Demand pulse: WGC-linked commentary highlighted record-strong quarterly demand in 2025 (investment + CBs)
9.📊 Equity comparison anchor: S&P 500 2025: +16.39% (gold’s run continued to new records in Jan 2026)
10.🎯 Street framing: credible scenario work explicitly targets $5,000/oz as a 2026 outcome case
________________________________________
🎯 Strategy Ideas 2026+
Core simple + durable
•🧱 Hold/add on pullbacks via allocated physical, high-liquidity ETFs, and quality royalty/producer names.
•⚖️ Size it like insurance: you want enough to matter, not enough to force emotional selling.
Satellite torque, optional
•🥈 Silver (higher beta) + select miners only if you accept volatility (silver just proved it can go vertical).
Risk management
•🧯 Define your trim rules before the chart goes vertical:
otrim a slice into euphoric spikes, keep the core
oavoid leverage if you can’t stomach violent swings
________________________________________
🧪 Reality Check — What Could Cool This Bull?
•💵 Sustained USD strength + higher real yields
•🏦 Meaningful slowdown in official-sector buying
•📉 Big reversal in safe-haven demand if geopolitical/trade risk de-escalates fast
________________________________________
🔚 Updated Key Takeaways
•🏦 Central banks + ETFs are the twin pillars of this cycle.
•🟡 Gold is printing fresh records into Jan 2026 and $5,000 is the next psychological battleground.
•🧠 From $1,080 (2016) to ~$4,885, we’re up ~+352% — and the tape is behaving like a late-stage trend.

21.01.26 Daily ForecastPairs on Watch -
FX:NZDJPY
FX:EURUSD
A short overview of the instruments I am looking at for today, multi-timeframe analysis down to what I will be looking at for an entry. Enjoy!

XAUUSD H1 – Bullish Structure Holds After Early-Week GapHello, I’m Louna.
From the H1 perspective, XAUUSD continues to trade cleanly within a well-defined ascending channel, confirming that the broader bullish market structure remains intact. Price is still printing higher highs and higher lows, a clear sign that buyers are firmly in control of the dominant trend.
The early-week bullish gap reinforces this bullish context. Instead of immediately filling the gap, price has held above prior balance, suggesting sustained participation from strong hands. However, with price recently pushing closer to the upper portion of the channel, the market is now slightly extended away from its internal support, increasing the probability of a short-term corrective phase.
In strong gold trends, price rarely moves in a straight line. Corrections are a healthy and necessary process—they allow liquidity to rebalance and provide confirmation that demand beneath the market remains strong rather than speculative.
The primary zone I am monitoring lies between 4,580 and 4,600. This area aligns closely with the midline of the ascending channel and a previous demand zone that has already proven its relevance. Within momentum-driven uptrends, gold often forms a higher high, attracts late buyers, and then retraces to retest structural support before continuing higher.
If price stabilizes within this zone and we see clear bullish reactions—such as strong rejection candles or improving volume behavior—the bullish structure remains healthy, and the market will be well positioned for continuation toward the upper boundary of the channel, with upside targets extending toward 4,750 and potentially 4,800.
As always, confirmation is key. Closely observe price action and volume behavior around this support zone before committing to long positions. Maintain disciplined risk management, follow your trading plan, and avoid chasing price at extended levels.
Wishing you clarity, discipline, and consistent execution in your trading.

XAUUSD Holding Firm — Bulls Preparing the Next Expansion
Price is holding above the key support zone at 4825–4807, while strong demand remains around 4760–4740. As long as price stays above the demand zone, the bullish structure remains intact, with upside potential toward the 4997 target.
Note: This is for educational purposes only.
If you’d like more updates, please like and comment to boost the post!

(XAUUSD) Gold Bullish Trend With Expected Bearish CorrectionPrice is trading inside a bullish ascending channel after a strong break of structure.
Previous resistance has flipped into demand, confirming bullish continuation. Expecting price to seek buy-side liquidity above the highs, with a corrective pullback toward the demand flip zone before continuation into premium supply.
Bias remains bullish as long as price holds above HTF demand.

Doge and a BIG rise!Hi!
As shown on the chart, DOGE has clearly broken above the long-term descending trendline, which had been acting as resistance for several weeks. Following this breakout, price moved higher and confirmed the shift in market structure.
Importantly, the breakout was supported by a strong bullish engulfing move, taking out the previous local high. This price action strengthens the case for a trend reversal rather than a simple relief bounce.
After the impulsive move up, DOGE is now pulling back toward a key demand zone around $0.11–$0.13, which aligns with prior structure support and the breakout retest area. This zone offers a favorable risk-to-reward opportunity for long positions.
As long as price holds above this support, the upside target remains around $0.17, which corresponds to the next major resistance level and the projected move from the breakout.

New ATH at 96, But Is the Market Done “ATH-ing” for Now?Yesterday, Silver pushed toward 96 and printed what has become almost normal lately: another new all-time high.
As expected, once that level was reached, volatility exploded — and fortunately, I managed to catch a quick counter-trend scalp, banking around 1,100 pips in a short amount of time.
But the real question now is not about yesterday’s spike.
👉 Is Silver done making ATHs for now?
In my opinion: yes. At least temporarily.
🔎 Context: A Huge Move, and the Market Is Starting to Change Behavior
Since the beginning of the year, Silver is up more than 30%.
But more important than the percentage gain is the price behavior since Monday:
- after the weekend gap up
- the very short-term structure shifted into a topping formation
- rallies into 95 and slightly above are consistently being sold
That is typically the first sign that the market is moving from pure momentum mode into distribution / exhaustion mode.
It doesn’t mean the long-term trend is broken.
It simply means the upside is starting to get crowded, and the risk-reward changes completely.
⚠️ Technical Confirmation Level
For me, the correction becomes “real” if we get:
👉 a clean break below 92.70
If that happens, the most logical next move is:
🎯 90 zone — mainly for filling the weekend gap
And if the breakdown accelerates, I wouldn’t be surprised to see:
➡️ 85–86 zone as an extended correction target
Markets rarely move in perfect steps — and when a parabolic run starts to unwind, it can surprise both sides.
📌 Trading Plan (Short-Term Only)
My approach going forward is straightforward:
👉 Sell rallies
✅ as long as 96 remains the ATH / ceiling
This is not a “long-term bearish call”.
This is a short-term tactical trade in a market that may finally be ready to breathe.
P.S. (For Those Who Don’t Understand but Still Comment)
1️⃣ Long term, I’m extremely bullish Silver.
I wrote about it recently and nothing has changed on the macro view.
2️⃣ Yes, this is counter-trend.
That’s the point — it’s a correction trade, not a trend reversal call.
3️⃣ If I take it, it’s short-term only.
No “marriage” with the position.
4️⃣ I know how to take a loss.
And I take it fast when the market proves me wrong.
5️⃣ If targets don’t get hit, I know how to manage exits.
Break-even, small loss, small profit — I’m not here to “hope”.
In markets like this, discipline matters more than prediction. 🚀

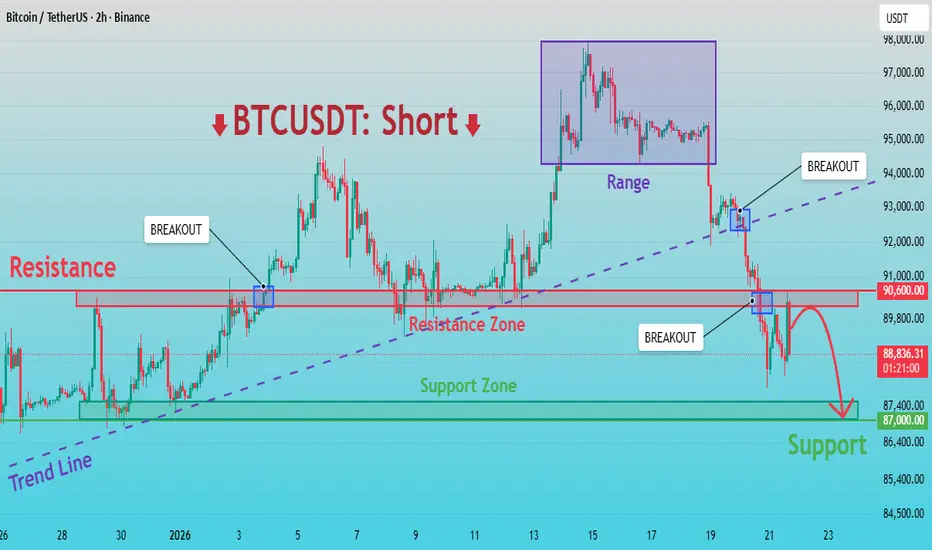
BTCUSDT: Breakdown Confirmed – Sellers in Control, Target to 87KHello everyone, here is my breakdown of the current BTCUSDT setup.
Market Analysis
BTCUSDT previously traded within a bullish structure, supported by a well-defined ascending trend line that reflected strong buyer control. After an impulsive upward move, price formed a consolidation range near the highs, indicating a temporary balance between buyers and sellers. Eventually, BTC failed to continue higher and broke down from the range, which became the first sign of weakening bullish momentum. This was followed by a decisive break below the ascending trend line, confirming a structural shift in favor of sellers. Subsequent recovery attempts were capped by a clearly defined Resistance Zone around 90,600, where multiple breakout attempts failed, signaling strong selling pressure.
Currently, BTCUSDT is trading below the resistance zone, forming lower highs and maintaining a bearish market structure. Upward moves appear corrective rather than impulsive, reinforcing seller dominance. Below the current price, a Support Zone near 87,000 stands as the next key area where buyers may attempt to slow the decline.
My Scenario & Strategy
My primary scenario remains bearish as long as BTCUSDT stays below the 90,600 resistance zone and does not reclaim the broken trend line. Any pullbacks into resistance that show rejection may be considered potential short opportunities. The main downside target is the 87,000 support zone, where price could react or temporarily consolidate.
However, a clean break and sustained acceptance above 90,600 would invalidate the bearish bias and suggest a possible transition back into consolidation or recovery. For now, market structure and momentum clearly favor sellers.
That's the setup I'm tracking. Thank you for your attention, and always manage your risk.
EURUSD Pullback Underway – Will 1.1700 Hold the Trend?EURUSD Pullback Underway – Will 1.1700 Hold the Trend?
Following Trump's comments on tariffs and Greenland, the high liquidity of the US dollar created unexpected weakness in it.
The price is currently correcting after the aggressive upward moves we had yesterday.
However, volatility is high given that the market is not clear about Trump's future decisions.
Price is near the first and strongest area of the structure from where it could bounce off 1.1700 to resume the uptrend.
However, we need to be careful because if 1.1700 is broken, the next support area could be found near 1.1660.
Both scenarios are possible with this crazy marker. Watch carefully for signs of a reversal near these areas.
You may find more details in the chart!
Thank you and Good Luck!
❤️PS: Please support with a like or comment if you find this analysis useful for your trading day❤️

Gold — The Move Is Too Extended to BuyYesterday I stayed out of Gold trading because, as explained in my previous post, none of my scenarios — neither for buying nor for selling — were confirmed by price action.
And that decision proved correct.
🔥 Recap: The Last 24 Hours Have Been Extreme
What we’re seeing right now is an incredible momentum run.
From yesterday, Gold has rallied roughly 2,000 pips and counting — and depending on how you measure the full extension from Monday, the move is approaching 3,000 pips.
This is not normal price behavior.
This is vertical movement, driven by momentum, emotion, and positioning.
✅ Mediun Term Bias: Very Bullish… But No Buy Entry
Even though I remain very bullish on Gold, at this stage I don’t see a realistic place to enter a long trade with:
- a logical structure
- and a manageable stop-loss
Buying at these levels feels less like trading and more like paying the market at any price just to be involved — and that’s usually expensive.
📌 My Approach: Look for a Short Setup Instead
So instead of forcing a long, my plan shifts toward looking for selling opportunities, but only if the market gives me the right structure.
For a short trade, I need two components:
1️⃣ an initial short-term correction (price must show weakness first)
2️⃣ a recovery in a corrective manner on the lower timeframes
(a weak bounce, not a new impulse)
If I get that sequence, then I will prepare for:
➡️ a new leg down
🎯 Target
If the plan confirms, my objective is at least:
✅ 1,000 pips downside, with a likely target area around 4750
✅ Conclusion
Right now, Gold is still in a very bullish environment — but the risk-to-reward for buying is non-existent.
So I’ll remain patient, wait for a correction + weak recovery, and only then look to execute a short with clear structure and controlled risk. 🚀

Elise | XAUUSD – 30M | Range Expansion After Liquidity SweepOANDA:XAUUSD
Gold engineered a clean stop-hunt below the range lows, grabbing liquidity before reversing aggressively. The impulsive bullish leg shifted short-term momentum upward; however, price is now pausing just below resistance. This indicates absorption and preparation, not immediate breakout. Patience is required — expansion will only come after confirmation.
Key Scenarios
✅ Bullish Case 🚀 (Conditional)
Clean break and hold above 4,685 – 4,695
🎯 Target 1: 4,715 – 4,725
🎯 Target 2: 4,750 – 4,760
❌ Bearish Case 📉 (Failure Scenario)\
Rejection from resistance with loss of 4,660
Pullback toward 4,620 – 4,600 liquidity zone
Current Levels to Watch
Resistance 🔴: 4,685 – 4,695
Support 🟢: 4,660, then 4,600
⚠️ Disclaimer: This analysis is for educational purposes only. It is not financial advice.

Natural Gas – Trend Shift in Progress?After being bearish bearish for a while, Natural Gas has broken out of the descending red trendline, signaling a clear shift in momentum from bearish to bullish.
What stands out here is how price reacted after the breakout. Instead of selling off again, it held above the recent support zone and started building higher structure.
As long as this new bullish structure holds, the bias remains to the upside, with room for continuation toward higher levels. Any pullbacks that stay above support are, for me, opportunities to watch.
⚠️ Disclaimer: This is not financial advice. Always do your own research and manage risk properly.
📚 Stick to your trading plan regarding entries, risk, and management.
Good luck! 🍀
All Strategies Are Good; If Managed Properly!
~Richard Nasr

Silver & the $100 MagnetFrom a long-term perspective, Silver remains clearly bullish, holding well above the blue rising trendline.
Zooming in, the short-term structure is just as clean. XAGUSD is trading inside a rising red channel, respecting both its upper and lower bounds with precision.
As long as this red channel continues to hold, my focus stays on trend-following long setups. The natural target remains the upper bound of the channel, which aligns perfectly with the $100 level, a round number that has been acting like a magnet for price.
What do you think? Does Silver tap $100 again before any deeper correction? 🤔
⚠️ Disclaimer: This is not financial advice. Always do your own research and manage risk properly.
📚 Stick to your trading plan regarding entries, risk, and management.
Good luck! 🍀
All Strategies Are Good; If Managed Properly!
~Richard Nasr

TheGrove | CHFJPY Sell | Idea Trading AnalysisYou can expect a reaction in the direction of selling from the specified Resistance zone,
CHFJPY moving higher as it tests the strong resistance level..
We expect a bearish move from the confluence zone.
Hello Traders, here is the full analysis.
I think we can soon see more fall from this range! GOOD LUCK! Great SELL opportunity CHFJPY
I still did my best and this is the most likely count for me at the moment.
-------------------
Traders, if you liked this idea or if you have your own opinion about it, write in the comments. I will be glad 🤝

AUUSD Breaks New Highs – Bulls in ControlGold is currently consolidating just above the 4710 level, indicating a potential bullish setup. If the price breaks above this entry, it may aim for the target of 4778, capturing a favorable upward momentum. It’s important to monitor the support level and maintain the stop loss at 4595 to manage risk in case of a pullback.

Hellena | GOLD (4H): LONG to 161.8% Fibo 4728 .Colleagues, the price is updating its maximum, and I think we shouldn't stop there.
After re-marking the waves, I realized that it would be more correct to place wave “3” at the 4549 level, since 5 waves fit well into it.
This means that the price is now in wave “5,” which can be quite unpredictable, but if we look at the blue waves, we can assume that there is now a medium-term impulse wave “3,” which means we can apply Fibonacci extension levels and see the 161.8% level as the target.
But I don't want to take such a risk and will set a slightly lower target - in the 4728 area. At the moment, we need to be very careful.
Manage your capital correctly and competently! Only enter trades based on reliable patterns!

US500 Forms Major Head & ShouldersUS500 Forms Major Head & Shoulders – Bearish Scenario Gaining Strength
The US500 is showing clear signs of exhaustion after a strong rally, with price action now forming a well-defined Head & Shoulders pattern on the 4H chart.
The structure is clearly visible, with the left shoulder, head, and right shoulder already in place, suggesting a potential trend reversal.
After failing to sustain higher highs, price has started to roll over and is now breaking lower, confirming bearish pressure.
If bearish momentum continues, we could see a deeper correction toward the following key support levels:
🎯 Targets:
6,745
6,660
6,578
You may find more details in the chart!
Thank you and Good Luck!
❤️PS: Please support with a like or comment if you find this analysis useful for your trading day❤️
