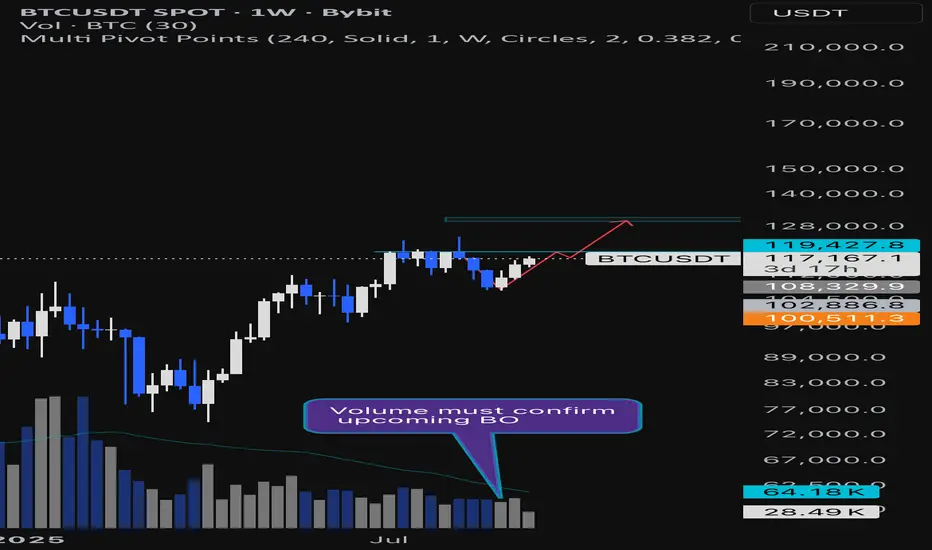
BTCUSDT Weekly Chart Analysis | Bullish V-Pattern Breakout ?BTCUSDT Weekly Chart Analysis | Bullish V-Pattern Breakout Possible
🔍 Let’s dive into the Bitcoin/USDT weekly setup and map out the current momentum, focusing on a key bullish scenario as price nears decisive levels.
⏳ Weekly Overview
Bitcoin is trading near $119,427, just below a major resistance zone at $119,430. A confirmed weekly close above this level, accompanied by sustained volume, would activate a textbook bullish V-pattern breakout. The V bottom structure is recognized for its aggressive buying pressure — price first sharply reverses from the support zone, then rallies as bulls take control, validated by both price and volume signals.
🔺 Long Setup:
A strong volume-backed weekly close above $119,430 unlocks a 10% move at RR1, projecting further upside toward the next reachable target at $130,000, which acts as a Potential Reversal Zone (PRZ). The setup relies on clean confirmation: breakout, high volume on the weekly, and consolidation above resistance for sustained momentum.
📊 Key Highlights:
- Weekly V-pattern maturation can drive a strong bullish leg if confirmed above $119,430.
- Volume confirmation is vital: look for above-average weekly bars to validate breakout strength.
- Target zone sits at $130k, an area with clustering past liquidity and technical importance (PRZ).
- If the breakout stalls or is rejected, expect price to retest lower bands; first support now sits at $113,000–115,000.
🚨 Conclusion:
A bullish scenario is building, hinging on a weekly close with volume above $119,430. Such confirmation would validate a breakout from the V-pattern and set sights on $130k, where trend participants may look to realize or reassess positioning. Failure at this level could reload bids at key lower supports. Stay sharp for volume cues and structural follow-through.
Chartpatterntrading
Nestle India Buy Alert – Golden Opportunity for InvestorsNestle India – Technical Update
Timeframe: 1-Hour Chart
Price Action: Nestle India is trading within a well-defined parallel channel.
Support Zone: Currently sustaining above the 1170–1180 LOP support zone.
Outlook: If the stock holds this level, we may witness upside momentum.
Potential Target: 1280–1290 near the channel resistance.
Thank you!

Big pattern alert on Varun Beverages Ltd.Eyes on the move..Varun Beverages Ltd (VBL) – Technical Update
On the daily chart, VBL is trading within a well-defined parallel channel, with a strong support zone around ₹425–437.
The stock is also forming a Symmetrical Triangle Pattern, with immediate support in the ₹450–460 zone.
If these levels hold and sustain, we may witness higher price levels in the coming sessions.
Chart structure indicates strength – keep this stock on your watchlist.
Thank you!

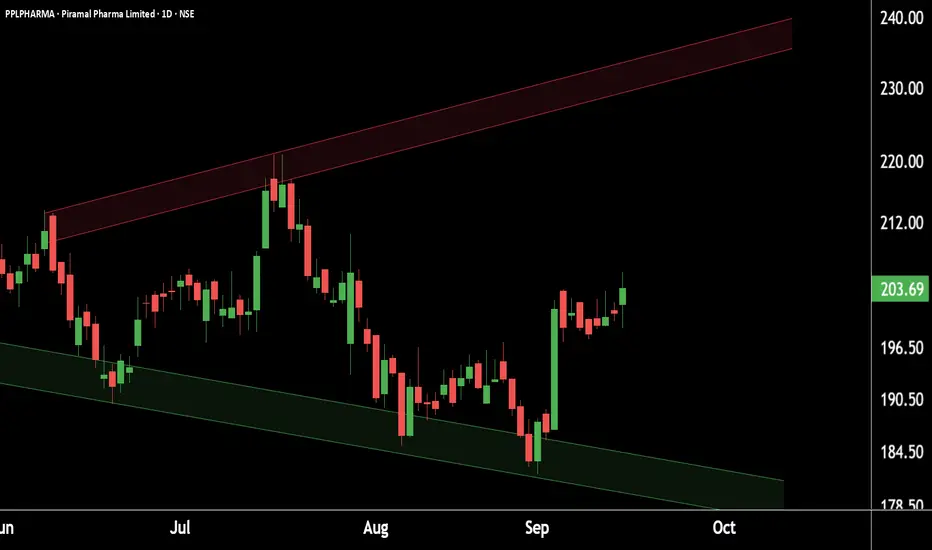
Piramal Pharma setting up for a breakout – pattern looks strong!This is the daily chart of Piramal Pharma (PPLPHARMA).
PPLPHARMA is forming a Bow & Tie pattern and has reversed from the support zone, currently sustaining in the ₹195–200 range.
If this level holds, we may witness higher prices with a potential upside target around ₹230.
Thank you !!
CESC on the Verge of Upside Momentum – Buy SuggestedCESC Breakout Update (4H Chart)
The stock has given a breakout on the 4-hour timeframe.
The short-term polarity zone, earlier acting as resistance, is now expected to act as support around 158–160 levels.
If the stock sustains above this zone, we may see further upside momentum.
Potential Targets: 170 / 180

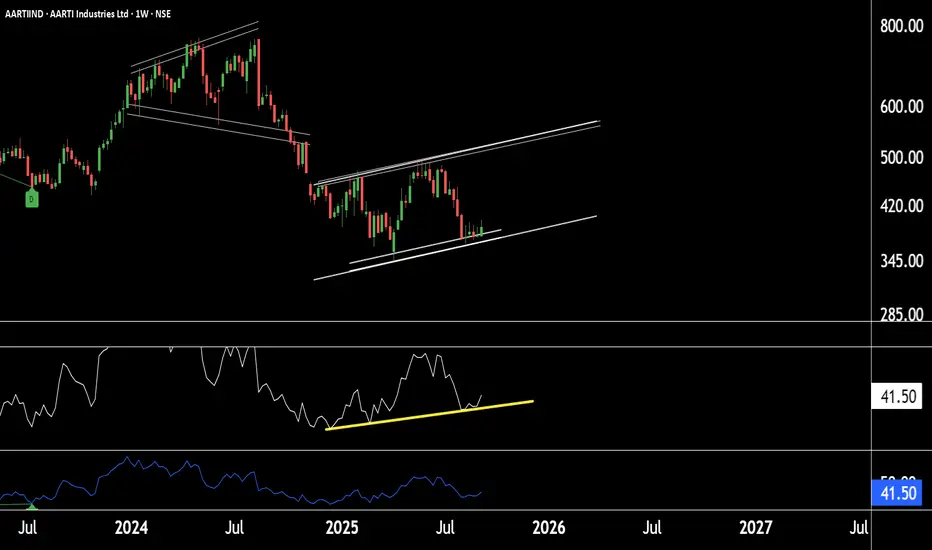
Aarti Industries at Solid Base – Potential Upside Loading!!Aarti Industries – Weekly Chart Update
Chart Pattern: Stock is trading within a shorter-timeframe parallel channel.
Support Zone: Strong support observed near ₹370 – ₹380 levels.
RSI Indicator: RSI is also taking support and moving upward, indicating positive momentum.
Trend Outlook: If this support zone sustains, the stock is likely to move into an uptrend.
Price Projection: Potential for higher levels at 500-521 in Aarti Industries.
Thank you!
Long Term Buy Position in GBPUSDICMARKETS:GBPUSD has completed Head & Shoulder on Daily Timeframe on 25th August 2025
In this trade, I will not follow any noise as it is a long term trade with high pips in Risk but even higher reward intact. I am waiting for this price action since one month but it is not triggering the cleaned Head and Shoulder's breakout at 1.3596.
I have placed a Buy Stop Order at 1.3596 with my SL at low of inversed right shoulder.
I will take two positions both at the breakout of right shoulder at 1.3596. Both position has 2% risk in total
Position 1 with 1 % Risk
Buy Stop: 1.3596
Stop Loss: 1.3388
TP: 1.3815
Position 1 with 1 % Risk
Buy Stop: 1.3596
Stop Loss: 1.3388
TP: 1.3815

HINDCOPPER Buy Zone Unlocked – Big Move AheadHindCopper Daily Chart Update
HindCopper is sustaining above the Line of Polarity (LoP).
Strong support zone is visible near 240–245 levels.
If this support holds, stock may move higher towards 275–282 levels.
Thank You !!

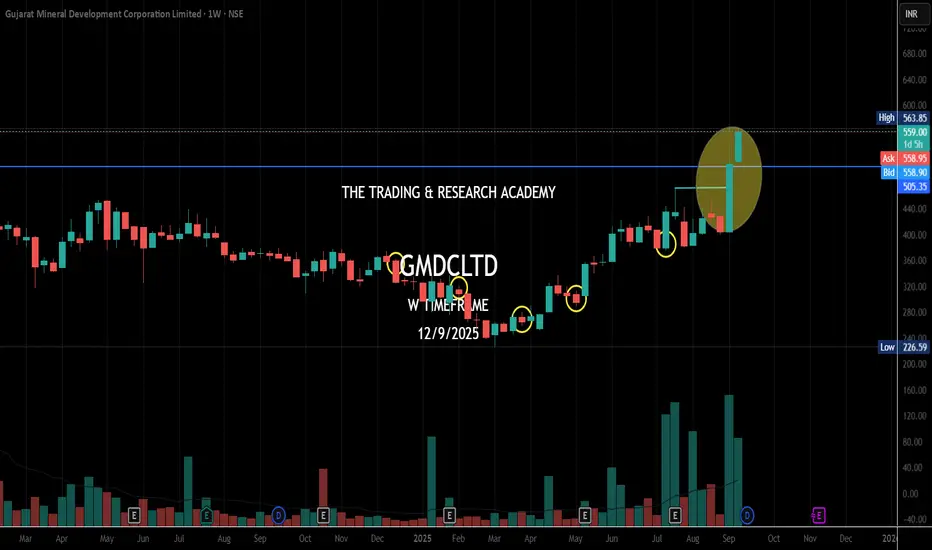
Chart Speaks - #GMDC#GMDCLTD : ENGAGED WITH MYANMAR TO PROCURE RARE-EARTH MINERALS|| GOVT HAS ASKED PSUS, PRIVATE COS TO SEE PROSPECTS OF SAMPLE COLLECTION FROM MINES IN NORTHEAST MYANMAR
GMDC is up36% in 2 days! Chart Speaks, Someone knew this already. Look at the chart
#chartspeaks
HUDCO at Strong Support – Bull Run Ahead!This is the daily chart of HUDCO.
HUDCO is moving within a well-defined parallel channel and is currently sustaining near the channel support zone of 198–205.
If this level holds, we may see higher prices in HUDCO.
Thank you.

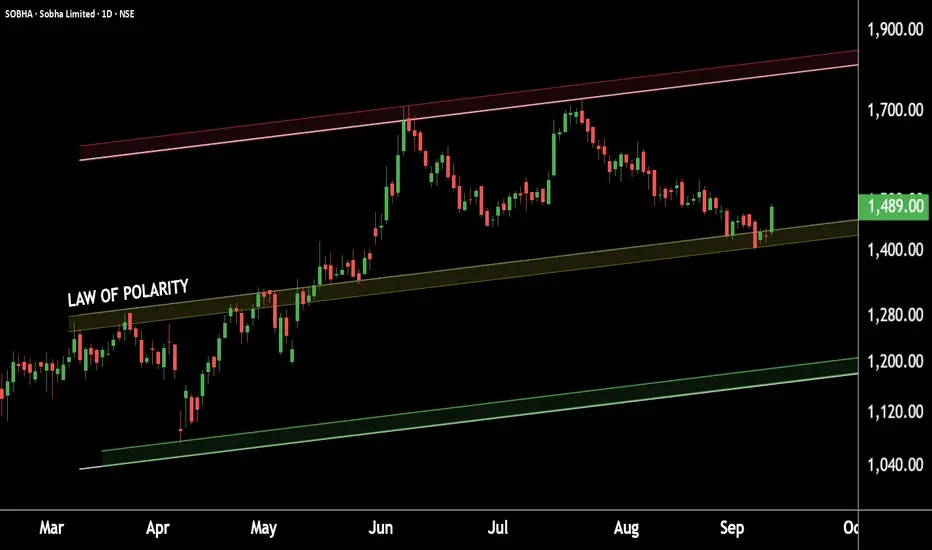
SOBHA Limited: Building Momentum from the Base!This is the daily chart of SOBHA Ltd.
The stock is currently taking strong support at Law of polarity near at the 1400–1450 zone.
If this level sustains, we may witness higher prices in SOBHA Limited.
Thank You !!
Energy Giant on Fire – GAIL Ready for TakeoffThis is the 4-hour timeframe chart of GAIL India Limited.
The stock is currently trading within a well-defined parallel channel and is positioned near its support zone at 165–171.
If this support level sustains, we may witness higher prices in GAIL, with potential targets in the 185–190 range.
Thank you.

Infosys Holding Strong at Powerful Support – Big Move AheadThis is the weekly chart of Infosys (INFY).
INFY is currently trading within an ascending parallel channel, with a strong support zone in the ₹1300–₹1400 range.
The stock has shown a bounce from this level, offering traders and investors a favorable opportunity to accumulate.
If this support sustains, the next potential upside targets are around ₹1750–₹1800, with the upper boundary of the channel positioned near ₹2100–₹2200.
Thank you.
ICICIBANK: Support Zone & Hidden Setup UnfoldingICICI Bank – Technical Outlook
On the daily and 1-hour charts, ICICI Bank is showing strength near a key support zone of 1370–1390.
On the 1-hour timeframe, the stock is forming a diamond pattern around the 1380–1400 range.
A sustained move above this support zone may trigger upside momentum and lead to higher price levels in the coming sessions.
Conclusion: ICICI Bank is currently at a crucial support area with a developing bullish structure. Traders and investors should monitor these levels closely for potential opportunities.

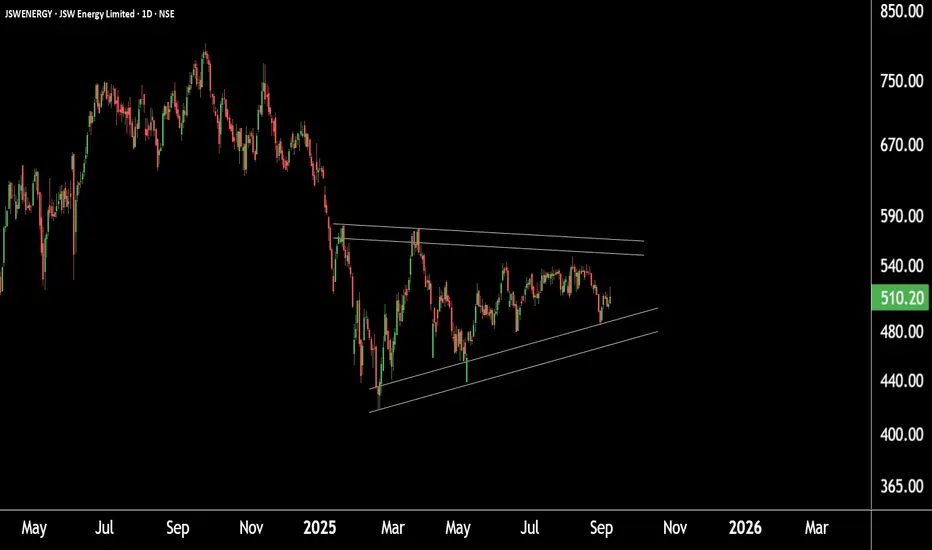
Chart Alert: Major Pattern Formation in JSW EnergyThis is the daily timeframe chart of JSW Energy.
The stock is currently forming a symmetrical triangle pattern with support around ₹465–₹475 and resistance near ₹564–₹570.
If JSW Energy sustains above this resistance zone, it could trigger a breakout, potentially leading to higher price levels in the coming sessions.
Thank you.
Tata Motors smashes resistance – Power packed rally ahead!This is the 4 hour chart of Tata Motors.
Tata Motors recently gave a breakout on the shorter timeframe around the ₹700 level and is currently trading near ₹721.
The stock has established a strong support zone between ₹690–₹700. If it sustains above this level and the current momentum continues, we may see a potential upside towards the ₹750–₹760 range in the shorter timeframe.
Thank you.

Gold 1H Outlook | Key Levels to Watch – 3595 | 3625 | 3470Gold is trading near 3594 after a strong bullish move. On the 1-hour chart, price has been following a rising trendline which shows that buyers are still active.
Here’s what matters for traders today:
🔹 Key Support Levels:
3560 → intraday support where buyers are stepping in.
3525 → major structural support + trendline confluence.
🔹 Resistance Zones:
3595 → first resistance, market is already reacting here.
3625 → next upside objective if buyers stay in control.
📌 Bias:
As long as price holds above 3525, gold remains bullish. Upside path: 3595 → 3625.
A confirmed break below 3525 would mean a shift in structure. In that case, sellers may push price towards 3470

Gold Price Action: Liquidity Sweep & Bullish ContinuationThis is a 30-minute chart for Gold (XAU/USD) with a smart money concept (SMC) analysis. Here's a short breakdown:
🔍 Key Analysis:
Sweep Liquidity (Highlighted Area):
Price previously swept liquidity above recent highs, indicating a stop-hunt or liquidity grab before reversing.
Current Market Structure:
Strong bullish impulse move upwards.
Followed by a retracement (small bearish candle) indicating potential pullback in play.
OB M30 (Order Block - 30 Min):
Marked as a demand zone.
Price is expected to retrace into this OB area (around 3,550–3,560) before a continuation upward.
Projected Path:
Blue arrows suggest price may dip to the OB, gather demand, then rally back up toward the ATH (All-Time High) zone at 3,597.451.
🧠 Smart Money Insight:
Sweep + OB Combo is a typical SMC setup for a long position.
If price respects the OB zone, there's a high probability of continuation to new highs.
✅ Bias: Bullish
Entry idea: Look for long setups near OB M30 zone (3,550–3,560), targeting ATH and beyond.
Let me know if you want risk-reward details or stop loss/entry suggestions

EUR USD Trade Setup 1 hour timeframe EUR USD has formed a Head and Shoulders break and retest pattern, and the price is currently at the retest level.
Additionally the retest level also align with the 0.50 - 0.618 Fib Retracement level.
Now lets wait for Entry Confirmation.

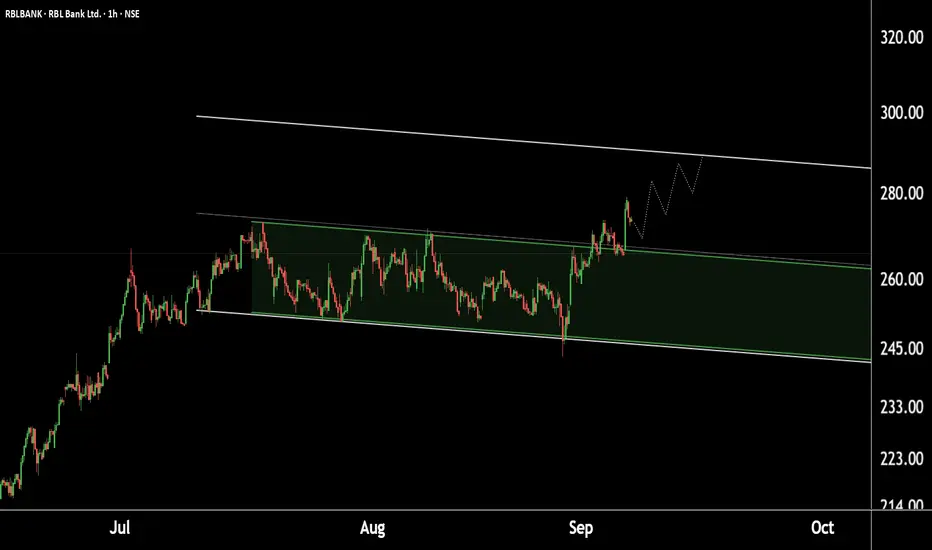
Momentum building in RBL Bank – Long positions can be consideredRBL Bank – Technical View (1 Hour Timeframe)
RBL Bank has given a breakout from the falling channel, indicating potential bullish momentum. The stock has immediate support in the ₹260–265 zone, which may act as a retest level post-breakout.
If this support zone holds, we may see an upward move towards the potential target range of ₹285–290.
THANK YOU !!
Strong base + steady trend = Buy City Union BankCity Union Bank (CUB) – 4H Chart Analysis
Polarity Zone: Stock holding well near 185–190 levels.
Pattern: Moving inside a short-term falling channel.
Support: Strong boundary support near 190.
Outlook: If this support zone sustains, we may see higher prices ahead in CUB.
Thank you.

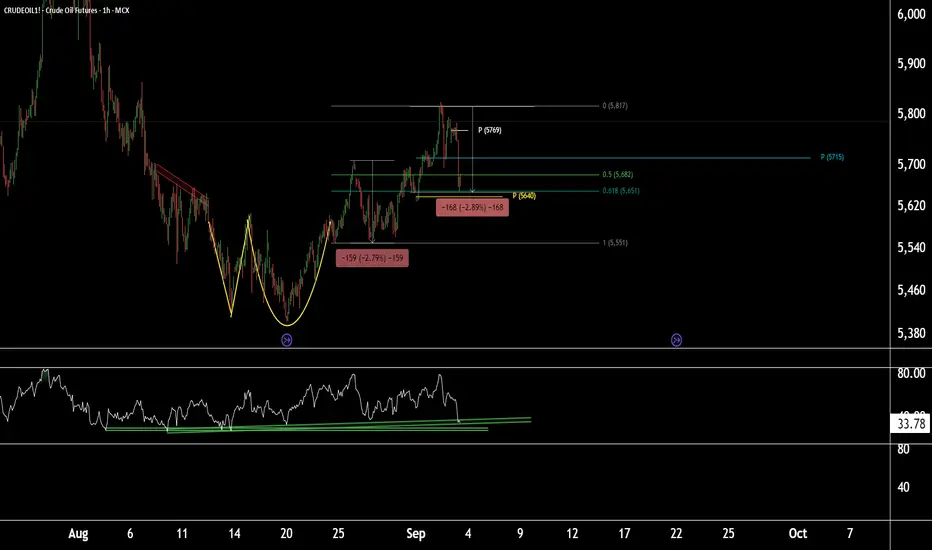
Price action + RSI support = fresh buy opportunity in CrudeOil1!CrudeOil1! (1-Hour Timeframe) Technical Outlook
CrudeOil1! is currently sustaining at the Fibonacci Golden Ratio level of 0.618, with the weekly pivot placed near 5640. Based on Fibonacci projections and price action, this 5640 zone appears to be a crucial area, as it aligns with a 2.8% retracement completion.
On the 1-hour timeframe, the RSI is showing a decline but may take support near the current levels, adding further weight to this support zone.
All technical indicators together suggest that the 5640–5650 zone could act as a strong support in the short term. If this support holds, we may see upside targets at 5715 and 5750, with the potential for CrudeOil1! to make a new high if the bullish momentum continues.
Thank you.
Momentum building… Canara Bank in the spotlightCanara Bank (CANBK) Technical View
Canara Bank is currently trading within a well-defined parallel channel and has recently bounced strongly from its demand zone near 100–105.
At the same time, the stock is also moving inside a falling channel pattern, which provides important reference levels:
Support is placed around 105–107
Resistance is seen near 115 and 122
Importantly, the stock is sustaining above its daily, weekly, and monthly pivot levels, signaling strong upside potential. In addition, the RSI is holding above 50, which indicates momentum is building and a strong move could emerge at any time.
If the stock manages to hold the support levels, there is a strong possibility of witnessing higher prices in Canara Bank in the coming sessions.
Thank you.
