JK Tyre gripping the market! Potential wealth creator in market.JK Tyre is currently showing strong technical strength on the weekly timeframe:
The stock is sustaining above its 9-year law of polarity, with a major support zone around ₹250–260, which has already been respected.
It is trading within a well-defined ascending parallel channel, with channel support near ₹300–320.
Multiple moving averages are also acting as strong support – EMA at ₹270, EMA at ₹290, and SMA at ₹320.
Conclusion:
JK Tyre is technically well-supported at lower levels and is respecting long-term support zones. The stock is showing positive momentum within its channel structure, making it an attractive candidate for medium to long-term investors Best Accumulation Zone: ₹300–320 (near channel + SMA support).
Secondary Entry (deep support): ₹270–290 if the stock dips.
Chartpatterntrading

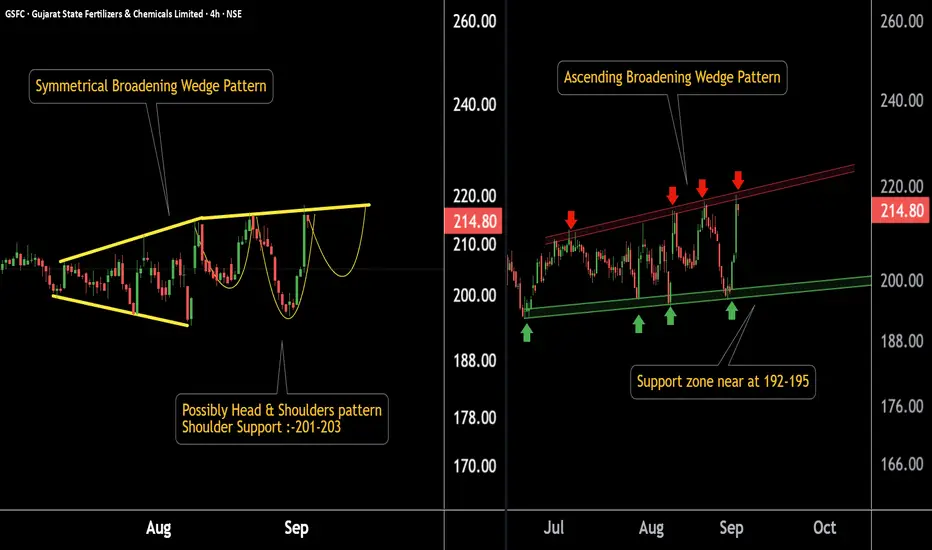
GSFC chart showing a hidden setup… Is this the breakout moment?GSFC Chart Update (4H Timeframe)
Chart 1:
Stock has formed a symmetrical broadening wedge.
If the stock respects the resistance, there is a possibility of a Head & Shoulders pattern.
Key support zone: 202 – 204.
Chart 2:
GSFC is forming an ascending broadening wedge pattern.
Support lies in the 192 – 195 range.
If this level sustains, potential pattern target is around 240.
Thank You !!
A Descending Triangle Chart Pattern in a making .. A descending triangle chart pattern in a making , if it break upwards go for long if its breaks downwards go for short visa versa always put STOPLOSS
Breakout Alert!Granules India is ready to shine—watch this spaceGranules India Limited – Technical Outlook
Weekly Timeframe
Granules India is moving within a well-defined parallel channel. The stock is currently approaching its middle boundary resistance near 560–590 levels and support near 430-450
On the daily chart, the stock has formed a descending parallel channel, and this time, the chances of a breakout are higher as the price action has developed a double bottom formation.
Daily Timeframe
Additionally, Granules India is forming an ascending broadening wedge pattern, with key resistance near 590 and support around 430, which was successfully tested before making a new high.
Overall, the technical structure indicates strong breakout potential in the near term.
Thank You !!

ETHUSD holds support & breaks out📊 ETHUSD – Daily Timeframe Update
ETHUSD had formed a descending broadening pattern, which has already broken out.
Price is now retesting the support zone at 3600–3700.
From its last leg, ETHUSD is moving inside an ascending parallel channel.
Within this channel, it shows range-bound action near the 3650–3700 support zone.
If ETHUSD dips again and sustains above 3650–3700, it may provide a strong long opportunity.
Thank You !!

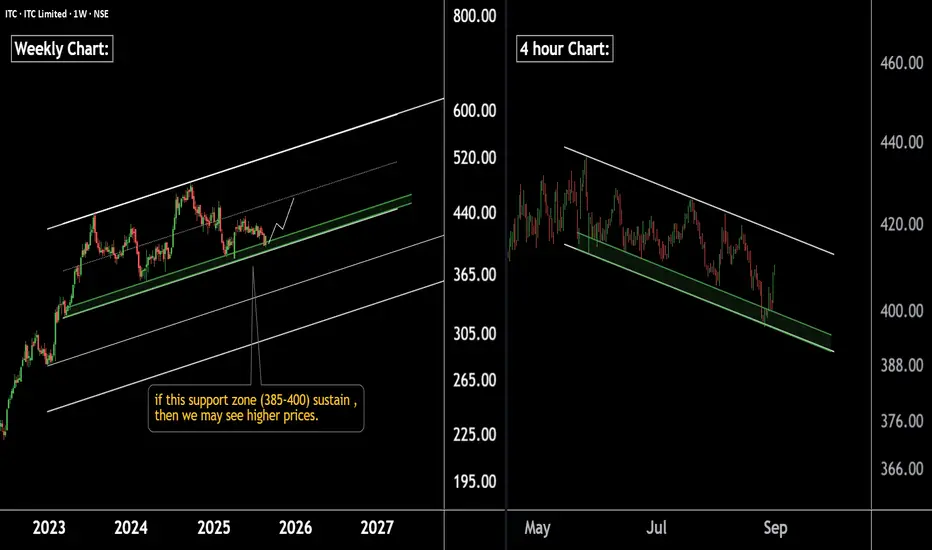
ITC at strong support zone. A good opportunity for accumulation.ITC Chart Update (Weekly & 4H Timeframe)
On the weekly chart, ITC is moving within a well-defined parallel channel, with immediate support in the 385–400 zone. A breakdown below this zone could take the stock towards the next strong support near 300.
On the 4-hour chart, ITC is forming a falling channel, with support also placed around the 390–400 zone. If this level holds, we may witness a potential upside move in ITC.
Conclusion: The 390–400 zone will play a decisive role. Sustaining above it may trigger an upward move, while a breakdown could extend weakness towards lower levels.
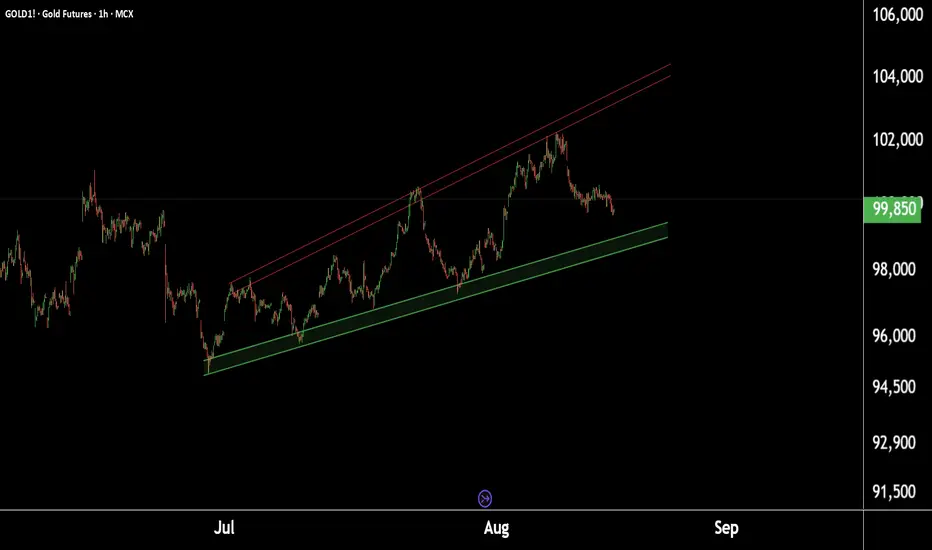
Gold at Resistance ! Next move will decide trend.Daily Chart Update – Gold1!
Gold is currently forming a rising wedge pattern, with resistance near the sell zone of 103550–103700. The metal is also trading within a well-defined ascending parallel channel, where the channel resistance aligns with the first selling level around 10500.
On a percentage basis, after a 5–6% upward move, gold has reached the key levels of 104700–10500. If these resistance levels hold, we may witness a potential decline in prices. Accordingly, positions can be shifted, and selling opportunities may be considered in line with both the pattern formation and the overall market structure.
Conclusion: According to the pattern and overall structure, 103500 is the first selling zone, while further resistance lies at 104700–10500. Sustaining below these levels could open the way for lower prices.

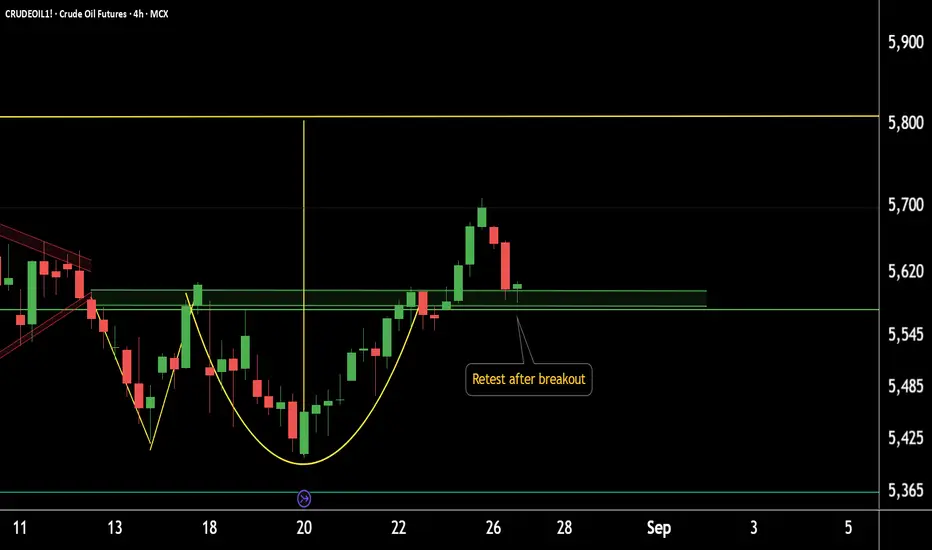
CRUDEOIL1! breakout + support confirmation=potential upside move4-Hour Chart Update: CRUDEOIL1!
CRUDEOIL1! has retested the breakout zone at 5580–5600.
If this level sustains, we may see higher prices ahead in CRUDEOIL1!.
Thank you!
LIC on the Rise!Chart structure indicates long positions favoredLIC Daily Chart Update
LIC is currently moving in a well-defined ascending parallel channel.
Alongside, a short-term descending parallel channel is also visible.
Both channels are showing strong lower boundary support in the 830–850 range.
If this support zone holds, we may witness higher prices in LIC in the coming sessions.
Thank you.

PUMP Breakout Alert!🚨 NYSE:PUMP Breakout Alert! 🚨
NYSE:PUMP is currently testing the red resistance zone 🔴
At the same time, it has formed a bullish Double Bottom pattern ✅
If price breaks out, the first target will be the green line level 🎯
This setup could confirm strong bullish continuation if buyers hold momentum.

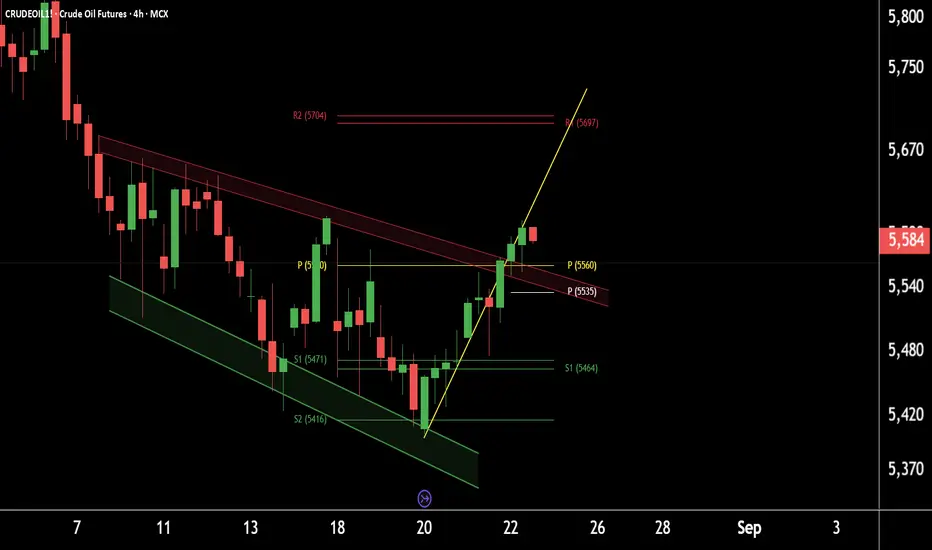
Crude Oil breaks out of falling channel –Watch for higher level.This is the 4-hour timeframe chart of CrudeOil1!.
The price has been moving within a well-defined falling channel and has now given a breakout. A possible retest of the breakout level around 5560 may occur, after which CrudeOil could move towards the falling channel completion target near 5700.
Weekly pivot support is also placed around the 5400–5450 zone and resistance around 5700.
If this level is sustained, we may see higher prices in CrudeOil1!
Thank You !!
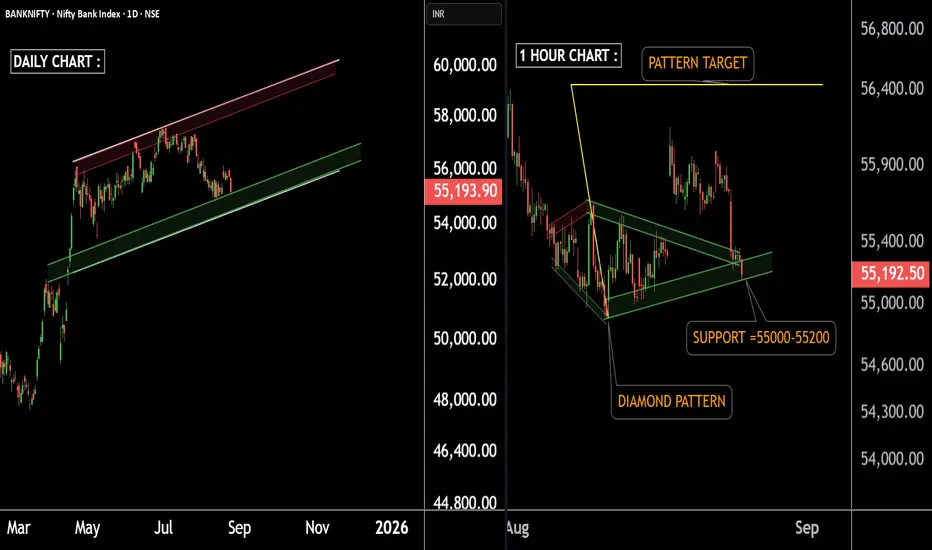
Bullish setup spotted in Bank Nifty – Time to go long.There are two charts of Bank Nifty – one on the Daily timeframe and the other on the 1-Hour timeframe.
On the Daily timeframe, Bank Nifty is taking support on a parallel channel with a support zone around 55,000–55,200 and if makret then support is near 54500 in extreme case.
On the 1-Hour timeframe, Bank Nifty has formed a Diamond Pattern and, after the breakout, is also taking support near 55,000–55,200.
If Bank Nifty sustains this level, we may see higher prices with the pattern target projected around 56,200–56,500.
Thank You !!
Breakout spotted in Jindal Stainless – momentum could accelerateThis is the daily chart of Jindal Stainless (JSL).
JSL is currently trading near its resistance zone, while the RSI is sustaining above 69.This indicates strong momentum, and the stock may give a breakout this time.
JSL has a strong support zone in the 700–720 range.
If a breakout occurs, we may see higher prices in JSL.
For a safer trade, one can wait for a retest near the support zone before entering, which may provide a better risk-reward setup for capturing the upside move.
Thank You !!

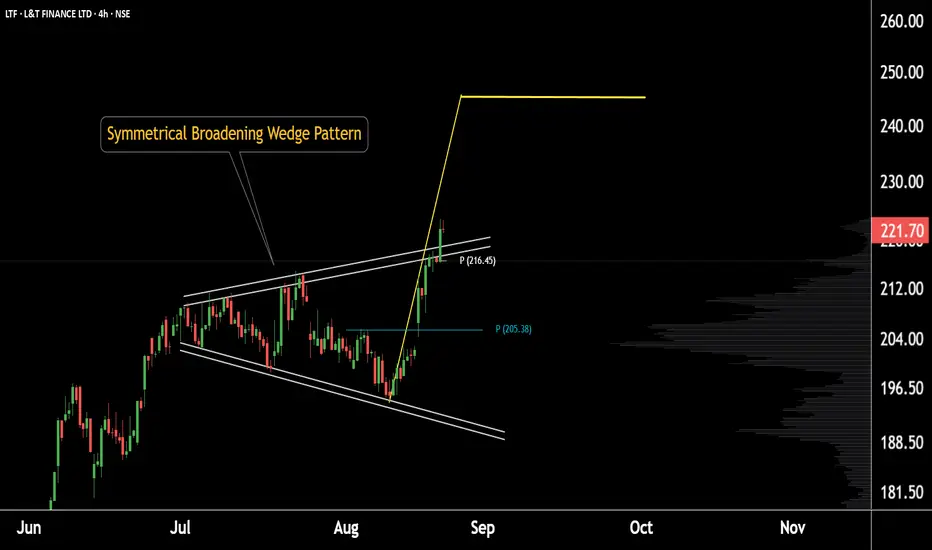
L&T Finance breakout in action – bulls taking chargeThis is the daily chart of L&T Finance.
The stock has been forming a broadening wedge pattern and has recently given a pattern breakout around 220.
Currently, L&T Finance is sustaining above its daily pivot level of 216, with strong support in the 215–220 zone.
If this support holds, we may witness higher prices in the stock.
Thank you.
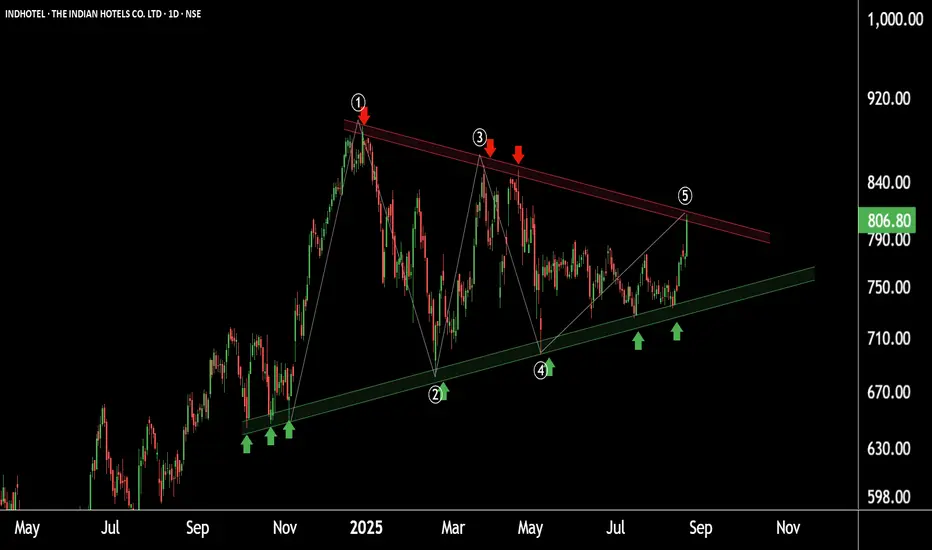
Indian Hotels: Pattern Discovery Signals Potential RallyIndian Hotels is currently forming a Symmetrical Triangle Pattern with:
Support: near ₹730
Resistance Zone: ₹800–810
As the wave structure is now complete, a breakout from this pattern is highly possible.
📈 If the breakout occurs, we may witness new highs in the stock.
THANK YOU !!
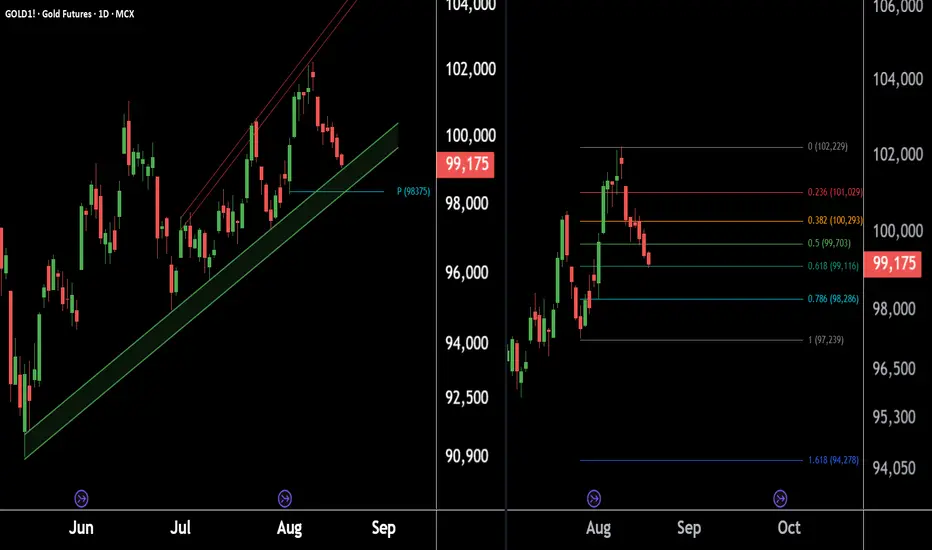
Gold is testing key levels – setup indicates a favorable buying.Here are 2 charts of Gold on the Daily Timeframe.
GOLD1! is approaching its support zone, with key levels at ₹98,200 and ₹98,800.
The Monthly Pivot at ₹98,375 also aligns with this zone, indicating a strong support area.
Fibonacci Golden Ratio is also indicating key support levels around ₹99,200 and ₹98,200, which may act as strong demand zones.
If respected, these levels could trigger a fresh upside move.
Thank You !!
ICICI Bank on the move! A strong buy opportunity spotted.There are two charts of ICICI Bank—one on the 1-hour timeframe and the other on the 4-hour timeframe.
On the 4-hour chart, ICICI Bank is trading within a well-defined parallel channel, with strong support in the 1400–1410 zone.
“On the 1-hour chart, ICICI Bank is forming a Symmetrical Triangle pattern with support near 1424. The weekly pivot level at 1423 may also act as strong support, while the monthly pivot at 1450 is acting as resistance. The pattern breakout indicates a potential target of 1465.
If this support level holds, the stock may witness higher price levels.
Thank You !!

ETH — Right-Angled Broadening BreakoutEthereum (ETH) has completed a Right-Angled Descending Broadening Pattern that developed over a period of 515 days. Such long-term structures are rare and often mark significant turning points in the market.
🔎 Pattern Breakdown
A–E → swings inside the broadening formation.
F → breakout above the flat resistance.
G (anticipated) → Retest of the breakout zone near $4000, where former resistance may establish itself as support.
The flat top resistance between $4000–$4100 has already given way. A successful retest and hold above this zone would confirm breakout validity and strengthen the probability of continuation toward ATH and beyond.
Trade Setup View
Retest entry zone (G): ~$4000
Invalidation (Stop-Loss): To be determined based on price action during the retest
TP1: Retest of ATH $4867
TP2: $5390
Final target (measured move): $6800
Risk-to-Reward: 1:7+ potential
Why $6800?
The measured move of a broadening formation is its full height projected upward from the breakout point:
Broadening low: $1383.26
Broadening high: $4109
➡️ Height = $2725.74
Add that to the breakout zone (~$4100) → $6825. Rounded, that gives a final target of $6800.
💡 Educational Takeaway
Right-Angled Descending Broadening Formations show growing volatility with buyers holding a ceiling steady while sellers run out of steam. Once that flat resistance breaks, momentum usually shifts in favour of the bulls. Since this one lasted over 500 days, the breakout isn’t just noise. It’s a macro signal that could define ETH’s next major trend leg.
Level to Watch Closely:
$4000 → the expected retest (G). Holding here would be a strong confirmation that ETH is ready to aim for ATH and price discovery.
_________________________________
💬 If you found this helpful, drop a like and comment!

Opportunity Knocks! Fresh buying interest visible in CAMS.This is the daily timeframe chart of CAMS.
The stock is currently trading within a well-defined parallel channel, with a strong support zone near ₹3600–₹3700.
If this level holds, we may witness higher prices in CAMS.
Thank you !!

Spotlight on WIPRO: Building Momentum for Potential GainsThis is the daily chart of WIPRO.
WIPRO has a strong support zone in the 230–240 range.
If this level holds, we may see higher prices in WIPRO.
Thank You !!
Gold at Crucial Levels – Buy or Sell? Watch These Key Price ZoneDaily Gold Update:
This is the daily timeframe chart of Gold1!.
Gold1! is forming an ascending broadening wedge pattern with support in the ₹98,500–₹98,800 range.
If this support holds, we may see higher prices.
However, if it breaks, Gold1! could decline towards its pattern target near ₹95,000.
Thank You !!
FETUSDT|C&H Setup +100% Breakout MA cluster-A High Quality BreakCup&Handle setup with a high quality breakout the confluent MA cluster—especially the 200-day— as the gatekeeper.
If price hold above the ma200 (and the nearby 20/50) cluster a high-quality breakout and more likely to break the handle and the cup rim.
Here is how I’d weigh it and trade it: DON'T WAIT FOR CUP RIM BREAKOUT
Priority of BUY signal strength indication:
1. Daily close & hold above the ma200 dynamic resistance the most institutions watch - follow BUY
2. Cup handle breakout watch for volume expansion on the break (> 20-day average)
3. Cup rim breakout with a golden cross ma20 reclaim > ma50 curl up is a follow-through BUY
Decision matrix:
- Breaks above key fib level - look for a shallow retest of the breakout line / MA bundle at key fib zone 38.2% - 61.8% liquidity zone for proper trailing stop / limit order.
Target
- TP1 100% fib zone (+50%)
- TP2 extended 161.8% (+100%)
SL slightly below previous low
RR: 3:1
Always trade with affordable risk and respect your stop!

Engine Started! Tata Motors Buying Opportunity Ahead !!This is the daily timeframe chart of Tatamotor.
TATAMOTORS haing a good support near at 630 level .
TATAMOTORS is making AB=CD pattern and it's pattern is compliting near at 630 level , may this level act as the support now.
F.I.B golden ratio is also indicating that 630 may act as the support level.
If this level is sustain then we may see higher prices in TATAMOTORS.
Thank You.
