Aug 7, 20 - ES Futures - Wyckoff chart Reading by sand tradingAug 7, 20 - ES Futures - Wyckoff chart Reading by sand trading
Chartreading

Aug 6, 20 - ES Futures - Wyckoff chart Reading by sand tradingAug 6, 20 - ES Futures - Wyckoff chart Reading by sand trading

Aug 6, 20 - KNDI Stock - Wyckoff chart Reading by sand tradingAug 6, 20 - KNDI Stock - Wyckoff chart Reading by sand trading

Aug 5, 20 - ES Futures - Wyckoff chart Reading by sand tradingAug 5, 20 - ES Futures - Wyckoff chart Reading by sand trading

Aug 5, 20 - ADT Stock - Wyckoff chart Reading by sand tradingAug 5, 20 - ADT Stock - Wyckoff chart Reading by sand trading NYSE:ADT

Aug 4, 20 - ES Futures - Wyckoff chart Reading by sand tradingAug 4, 20 - ES Futures - Wyckoff chart Reading by sand trading

Aug 4, 20 - CARS Stock - Wyckoff chart Reading by sand tradingAug 4, 20 - CARS Stock - Wyckoff chart Reading by sand trading

Aug 3, 20 - ADT Stock - Wyckoff chart Reading by sand tradingAug 3, 20 - ADT Stock - Wyckoff chart Reading by sand trading NYSE:ADT

July 31, 2020 - KNDI Review - Wyckoff Chart Reading NASDAQ:KNDI
July 31, 2020 - KNDI Review - Wyckoff Chart Reading


BTC: Recent trap - bearish message from chartPrice has more odds of breakdown from ABC triangle. In this case, the bearish move toward point D could develop.

Gold ShakeoutMarket designed to make more losers than winners. That is why we have such moves. I call them SLKs - Stop-Loss Killers.
When passengers kicked off from wagons, the train-driver can move higher.

More bullish than bearishAnalyst stock index for June 03, 2020
In this analytical overview, we consider the situation in the stock index s&p 500 index - a popular financial contract that displays the “health” of the stock market with high accuracy. I use the data from CME.
On this chart you see a black horizontal line, it marked an important level of 3,000 dollars for the contract. This is an important psychological level. Note how at the end of February and early March, the price interacted with 3k line. After the breakdown of 27 February was followed by a small upward correction, which ended on low volumes on 4 March (the indicator of the weakness of the demand). Then panic followed through to a minimum of 23 March.
What to expect next?
Recent data suggests that the market is more bullish than bearish.
From a technical point of view, there is an important event is the increase in volume (it is indicated by a black arrow in the histogram in the lower part of the graph). This increase in volumes was due to the characteristic activity of traders on the breakout of the psychological level of $ 3,000. And such activity is an indication of the power of demand because, as a rule, the increase in volume in such situations, indicates the aggressiveness of the buyers.
From a fundamental point of view, the observed strength of demand justified the policy of quantitative easing, which is used by the Federal Reserve to support the economy in crisis.
More importantly, it is ignoring by the stock index's surge of protest happening in the United States in the last days. That is, the confidence with which the index holds above the psychological mark of $ 3,000 a day by day gives more weight to the idea that the bullish trend will continue and the price of the contract is ready to develop in the framework of the current uptrend channel (indicated by the green lines) and recover to pre-crisis highs in February.

In case of Low volume bounce, expect $8k per BTCToo many traders are locked in buyings around 10k. I would expect the market will want to kick out all of them by moving further down. Low volume bounce up (ND-wave) will confirm this Plan.

ADAUSD, Pullback expectedIs it worth investing in Cardano?
The purple line shows changes in the total capitalization of the cryptocurrency industry. In other words, it is the index of the cryptocurrency market.
Back in 2019. At the beginning of the year, Cardano was strong. The increase from 3 cents to 9 cents showed stronger dynamics of ADA compared to the overall market. However, since the first of May and ending the first of July the market began to change. In those days, (formed a red circle) Cardano lost the role of leader. That range is indicated by red arrows. You can see that in this period there were very high trading volumes. And immediately after that period of the ADA fell under the purple broken line, showing that it has ceased to be the driver for the cryptocurrency industry. This can be interpreted as the area of distribution. That is the period when large investors get rid of the asset, arguing that it is overvalued.
The entire second half of 2019 Cardano was acting weaker than the market, slowly sinking to the levels about 3 the price per coin. Please note that the volume steadily dried up, due to the likely exhausting of the pressure of sellers.
Then came recovery. The coin rose in price on increasing volumes at the beginning of 2020. This is a positive dynamics, showing that levels of about 3-4 cents per coin are the fundamental area of support where weak supply gives way to strong demand.
However, in conditions of extreme volatility caused by the spread of the coronavirus, a coin fell below 3 cents and even reached 2 cents. Look at extremely high volumes (indicated by the first green arrow), this is the maximum volume on the chart and what is very important is a relatively narrow range (the difference between the low and high). This means that a large investor had absorbed the whole stream of sales due to short-term panic. This investor knew exactly what the level of 3 cents per coin is extremely attractive. Moreover, he likely possessed insider information about the upcoming good news. That is why we see a price recovery after the first green arrow, and the second green arrow indicates the release of positive news and the high profit that a large investor received in a short period.
What to do next, what are the prospects for the moment?
Cardano is trading near the resistance level, which is indicated by a thin red line. This resistance lasts for many months. It was tested in February 2020 and most likely that it will act as an obstacle to growth in the coming days, so the bullish momentum that developed from the lows of 2 cents per coin has a high chance of running out. Therefore, the pullback scenario is now more likely, and the opening of long positions on this coin will be more appropriate when receiving a signal that the pullback has ended.

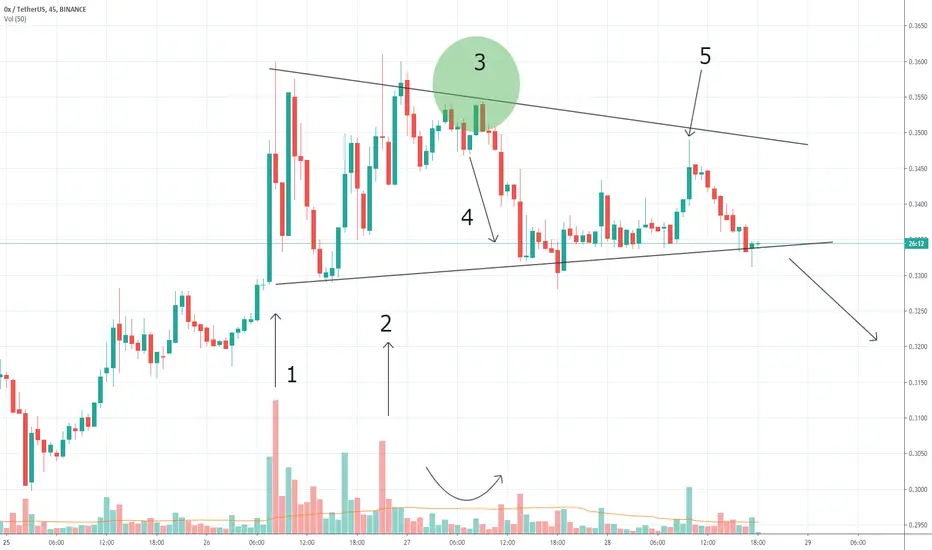
Bearish triangleZrx looks very weak on this 45m chart.
You see 1-2 bars with the maximum volume, I highlighted them with two arrows, they have a maximum above the level of 0.35. However, these extremely high volumes on attempts to rise can mean hidden weakness.
Most likely, hidden professional selling occurred around 0.35 because at point 3 there is trading on very small volumes near the resistance level. This means a weak market and a lack of demand.
Arrow number 4 indicates a surge in volumes amid falling prices - a typical occurrence for selling pressure. Sellers come out of the shadows.
A burst of activity on arrow number 5 indicates a bull trap. This is a fraudulent movement that often occurs on the eve of decline.
Thus, we can most likely say that the chart tells us a bearish story. Several attempts to establish a bullish trend were not successful, therefore, a bearish breakdown of the triangle in this situation looks like the most logical development.
Wells Fargo is turning bullish1] Culmination of decline. "$24 is cheap price" - professionals decided to accumulate panic selling and establish longs
2] Supply has gone
3] Bullish attempt
Expect recovery.
The long-term target $40.

TLRY has positive long-term perspectiveMajor investors prepared for "good news" that will publish soon.

BTCUSD Chart ReadingLet's conduct an ongoing analysis of the demand and supply on the BTCUSD market.
This market is developing in the framework of the uptrend marked with four blue lines ABCD. The current quote is at the heart of ABCD formation. This means that the number of supply and demand to a large extent compensate each other. In other words, the market is generally balanced.
Let us examine the key points.
Point 1. We have an extremely high volume of buying here. This is a very wide candle, in which price reached the level of 10,000 dollars per Bitcoin. However, the extremely high volume with anomalous values of shopping - this is an unhealthy situation, which usually means a hidden weakness. The big players use FOMO mood to take profits on long positions and to prepare for a subsequent pullback. The resistance from line B helped bears to set up the short-term down-trend, which was culminated near the line C.
Point 2. After the Selling Culmination around 9,000 for bitcoin, the market has entered short-term consolidation noted narrowing of the lines (triangle pattern). The efforts of the bulls were held on May 13 to the break of the triangle on rising volume. This is a positive sign.
However, bullish momentum has dried up when the price approached the resistance of line B (point 3). The second attempt to overcome the key psychological level of 10,000 dollars per Bitcoin was also unsuccessful.
After a brief consolidation in mid-May followed by a new (already the third attack of the buyers), with the breakout of the consolidation zone (it is indicated by figure 4). We see the efforts of the buyers, they are marked in figure 5 on the volume indicator. But for the next four candles have any progress and development of upward momentum.
Point 6 indicates the General decrease of volumes. It can be described as indecision of the market caused by the deficit of buyers (weak Demand). Fewer traders believe that the market is ready to overcome the level of $ 10,000. Therefore, we witnessed a shift in the Character of the market.
Figure 7 indicates a bearish candle with a widening of the spread. The volume is increased. As shown by figure 8, this is a Selling pressure, and we have a Wake-up call for the crypto-optimists.
Conclusion
Considering the overall picture, recent changes in the nature of the market is seeing a short-term phenomenon. We have clear signs of strength in the area of 9000 dollars per Bitcoin. Support is getting closer. Therefore, we can confidently say that just formed a bearish momentum will soon enter the power zone of buyers. It will be a good opportunity for the bulls to start the fourth attack at level 10,000. And its results will provide us with important information for analysis and prediction.

ACB is rejecting from $19 level of resistanceIndeed, the market shares of Aurora cannabis in recent days blew very strongly from the point of view of volatility, the ATR indicator has jumped up from zero very fast. The stock has grown in value. But to judge this chart from the point of view of the interaction dynamics of price and volume is difficult because the market is too "noisy" and specific. Nevertheless, we will try to do the analysis.
Technically, the stock is in an uptrend which is marked by the orange lines. While the price is above the 50% Fibonacci at above $12 level, we need to consider this action from the perspective of bulls.
Level $12 per share is also very strong because we have a large bulb on the right side of the chart, in the market profile indicator. Also in favor of the bulls, there is the fact that the price is trading within the current orange channel.
Everything speaks in favor of growth. However, I'm confused about some facts in the area of $ 19.
The first fact - a narrow spread on large volume closing near the middle and the subsequent deep pullback from the overbought area is a clear sign of weakness (EVRT).
Number two, I outlined SLKT - it's tiny exceeding the previous maximum, which has a manipulative character.
Number 3 was a widespread down bar on high volume. I would have interpreted it as a Bar of Supply (SB).
Thus the signals form the sequence 123, which often could be found on top of the markets. With confidence, I can say that the area of 18-19 dollars per share acts as a powerful resistance.
As you can see, the signals are controversial. Given the weak opening of today's session, I would have preferred the game on the bearish side, because it is the most recent message from the chart. As long as the price will trade lower than $ 19 per share, the uptrend is under threat.
AShort

USDCAD unwill to fallWe have here orange lines of the major trend-channel (orange lines). Study the cases, when USDCAD did bounce with orange lines (I used green arrows to outline reversals).
Note:
- Christmas Trap in 2018. Price made the fake breakout but reversed down in January/2019.
- Christmas Trap in 2019. Price made the fake breakdown but reversed up in January/2020.
- The recent indication in volume is bullish - this is No_Supply arrow (diminishing volume amid a decline in price). A lack of traders wants to buy CAD. That is why the current movement has a bullish power.
In the global view, I project a long-time target around 1.37.

