Price Performance of 'Big Oil' this yearIt has been one of the most dramatic years for oil markets ever. From demand destruction caused by the coronavirus to the Russia-Saudi price war to US crude prices turning negative.
What does it all mean for the oil industry and ‘Big Oil’?
## Saudi Aramco and Sinopec are not traditionally part of ‘Big Oil’ but they are huge global players worthy of being listed.
Chevron

Chevron looking like a solid long-term buy. People are scared of oil stocks.
This is the "first sell-off' of a major market cycle.
The opportunity in these oil companies is MASSIVE and the risk is very low.
Buying some of this on my stock account.
Stay profitable!

God Bless The Oil Industry. (CVX)50 year parallel channel shattered. It took 50 years to get there, how many will it take to come down?
Be patient. Give it some time to breathe.

OXY "SHORT"I have been pretty trash with oil trades.. but this time I believe oxy will reach new all-time lows.
There is much uncertainty from investors which makes this a perfect short IMO, I have a 5/8 buy put... didn't short at $17 simply cause I was at a huge loss from some other trade (not enough capital.)
I think we will revisit $12 by today and continue to make lower highs throughout the week. This won't stop Donnie Pump from tweeting but there isn't much more he can do right now. The oil cuts aren't enough to ignore the fact we will run out of storage.
Good Luck!

Bearish CVX Analysis
This look like a nice bearish setup. Price broke structure, then rallied to test the previous low. Price did not make any higher lows, it meet resistance at the 50.0 fib level. A double top was created which is a bearish candlestick formation pattern. The previous daly candle look to have formed a bearish candlestick.

USOIL looks like decision time for WTI, the Daily wedge is about out of time & $19 base has been tested and support seems to be established. A break back to the 200 ema on D1 would be a massive move for the oil sector and return the markets to normal business as usual levels

Big Time Rewards - Longterm BUY and HOLD (Scared?)Not going to say nows the best time to buy - its probably not - but I'm willing to bet my left almond shares will be trading around $20 in a year or two.
Seems like an extremely safe yearish long buy and hold. Fun to let things build slow sometimes anyways.
Position size accordingly, look for dips to load up .
Adios,
Fishy

Chevron downside targetsThanks for viewing,
After record (and very profitable) drops in Crude in the last few days, Chevron will be put under significant profitability pressure. Well, now we have dipped well below that due to:
- as yet unknown, but likely double digit reductions in global demand for crude oil,
- Russia not going along with the OPEC plan, which resulted in,
- Saudi Arabia (for some reason) discounting up to $6 per barrel and markedly INCREASING production,
- The stated aim of all this is to put higher US shale producers underwater - which may already be working.
It looks like there will be major pressure on all high cost oil producers (Saudi Arabia has an all in cost basis around $10 per barrel) for some time. I am not picking on Chevron especially - but considering their situation in light of their (and recently) likely break-even price above $40.
Where to from here? Probably a gap down when the markets open targeting below $72 in the short term, potentially much lower ($30 / share) if the price hangs around present (sub $30 per barrel) levels for any length of time. If Chevron gets that low, they make a lot of sense to pick up.
Any catalysts for a major price increase? Not while Iran is busy fighting their COVID-19 outbreak - they are likely too busy at the moment to continue their work destabilising oil refining and shipping in the middle east with drones and cruise missiles.

CVX: Chevron descending triangleI really don't like descending triangle for NYSE:CVX . I have fundamental analyst giving me a buy/hold signal but i am still cautious. This 139 weeks descending triangle might play out just be very careful and wait for confirmation before entry.

CHEVRON (CVX): Close To Key Structure
chevron is coming closer and closer to a key structure support level.
I would consider a buying opportunity from 103.0 level with a potential bullish reaction to 114 / 121 levels.
with a stop below the X the position will be protected against the volatility and occasional fluctuations!
good luck!

Chevron Corp swing trade ideaChevron Corp -
Breakout to $133 or breakdown to $103?
The price likely has a bullish trait as support awaits at approx $115.
I favour the bullish movement upwards right now as the upwards trending (green dotted) support line awaits price. However, as always, wait for price action to form to provoke your next trade move here.
Enjoy your weekend and have a great trading week ahead.
All comments welcome.


NATGASUSD 15-MINUTE TIMEFRAME SHORTNatural gas price seems to be moving in an uptrend. However, there appears to be a wedge-like formation in play, suggesting a possible small correction. If prices do reject the ceiling of this shape and go lower, i would consider going short. Due to the high risk nature of this type of trade, i would only consider opening a small position.

Chevron, Corporation (CVX)(NYSE) Sell $122.00 >>> Target $125.00NYSE:CVX
Chevron, Corporation
Stock - NYSE (USA)
Profit:Risk = 1:1
---
Buy = $122.00
Take Profit = $125.00
Stop Loss = $118.99
------
Take Profit = +2.46%
Stop Loss = -2.47%


CVX SELL (CHEVRON CORPORATION)Hi there. For short term, price is forming a continuation pattern to the downside. Wait for the price to complete the pattern and watch strong price action for sell.
For longer term, wait for the price to hit the bottom of the bigger pattern and watch strong price action for buy.

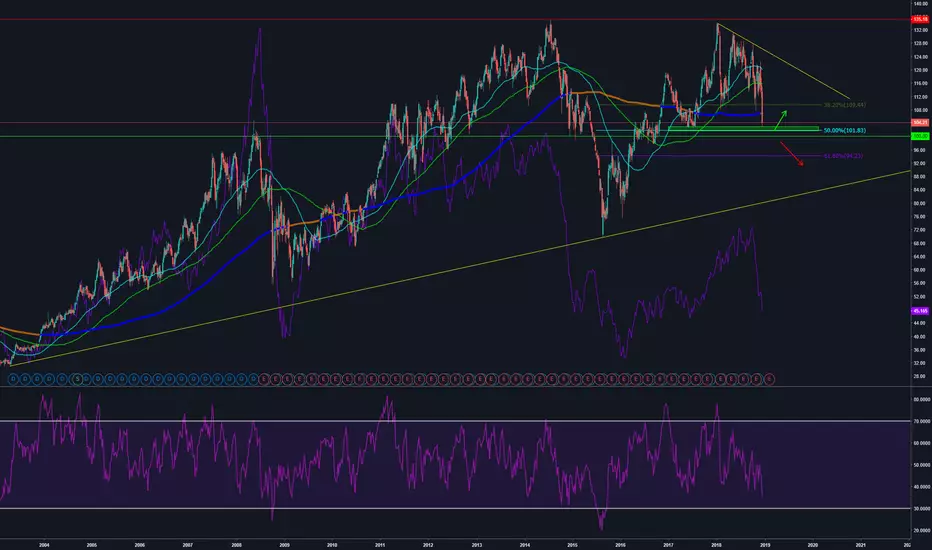
Chevron analysisOil (purple line chart) sell off caused a big loss for oil companies' stocks, waiting for the bottom of oil prices will be a good time to go long on oil companies as well. Chevron being one of the biggest and oldest oil companies has broken through 200 SMA and buy support zone above 50% fib is tested now. 100 level being psychological barrier, it could be a setup for a long if we hear positive news about oil at the start of 2019, or short through.
#CVX - Descending triangle breakout alertBreakout alert descending triangle on CVX.
Chevron Corp. engages in the provision of administrative, financial management, and technology support for energy and chemical operations. It operates through the Upstream and Downstream segments. The stock is listed on the New York Stock Exchange.
CVX price formed an almost one year-long reversal pattern as descending triangle, with the lower boundary as strong support at 108.90 levels. The horizontal boundary has been tested several times during the chart pattern formation until its breakout.
In addition, we must bear in mind 3 relevant factors on the technical structure of the stock:
1.- Double top at 133.85 levels, without a higher high.
2.- Breakdown the trendline since 2015
3.- Breakdown the trendline since 1974
So that:
- A daily close below 105.63, confirms the breakout of the chart pattern.
- The possible price target of the reversal chart pattern is at 87.33 levels.
Please don't forget to give a like if you appreciate it :)
Note: Entry and exit prices are provided only as reference according to the principles of the classical charting. Each trader must take his own decisions depending on their own strategy and tactics. These levels do not indicate the specific entry and exit price, these levels only suggest a possible technical structure change.

Selling Chevron sharesAt the daily chart of CVX shares, the price has started a new downtrend, as the instrument has fixed below Alligator indicator with AO crossing below the zero line. Also, a sell signal was formed in a form of the fractal, breakdown of its level would be an optimal level to open short.

Chevron (CVX) Price Prediction August 10th 2018This is a price prediction for Chevron I made using Gann angles and Ichimoku graphing. I am predicitng it will reach the green area and rebound upwards.

CHEVRON shares Buy IdeaCHEVRON shares Buy Idea @Weekly Demand Zone (108.54 - 105.34)
Buy Limit: 108.77
Stop Loss: 103.87
Take Profit: 119.45


Chevron, CVX, Bull Put, Credit SpreadI am not licensed or certified by any individual or institution to give financial advice. I am not a professional Stock trader.
Chevron (CVX) gapped down today, big time; but it couldn't break the 100 Day Exponential Moving Average (EMA). If you look back to October 27, 2017 (see the purple arrow I inserted on the lower left of the chart to mark the date) Chevron did the exact same thing. It proceeded to go back up. I think it will repeat itself in the coming days. It used the 100 Day to bounce and will go back up. I typed up the strategy I used for this play and you should be able to see it on the chart. The 200 Day EMA is sitting just above $118.40ish giving this play more than $4.00 of cushion. Additionally, next week is a short trading week in the United States due to markets being closed on Monday in observation of Memorial Day. That means this Stock has four days to not go down more than four dollars, and the Credit from opening the play is kept. Yes, you could tighten the spread; but having the 200 Day EMA adds a little protection, and I'm still learning how to do Spreads. :)
