Long NIO into earningsChinese equities have been in an uptrend lately. Aside from long term investments like NYSE:BABA and NASDAQ:JD it might be nice to capture trading profits on smaller, more speculative names.
I've started such a position on NYSE:NIO via call options, dated to expire just after earnings. My theory is it can climb into the earnings announcement, especially with the momentum Chinese stocks as a tailwind.
NIO's technical setup
a rounding bottom
bullish momentum
time to appreciate on pre-earnings optimism
attractive risk/reward profile
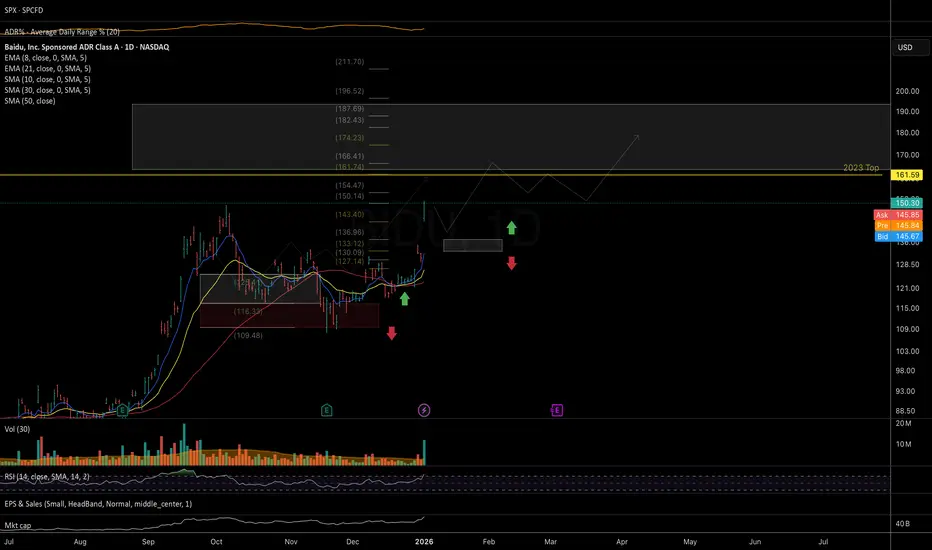
Chinastocks

JD: Final Wave 2 consolidation (patience before the breakout)Thesis
NASDAQ:JD is still compressing in the final stages of Wave 2, and the longer this base builds, the stronger the breakout typically becomes.
Context
- Weekly timeframe
- Multi-year downtrend transitioned into a base
- Compression phase continues while peers already broke out (BABA, BIDU)
- 2026 remains the window for JD to catch up
What I see
- Standard late-stage consolidation behavior for a Wave 2 structure
- Volatility keeps compressing inside the wedge
- Support is still holding, while resistance is still capping price
- Nothing “broken” here — just time passing and pressure building
What matters now
- We need patience until the weekly breakout and hold above wedge resistance
- Until that happens, this is still a compression structure, not the breakout itself
- The longer this range holds, the better the breakout odds and follow-through
Buy / Accumulation zone
- Wedge floor / support zone remains the area of interest
- Risk stays clean as long as support holds
Targets
- Wave 3 target remains: 1.618 Fib at ~$71
- Higher extensions come later once Wave 3 plays out and Wave 4 support is confirmed
Risk / Invalidation
-Loss of the wedge floor support would delay the bullish catch-up thesis

BABA – Breakout Follow-Through | Wave 5 In ProgressContext
- Weekly and daily timeframes
- Multi-year base already completed
- Prior impulsive advance followed by a controlled Wave 4 retracement
- Breakout confirmed last week
What I see
- Wave 4 pullback resolved cleanly
- Breakout last week confirmed the end of the corrective phase
- Price has advanced +20% from the breakout area in the last two weeks
- Momentum accelerated after price rejected a pullback toward the breakout zone
- Yesterday’s near +4% close and strong pre-market action signal continued demand
- Structure is now consistent with an active Wave 5 advance
What matters now
- The 50-day MA and former breakout area near $156 should now act as support
- Holding above this level keeps the impulsive structure intact
- Next resistance sits at the prior Wave 3 high around $192
- A clean break above $192 confirms Wave 4 completion beyond doubt
Buy / Accumulation zone
- Initial breakout already played
- Ideal adds come only on controlled pullbacks toward support
- Risk remains clearly defined against the recent higher low
Targets
- Wave 5 target remains the $230 area
- This level aligns with the next major upside reference within the broader reversal
Portfolio note
- NYSE:BABA currently represents ~3% of my portfolio
- Comfortable holding this position into 2026
- Acts as a solid diversification hedge versus the US market

BIDU – Wave 3 Progress UpdateThesis
NASDAQ:BIDU continues to advance within a developing Wave 3 structure after completing a multi-year corrective phase and confirming a major breakout.
Context
- Weekly timeframe
- Prolonged correction from 2021 into mid-2025
- Transition completed: downtrend → base → breakout
What I see
- BIDU stood out this week despite a weak and volatile broader market
- Higher high printed at the start of the week, followed by another +5% push today
- Breakout remains clean, with price holding above former channel resistance
- Acceptance above long-term trend support confirms impulsive behavior
- Structure remains consistent with an advancing Wave 3
What matters now
- Holding above the $155 breakout area is key
- A successful hold confirms Intermediate Wave 4 is complete
- That opens the path toward the Cycle Wave 3 objective
Buy / Accumulation zone
- Core accumulation completed earlier between $70–$90 (H1 2025)
- Additional buys executed at ~$118 ahead of the breakout
- Further adds taken post-breakout after support confirmed outside the channel
- Next opportunity comes only on a confirmed higher-degree pullback
Targets
- Cycle Wave 3 target: 1.618 Fib extension at $225 area
- Higher extensions remain possible if momentum persists
Execution note
- Patience through a 9-month base was rewarded with a +100% move
- Recent adds followed rules and structure — discipline is paying off

NIO mid-term TANIO is setting up bullish uptrend on daily, it's in the process, there's no confirmation as of yet but there's a positive divergence starting to appear which could be the first sign of bearish trend reversal. Short-term is in bullish formation now and the price could go higher from here.

BABA: holding the mid-term support NYSE:BABA price is still holding the mid-term support zone outlined in the October update (see "previous" section bellow) and continues to act constructively. The structure suggests a potential start of a new uptrend toward the next target resistance zone at 205–230.
Chart:
As long as price holds above 155 in the short term and above the January lows, I am expecting the right-hand side of a new base (from the October highs) to form, with price following through toward 200+.
Previously:
• On macro support (Jun 24):
www.tradingview.com
• On potential upside reversal (Jul 15):
www.tradingview.com
• On support and bullish corrective structure (Aug 19):
www.tradingview.com
• On bullish structure (Aug 29):
www.tradingview.com
• On mid-term support (Oct 13):
www.tradingview.com

FUTU: watching for more downsideNASDAQ:FUTU as long as price is holding below the Jan lower highs at 190, I am watching for further downside into 140–135 and potentially 130–120 as part of a mid-term top formation.
Chart (daily):
From a larger-degree perspective, the upside trend from the 2022 lows (see long idea from Dec 2023: ) may have topped, with price now unfolding its first wave of decline. This remains my primary scenario as long as price continues to close below the 190 level.
Chart (larger-degree view):
Alternatively, if price is able to hold — i.e., does not break down below the 153 level — and subsequently breaks out and holds above 190 in the coming weeks, the odds would shift toward a more bullish scenario with upside extensions into the 235–265 zone.
Chart:

FUTU: strong potential for 2024FUTU reached the upper zone of mid-term 52-45 support range and is trying to find a footing.
I like the gap-up with substantial volume today. Re-claiming the 50d moving average would be a constructive next step in shifting the odds of important bottom in place.
Otherwise, if 50.28 level will not hold, next support levels are: 49-45.
Suggested price structure is in-tact until price holds above 40.90 level.
Fundamentally solid with strong sales and earnings growth 4qrts in a row, high EPS growth estimates for 2023 and decent 2024, could be a perspective growth candidate to outperform the markets in 2024 (in favourable environment).

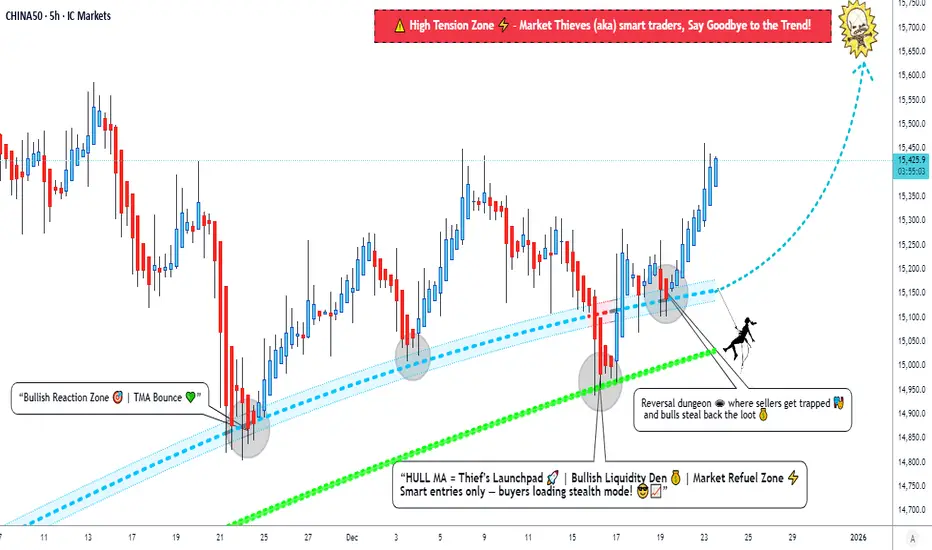
China50 Pullback Buy Setup — Tactical Layer Entries & Trade Map📌 Asset: "CHINA50 / A50" Index Market — Swing Trade Opportunity Guide
📈 Bias: Bullish outlook confirmed by a clean moving average pullback structure.
📊 Trade Plan
The market is retracing into dynamic support, respecting key moving averages — a classic bullish continuation setup.
To execute this with precision, the Thief Layering Strategy is used (multiple limit-order scaling during pullbacks).
🟢 Entry Plan — Layered Limit Orders
Using the thief-style multi-layer entry structure:
Buy Limit 1: 15000.0
Buy Limit 2: 14900.0
Buy Limit 3: 14800.0
👉 Traders can add extra layers depending on their capital, risk, and volatility tolerance.
Layering helps average into pullbacks instead of chasing breakouts.
🛑 Stop Loss
Thief SL: 14700.0
Dear Ladies & Gentlemen (Thief OG’s) — adjust your Stop Loss based on your own risk and your own system.
📌 This is not a fixed SL suggestion; trade responsibly.
🎯 Target
The price is approaching a strong resistance zone with signs of potential overbought pressure and possible bull traps.
Primary Take-Profit: 15800.0
Dear Ladies & Gentlemen (Thief OG’s) — secure profits based on your own rules.
📌 My TP is only a reference; manage exits according to your risk style.
📡 Related Markets to Watch (Correlation Guide)
1️⃣ HSI:HSI — Hang Seng Index
Strong correlation with China equities
When HSI shows risk-on flow, CHINA50 often follows
Watch for synchronized breakouts or divergence signals
2️⃣ CAPITALCOM:CN50 — China A50 Futures
Direct CME-tracked instrument
Useful for liquidity confirmation
CN50 volume spikes often lead CHINA50 movements
3️⃣ LSE:SSE — Shanghai Composite
Macro sentiment indicator
If SSE pushes higher while A50 pulls back, the pullback likely becomes a buy opportunity
4️⃣ SP:SPX / CME_MINI:ES1! — S&P 500
Not strongly correlated, but global risk sentiment matters
When SPX is risk-on, Asian indices get spillover momentum
Especially important in weak macro weeks
5️⃣ HSI:HSCEI — China Enterprises Index
Tracks large China corporates
Good for spotting whether institutional flows are entering Chinese markets

PONY: in the important support zonePrice has reached an important support area that should serve as a zone for establishing a larger-degree higher low: 12.5–10.6–9.65.
For the odds of a bottom being in to meaningfully increase, I would like to see the following developments:
• price reclaiming short-term EMAs and starting to hold above them
• a bullish EMA cross on the daily
• sequence for local higher lows
• and later breakout above the 16 resistance level
As long as price is trading below 16, there remains a possibility of a deeper move into the support zone
Chart:

BIDU – Breakout Confirmed | Watching Wave 3Thesis
BIDU has completed a multi-year corrective phase and is now advancing within a developing Wave 3 structure following a confirmed breakout.
Context
- Weekly timeframe
- Prolonged correction since 2021
- Structural transition from downtrend → base → breakout
What I see
- Clean breakout confirmed at the end of December
- Prior support found on the 50-day moving average before expansion
- Successful acceptance above former resistance
- Price holding above long-term trend support
- Structure now showing impulsive characteristics
What matters now
- Wave 3 remains intact while price holds above post-breakout support
- After Wave 3 completes, attention shifts to a controlled Wave 4 pullback
- Confirmed support during Wave 4 would define the next add opportunity
Buy / Accumulation zone
- Initial breakout already played
- Next accumulation opportunity expected on confirmed Wave 4 support
Targets
- Primary upside reference at the 1.618 Fibonacci extension ($225 area)
- Higher extensions remain possible if momentum persists
Risk / Invalidation
- Loss of key breakout support would delay the bullish structure

BABA – Weekly / Daily Structure | Wave (4) Update
Thesis
NYSE:BABA remains in a broader bullish reversal, with the current pullback continuing to resolve as an intermediate corrective phase.
Context
- Weekly and daily timeframes
- Multi-year base already completed
- Prior impulsive advance followed by a controlled retracement
What I see
- Pullback continues to respect the prior breakout structure
- Price is consolidating inside a descending corrective channel
- Rising longer-term moving-average support remains intact
- Structure remains consistent with an intermediate Wave (4) correction
What matters now
- The 50-day moving average is aligned with the 0.382 Fibonacci retracement near the $159 area
- A break and hold above this confluence would signal completion of Wave (4)
- Failure to reclaim this level likely extends consolidation
Buy / Accumulation zone
- Current consolidation range within the Wave (4) retracement zone
- Risk remains defined against the recent higher low
Targets
- A confirmed flip of the $159 confluence opens the path toward the $230 area
- That level aligns with the next intermediate upside reference
Risk / Invalidation
- Loss of rising support would weaken the bullish reversal structure

BIDU: more bullish potential in coming weeks NASDAQ:BIDU continues to trade in line with the larger-degree trend support outlined in the September update.
On a short-term basis, as long as price holds above the 133 level, I’m looking for further upside toward the 160–175 zone, with a possible extension to the 196 macro resistance in the coming weeks.
Chart:
Weekly view:
Previously:
On the mid-term support (Sep 27):
www.tradingview.com
BIDUBreakthrough the triangle and form a bullish flag, hold at 115 support, if breakthrough (125 to 140) that bullish to 160 then could retest 140 for higher area.

China 50 Index Maintains Uptrend Above Dynamic Support🚀 CHINA A50 INDEX SWING/DAY TRADE OPPORTUNITY 🚀
═══════════════════════════════════════════════════════
📊 ASSET: FTSE China A50 Index (XIN9) | CNY
💹 CURRENT PRICE: 15,366.93 | Last Updated: Dec 23, 2025
📈 52-WEEK RANGE: 12,182.84 - 15,759.61
───────────────────────────────────────────────────
🎯 BULLISH TRADING THESIS
✅ SETUP CONFIRMATION:
GREEN Hull Moving Average: Pullback + Retest Pattern Identified
BLUE Triangular Moving Average: Strong Support Confirmation
Market Structure: Higher Lows + Higher Highs (Uptrend Intact)
Volume Profile: Buying Pressure on Dips
📍 TRADE STRUCTURE: Swing Trade (1-7 Days) / Day Trade (Intraday)
───────────────────────────────────────────────────
🔥 ENTRY STRATEGY - "THIEF LAYERING METHOD"
Multiple Limit Order Entries (Reduce Average Cost):
Layer 1: Buy @ 15,200 (First Position)
Layer 2: Buy @ 15,250 (Add Position)
Layer 3: Buy @ 15,300 (Increase Exposure)
Layer 4: Buy @ 15,350 (Final Layer)
💡 Strategy Notes: You can increase/decrease layers based on your risk tolerance and account size. Each layer reduces emotional decision-making and optimizes entry cost basis.
⚠️ IMPORTANT: These are suggested entry points using established support zones. Adjust entries based on YOUR chart analysis and risk management rules.
───────────────────────────────────────────────────
🛑 STOP LOSS MANAGEMENT
THIEF STRATEGY SL: 15,100
Protects against breakdown of critical support zone
Allows room for natural market noise & pullbacks
Defines your maximum loss per trade
⚠️ CRITICAL DISCLAIMER:
Dear Ladies & Gentlemen (Thief OG's), your stop loss is YOUR choice. I recommend managing SL based on:
Your account size
Your risk/reward ratio (1:2 minimum)
Your personal risk tolerance
Market volatility at time of trade
Risk = Your Decision. Trade Responsibly. 🎲
───────────────────────────────────────────────────
🎊 PROFIT TARGET
PRIMARY RESISTANCE/TP ZONE: 15,650
Why 15,650?
🔴 ELECTRIC SHOCK RESISTANCE - Multi-Month Strong Resistance
⚡ OVERBOUGHT CONDITION - RSI/Stochastic Extended Levels
⚠️ BULL TRAP RISK - Correction Likely at This Level
🚪 ESCAPE POINT - Prudent Exit to Secure Profits
Secondary Resistance: 15,750-15,800 (Extended Run if Breakout Confirmed)
⚠️ CRITICAL DISCLAIMER:
Dear Ladies & Gentlemen (Thief OG's), your take-profit level is YOUR choice. I recommend:
Take partial profits at 15,650 (secure 50-70%)
Trail stop on remaining position
Let winners run if breakout confirmed
Never get greedy at resistance
Profits = Your Decision. Manage Exits Professionally. 💰
───────────────────────────────────────────────────
📡 CORRELATED PAIRS TO MONITOR
1️⃣ HANG SENG INDEX (HSI) - HSI:HSI
Correlation: Strong (0.94+)
Hong Kong's main benchmark
Includes major Chinese enterprises
A50 & HSI often move in synchronized patterns
Watch For: If HSI breaks resistance while A50 confirms—CONFLUENCE ✅
2️⃣ CSI 300 INDEX - $CSI300
Correlation: Very Strong (0.94+)
Tracks 300 largest A-shares (Shanghai + Shenzhen)
Covers ~60% of market capitalization
Direct domestic sentiment indicator
Watch For: CSI300 momentum confirms A50 uptrend strength
Current Level: 4,611.62 | 12-Month: +14.67%
3️⃣ SHANGHAI COMPOSITE (SSE) - LSE:SSE
Correlation: Strong
Shanghai Stock Exchange aggregate
Macro sentiment barometer
Strategy: If SSE rallies while A50 corrects = BUY DIP signal
4️⃣ S&P 500 INDEX ( SP:SPX ) - Risk Sentiment Proxy
Correlation: Moderate (0.45-0.55)
Global risk appetite indicator
If SPX crashes → Flight to safety/A50 weakness likely
If SPX rallies → Risk-on flows boost A50
Watch: Use SPX as macro context, not direct trade signal
5️⃣ CHINESE YUAN (USDCNY) - FX_IDC:USDCNY
Correlation: Inverse (Negative)
Stronger Yuan = A50 typically gains
Weaker Yuan = Warning signal for weakness
Trade Implication: Monitor USDCNY breaks for A50 confirmation
🔗 CONFLUENCE STRATEGY:
When HSI + CSI300 + A50 all confirm support/resistance = Highest Probability Setup ⭐⭐⭐
───────────────────────────────────────────────────
📊 FUNDAMENTAL & ECONOMIC FACTORS
MACRO BACKDROP (December 2025)
🇨🇳 GDP Growth: +5.2% YoY (Q1-Q3 2025)
On track to meet 5% full-year target
Q3 Growth: +4.8% YoY | +1.1% QoQ
Government support measures active
Risk: External headwinds intensifying
📈 Inflation Dynamics:
CPI (Nov 2025): +0.7% YoY (Up from 0.2% in Oct)
Highest level since February 2024
Food prices: Recovered (+0.2% vs -2.9% Oct)
Core CPI: +1.2% (20-month high)
Impact: Rising inflation may support equities against cash
🏭 Manufacturing PMI (Nov 2025): 49.2
Status: 8th consecutive month in contraction (<50 = contraction)
New Orders: Weak (-48.8)
Foreign Sales: Depressed (-47.6) — U.S. tariff pressure
Concern: Manufacturing weakness pressures corporate earnings
💼 Industrial Production (Jan-Sep 2025): +6.2% YoY
Equipment Manufacturing: +9.7%
High-Tech Manufacturing: +9.6%
Positive for tech-heavy A50 components
Private Enterprises outperforming SOEs
🛍️ Retail Sales (Jan-Sep 2025): +4.5% YoY
Steady recovery from H1
Consumer caution persists
Government trade-in stimulus helping
Risk: Domestic demand still sluggish
🌍 Trade Dynamics:
Q3 Exports: +8.4% YoY
Q3 Imports: +7.5% YoY
Risk: U.S. Tariff Threat (100% tariffs on Chinese goods threatened)
September U.S. exports: -27% YoY
Trade war uncertainty creating volatility
🏛️ Government Policy Support:
✅ Fiscal stimulus active (expanded budget deficit)
✅ Monetary accommodation (Low interest rates + ample liquidity)
✅ New quality productive forces (AI, robotics, green tech)
⚠️ Risk: Real estate sector downturn continues to drag confidence
───────────────────────────────────────────────────
⚡ UPCOMING ECONOMIC EVENTS (Watch These!)
📅 January 2026:
Full-Year 2025 GDP Data Release (Major Market Mover)
New government policy announcements for 15th Five-Year Plan
Spring Festival economic expectations
📅 Risk Factors to Monitor:
U.S. Trade Policy (Tariff announcements)
Fed Rate Decisions (Impact on USD/CNY)
China Property Market Data (Housing Confidence)
Tech Sector Earnings & Policy Changes
───────────────────────────────────────────────────
✅ PRE-TRADE CHECKLIST
Before entering this trade, confirm:
✔️ Hull MA in green (bullish)
✔️ Blue Triangle MA providing support
✔️ Price above key support (15,100)
✔️ Volume increasing on ups
✔️ No major news releases next 4 hours
✔️ HSI/CSI300 in agreement (Confluence)
✔️ Your position size = 1-2% account risk
✔️ Entries planned in advance (No emotion)
───────────────────────────────────────────────────
🎓 RISK MANAGEMENT REMINDERS
The Thief Golden Rules:
Capital Preservation First - Never risk more than 2% per trade
Emotion = Enemy - Use limit orders, avoid panic trading
This Plan is NOT Financial Advice - Make your own decisions
Trade YOUR Plan, Not Mine - Adapt to your strategy
Losses are Normal - Professional traders manage them, don't avoid them
Partial Profits - Don't be greedy at resistance
No FOMO - Wait for your setup, skip bad trades
Journal Everything - Learn from every trade
DISCLAIMER:
This trading idea is for educational & informational purposes only. Not financial/investment advice. Past performance ≠ future results. Trading involves high risk of loss. You may lose your entire investment. Only trade with capital you can afford to lose. Consult a licensed financial advisor before trading.
───────────────────────────────────────────────────
🔔 FINAL NOTES
Why This Setup Works:
Bullish confluence (Moving Averages + Support)
Attractive Risk:Reward Ratio
Multiple entry layers reduce emotional decision-making
Clear stop loss and targets pre-defined
Supported by improving macro backdrop (GDP growth, tech momentum)
Why This Setup Can Fail:
U.S. Tariff escalation (External shock risk)
Manufacturing weakness deepens (PMI sub-50)
Wider China property downturn spreads to equities
Trade war intensification
Corporate earnings misses
Your Edge: Manage risk, scale into winners, protect capital, and repeat.
Good luck, Thief OG's! May your profits exceed your losses! 🚀💰
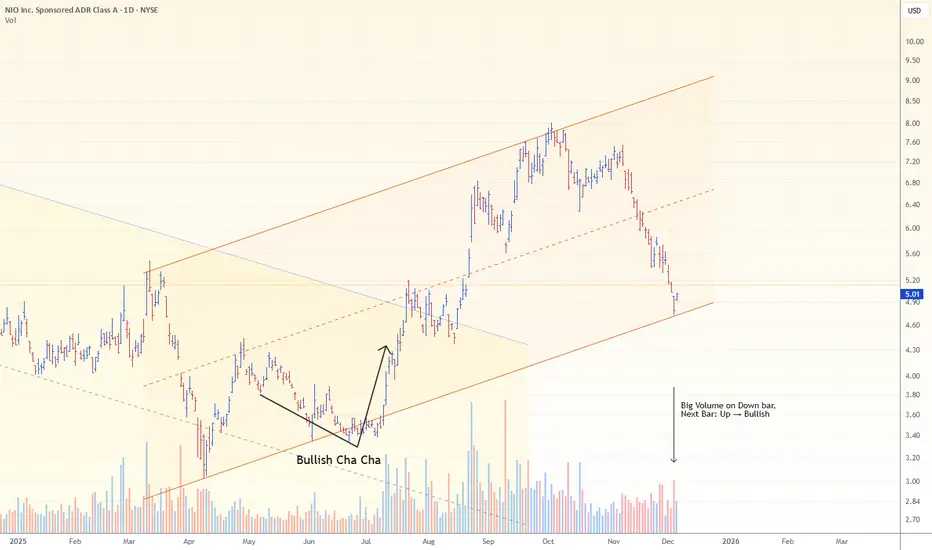
NIO: Price can find supportNIO broke below $5, extending a ~30% slide over the past month.
Pressure came after earnings showed a slight revenue miss and cautious delivery guidance — enough for bears to push the stock to new lows.
But the chart isn’t all doom:
→ price is testing the lower boundary of the 2025 ascending channel
→ yesterday opened with a bullish gap, signaling buyers may be stepping in around the key $5 level
If bulls manage to defend this zone, the trend could stabilize — with further direction depending on momentum for ONVO & Firefly heading into 2026.
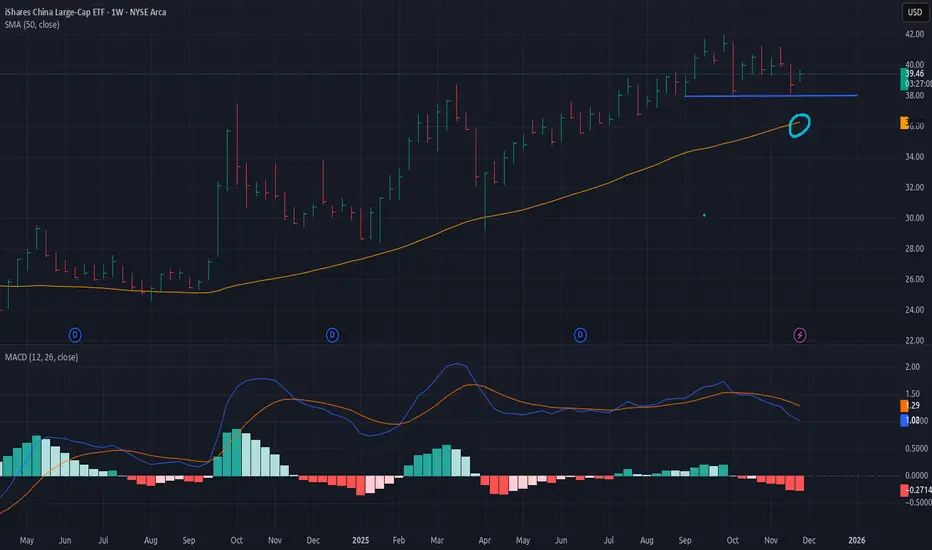
FXI long-term TAChina's large-cap has been in a healthy weekly uptrend since spring of 2024 and it's still holding up the uptrend, but the mid-term is currently in heavy distribution, we need more time for it to balance and bottom out before the uptrend continues. Watch for SMA50 to hold the support during the test.
VIPS | This Chinese Retailer Will Rise High | LONGVipshop Holdings Ltd. is a holding company, which engages in the provision of online product sales and distributions services. It operates through the following segments: Vip.com, Shan Shan Outlets, and Others. The Others segment includes internet finance, offline shop, and city outlets. The company was founded by Ya Shen and Xiao Bo Hong on August 22, 2008 and is headquartered in Guangzhou, China.

CHINA A50 Bullish inside Channel Up aiming at 16650.China A50 index (CN50) has been trading within a 7-month Channel Up and is currently holding the 1D MA50 (blue trend-line), while being on the 3rd Bullish Leg of this pattern.
The previous two both rose by around +16.50%, so given the similarities, we remain bullish on the index, targeting 16650.
---
** Please LIKE 👍, FOLLOW ✅, SHARE 🙌 and COMMENT ✍ if you enjoy this idea! Also share your ideas and charts in the comments section below! This is best way to keep it relevant, support us, keep the content here free and allow the idea to reach as many people as possible. **
---
💸💸💸💸💸💸
👇 👇 👇 👇 👇 👇

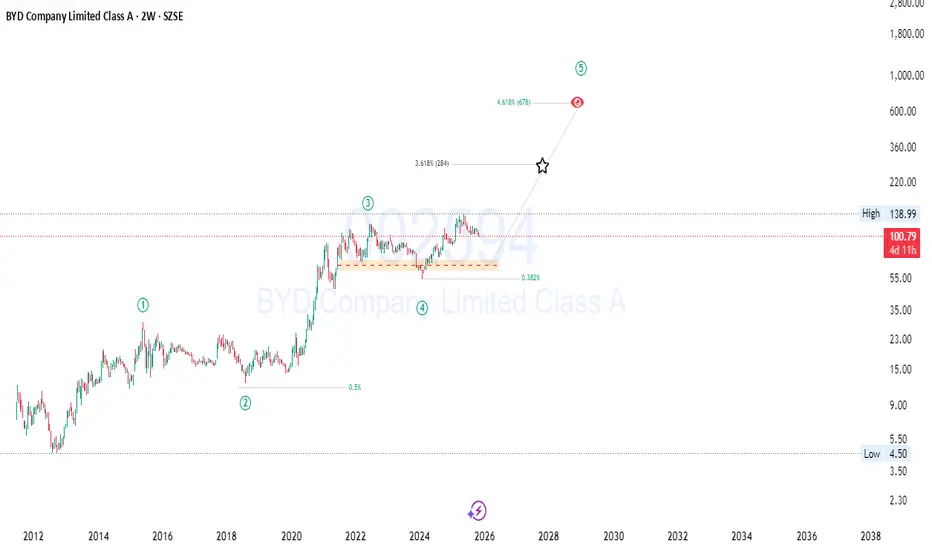
BYD : Smart Money Loading Before a Massive Wave 5 Breakout🚀 BYD Company Limited Class A (SZSE: 002594) — Wave 5 Expansion Setup
Big structure, clean levels, and solid fundamentals… Wave 5 might surprise a lot of people 👇
BYD has been quietly building strength, and the chart now suggests that the next major bullish wave could be setting up. After a long consolidation phase (Wave 4), smart money appears to be accumulating again — a classic sign of preparation for the next impulsive move.
A clean breakout above 138.99 would confirm Wave 5 , potentially targeting the 284–676 CNY zone based on Fibonacci extensions .
With solid fundamentals, supportive market structure, and a strong Elliott Wave setup, BYD could be entering a new long-term expansion phase. ⚡
Follow for updates on Wave 5 development and smart money reactions in the breakout zone! 📊
#BYD #002594 #ElliottWave #SmartMoneyConcepts #Fibonacci #WaveAnalysis #MarketStructure #PriceAction #EVstocks #GrowthStocks #ChinaMarket #LongTermInvesting #SwingTrade #TechnicalAnalysis #StockMarket
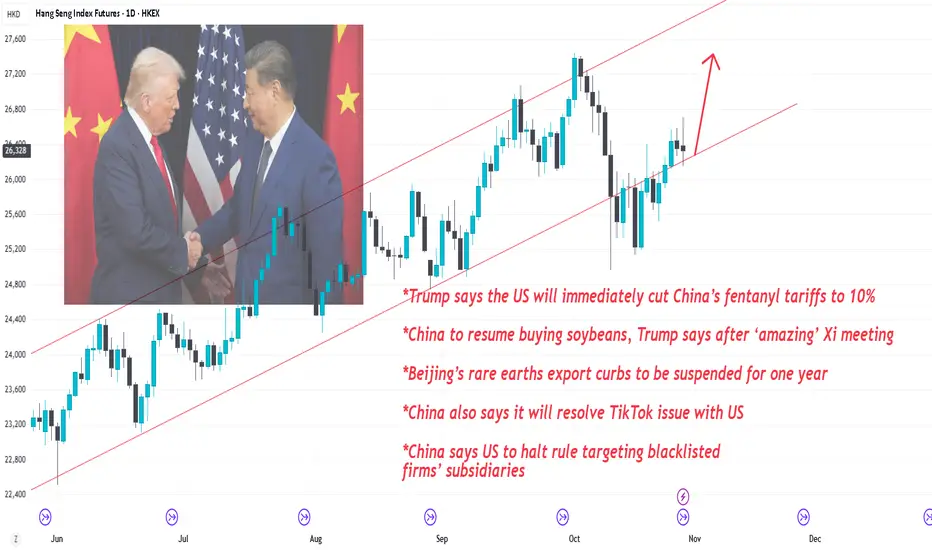
China Rally Loading? – Markets React to Trump–Xi Trade TruceAfter months of pressure, Chinese equities finally got what they needed: a visible political thaw. The Trump–Xi meeting in Busan marked the first broad trade reset in over two years — with both sides agreeing to suspend or reduce tariffs, reopen commodity flows, and relax export controls on rare earths and semiconductors.
The headline changes are not symbolic. China will halt rare-earth export curbs for one year, the U.S. cuts fentanyl-related tariffs to 10%, and both countries resume agricultural and energy trade — including soybean and oil deals. Beijing also promised to work with Washington on resolving the TikTok issue, while the U.S. temporarily suspends its “50% rule” that targeted Chinese subsidiaries of blacklisted firms.
This combination sends a clear signal: geopolitical pressure is easing, at least for now. The Hang Seng Index has already broken back above the mid-channel trend line, and momentum is building toward the upper resistance zone around 27 000. If the truce holds and follow-through buying continues, a retest of 28 000–29 000 by year-end looks possible.
From a valuation standpoint, Chinese equities remain among the most discounted major markets globally. Industrial, tech-hardware and materials companies trade at forward P/E ratios between 7–10, compared with 20+ for U.S. peers. If rare-earth exports resume and TikTok’s uncertainty is lifted, capital inflows into mainland-linked ETFs could accelerate.
The opportunity lies in the asymmetry: sentiment is still fragile, yet fundamentals are improving. A stable policy backdrop plus renewed U.S. demand for energy and agri-products could set up Chinese indices for an extended relief rally — potentially the strongest since early 2023.
Key levels to watch:
• Hang Seng Index support – 26 000
• Resistance zone – 27 500–28 000
• Break above 28 000 → trend confirmation and rotation toward Chinese cyclicals
Trade logic:
Short-term traders can target a breakout continuation within the rising channel, while longer-term investors may look at selective exposure to resource, industrial and tech-infrastructure names poised to benefit from normalized U.S.–China flows.
If this détente lasts longer than a “subscription diplomacy” cycle, China might be setting up not for a dead-cat bounce — but for the next real rotation story.
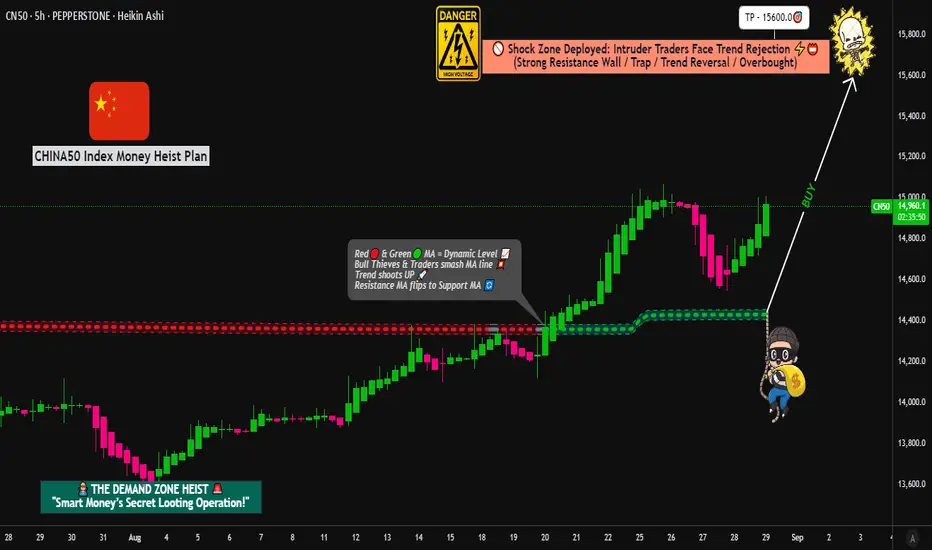
CHINA50 Bull Run: Time to Steal Some Pips?🔐 OPERATION BULL DRAGON: CHINA50 HEIST 🔐
🔥 YOUR INVITATION TO THE ULTIMATE MONEY HEIST 🔥
🌏 ASSET: CHINA50 INDEX (A50)
📅 TRADE TYPE: SWING + DAY TRADE
✅ BIAS: BULLISH — TIME TO STEAL SMART! 💰✨
📋 MISSION BRIAMER (PLAN):
We’re entering LONG 🚀 using a LAYERED LIMIT ORDER strategy — because real thieves don’t FOMO in!
🎯 ENTRY ZONES (MULTI-LEVEL LAYERS):
➖ LAYER 1: 14900.0 🟢
➖ LAYER 2: 14800.0 📍
➖ LAYER 3: 14600.0 🔁
🧠 Feel free to ADD MORE LAYERS based on your risk appetite!
⛔ STOP LOSS (DIP EXIT):
🔻 THIEF SL: 14200.0
⚠️ Adjust based on your strategy & risk tolerance! Protect your capital!
🎯 TAKE PROFIT (ESCAPE WITH THE BAG):
🚀 TP: 15600.0
⚡ Resistance & Overbought zone around 15700.0 — Don’t get caught! Exit like a ghost! 👻💰
👁️ SCALPER NOTES:
Only take LONG scalps! Use TRAILING SL to lock in profits! 🧨
📊 WHY THIS HEIST?
Strong bullish structure + fundamental tailwinds! 🌊🐂
Always confirm with your own analysis! 📈
🔔 ALERT — NEWS RISK:
Avoid entering during high-impact news! Volatility = Police traps! 🚨🚓
💎 GENERAL DISCLAIMER:
This is NOT financial advice. Do your own research. Trade at your own risk.
We are not your financial advisor. We’re just fellow thieves sharing a plan. 😉
✨ SUPPORT THE SQUAD:
👉 If you like this plan, SMASH that 👍 BOOST button!
👉 It helps us bring more high-quality heists to you!
👉 Follow for daily trading ideas & market insights!
💬 Let’s conquer the markets together — one heist at a time! 🎯🤑
#CHINA50 #A50 #Trading #SwingTrade #DayTrade #Investing #Crypto #Stocks #Forex #MoneyHeist #TradingStrategy #Profit #RiskManagement #TradingCommunity #FinancialFreedom #TraderLife #Bullish #MarketAlert #TechnicalAnalysis #LimitOrders #LayeredEntry #ThiefTrading
JD 1D: Bulls taking the lead?On the daily chart, JD.com broke out of a falling wedge, moving above both MA50 and MA200. That’s a strong technical signal hinting at a potential mid-term trend reversal.
Upside targets are mapped at $39.8 and $46, with Fibonacci levels suggesting a possible extension toward $52 if momentum holds. Support remains around $33–35, and as long as the price stays above it, buyers are in control.
From a fundamental perspective, JD continues to reshape its business, expand online services, and benefit from China’s economic recovery. Competition with Pinduoduo and Alibaba is tough, but technically bulls seem to have the upper hand.
Tactical outlook: watch the MA200 - staying above it keeps the growth scenario intact.
