CUP & HANDLE BREAKOUT - Retest supportHey guys, there was a breakout of the Cup & Handle at CHR. We are testing the support right now. A possible good entry for a trade.
No financial advice. Just my idea.
CHRUSD


CHR - Buying timing and good R/R ratioBINANCE:CHRUSDT
4H trend chart
-
CHR has gotten rid of the downtrend line.
Also, it has met the entry condition of Vegas tunnel strategy(blue arrow)
We can buy it with great reward/risk ratio and trading strategy as below.
-
Profit Targets:
a) 0.8929----Fib(1)
b) 0.9923~1.0324--------Fib(1.272~1.382)
c) 1.0756----Fib(1.5)
d) 1.2582----Fib(2)
Stop losses:
a) 0.6868-----Red horizontal ray
-
If you like this analysis, smash the "like button" and leave a comment below to share your thoughts
or let me know what crypto you want to see!
Trading is a reflection of yourself. Learn more daily and be ready for every opportunity.
Have a nice trading!

Chromia CHRUSDT - A good rally ahead on a simple analysisHello Traders,
we talked about BINANCE:CHRUSDT some time ago and made huge profits.
I think it's a good moment to observe how buyers are moving now.
Need a close above 0.7 and a confirmation.
First target 1 usd.

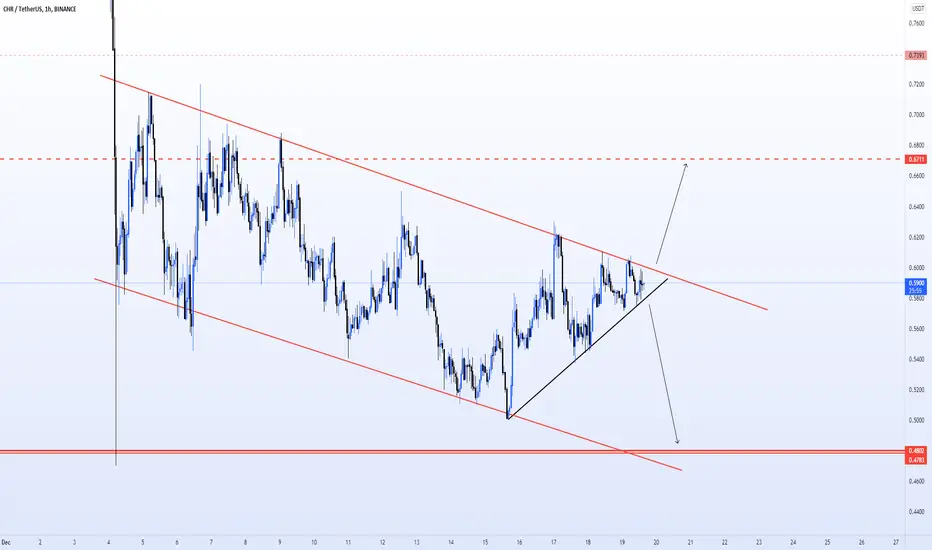
Chromia Quick Scalp : Chromia (CHR) has been consolidating for the past week inside a bearish slopping flag. A Breakout according to the arrow marks will give a quick scalping opportunity.
CHR Long on 4H frame A clear falling wedge on 4H frame.
I just bought it at 0.583 and my first target is 0.763 (⁓ 31%).
What do you think?

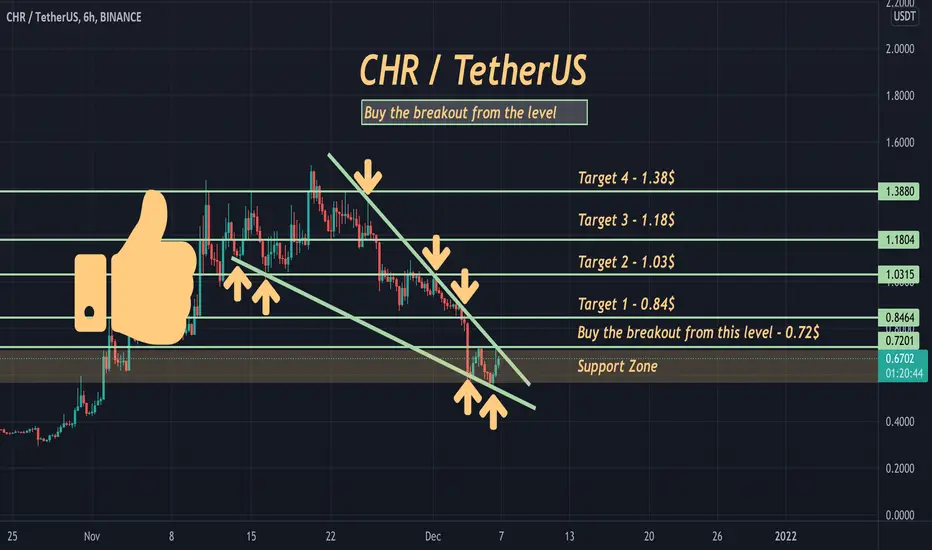
CHR UpdateHere's a quick Look at CHR 6 hr chart. As we can see, the price has printed a bigger falling wedge and we could see a break to the upside soon! Keep an eye on this falling wedge!
The best entry would be, when the price breaks above 0.72$ with good amount of volume .
-------------------------------------------
The idea is: Buy when the price breaks above 0.72$ and take profits at the levels shown in the chart.
Targets:
1. 0.84$
2. 1.03$
3. 1.18$
4. 1.38$
-------------------------------------------
What Is a Wedge in the context of trading?:
"A wedge is a price pattern marked by converging trend lines on a price chart. The two trend lines are drawn to connect the respective highs and lows of a price series over the course of 10 to 50 periods. The lines show that the highs and the lows are either rising or falling and differing rates, giving the appearance of a wedge as the lines approach a convergence. Wedge shaped trend lines are considered useful indicators of a potential reversal in price action by technical analysts.
Key Takeaways for Falling wedges:
1. Wedge patterns are usually characterized by converging trend lines over 10 to 50 trading periods.
2. The patterns may be considered rising or falling wedges depending on their direction.
3. These patterns have an unusually good track record for forecasting price reversals."
-------------------------------------------
If you like the content, then make sure to comment and like the post :D
Follow me for daily profitable trading setups
BTC dictates the market. If BTC falls, then Alts will fall as well. Trade safe!

Keep an eye on CHR - We could see a break to the upside soon!Here's a quick Look at CHR 6 hr chart. As we can see, the price has printed a bigger falling wedge and we could see a break to the upside soon! Keep an eye on this falling wedge!
The best entry would be, when the price breaks above 0.72$ with good amount of volume .
-------------------------------------------
The idea is: Buy when the price breaks above 0.72$ and take profits at the levels shown in the chart.
Targets:
1. 0.84$
2. 1.03$
3. 1.18$
4. 1.38$
-------------------------------------------
What Is a Wedge in the context of trading?:
"A wedge is a price pattern marked by converging trend lines on a price chart. The two trend lines are drawn to connect the respective highs and lows of a price series over the course of 10 to 50 periods. The lines show that the highs and the lows are either rising or falling and differing rates, giving the appearance of a wedge as the lines approach a convergence. Wedge shaped trend lines are considered useful indicators of a potential reversal in price action by technical analysts.
Key Takeaways for Falling wedges:
1. Wedge patterns are usually characterized by converging trend lines over 10 to 50 trading periods.
2. The patterns may be considered rising or falling wedges depending on their direction.
3. These patterns have an unusually good track record for forecasting price reversals."
-------------------------------------------
If you like the content, then make sure to comment and like the post :D
Follow me for daily profitable trading setups
BTC dictates the market. If BTC falls, then Alts will fall as well. Trade safe!

Keep an eye on CHR - We will see a bigger move soon!Here's a quick Look at CHR 4 hr chart. As we can see, the price has been forming a bigger falling wedge and we could see a break either way soon! BTC just needs to get stable. Keep an eye on this falling wedge!
The best entry would be, when the price breaks above 1.12$ with good amount of volume .
-------------------------------------------
The idea is: Buy when the price breaks above 1.12$ and take profits at the levels shown in the chart.
Targets:
1. 1.18$
2. 1.3$
3. 1.5
-------------------------------------------
What Is a Wedge in the context of trading?:
"A wedge is a price pattern marked by converging trend lines on a price chart. The two trend lines are drawn to connect the respective highs and lows of a price series over the course of 10 to 50 periods. The lines show that the highs and the lows are either rising or falling and differing rates, giving the appearance of a wedge as the lines approach a convergence. Wedge shaped trend lines are considered useful indicators of a potential reversal in price action by technical analysts.
Key Takeaways for Falling wedges:
1. Wedge patterns are usually characterized by converging trend lines over 10 to 50 trading periods.
2. The patterns may be considered rising or falling wedges depending on their direction.
3. These patterns have an unusually good track record for forecasting price reversals."
-------------------------------------------
If you like the content, then make sure to comment and like the post :D
Follow me for daily profitable trading setups
BTC dictates the market. If BTC falls, then Alts will fall as well. Trade safe!

CHR Loading up for a bigger move - Keep an eye on this! Here's a quick look at CHR 2 hr chart. As we can see, the price has printed a symmetrical triangle and we could see a break to the upside soon. The price will probably revisit previous ATH when it breaks out. Definitely one to keep an eye on.
The best entry would be, when the price breaks above 1.35$ with good amount of volume .
-------------------------------------------
The idea is: Buy when the price breaks above 1.35$ and take profits at the levels shown in the chart.
Targets:
- Profits can be taken in the resistance zone .
1. 1.38$
2. 1.43$
3. 1.5$
4. 1.7$
-------------------------------------------
What are triangles when it comes to trading?
Key points:
"1. In technical analysis , a triangle is a continuation pattern on a chart that forms a triangle-like shape.
2. Triangles are similar to wedges and pennants and can be either a continuation pattern, if validated, or a powerful reversal pattern, in the event of failure.
3. There are three potential triangle variations that can develop as price action carves out a holding pattern, namely ascending, descending, and symmetrical triangles."
-------------------------------------------
If you like the content, then make sure to comment and like the post :D
Follow me for daily profitable trading setups
BTC dictates the market. If BTC falls, then Alts will fall as well. Trade safe!

CHR Loading up for a bigger move! Here's a quick look at CHR 30 min chart. As we can see, the price has printed a bigger bull flag and we could see a break to the upside soon. The price will probably revisit previous ATH when it breaks out. Definitely one to keep an eye on.
The best entry would be, when the price breaks above 1.3$ with good amount of volume .
-------------------------------------------
The idea is: Buy when the price breaks above 1.3$ and take profits at the levels shown in the chart.
Targets:
- Profits can be taken in the resistance zone .
1. 1.3$
2. 1.43$
3. 1.5$
4- 1.7$
-------------------------------------------
What are triangles when it comes to trading?
Key points:
"1. In technical analysis , a triangle is a continuation pattern on a chart that forms a triangle-like shape.
2. Triangles are similar to wedges and pennants and can be either a continuation pattern, if validated, or a powerful reversal pattern, in the event of failure.
3. There are three potential triangle variations that can develop as price action carves out a holding pattern, namely ascending, descending, and symmetrical triangles."
-------------------------------------------
If you like the content, then make sure to comment and like the post :D
Follow me for daily profitable trading setups
BTC dictates the market. If BTC falls, then Alts will fall as well. Trade safe!

CHRUSDT , We are going to support zone and jumpHello guys
This is one the coin analysis that some one send us message to analysis
According to the chart we shown , We had a resistance zone and we need to break that zone and the price exactly done this and now we are in pullback and we expect that the price can support when impact to the trendline support then it can go up until the target shown on chart guys
Guys please at first take signal then entrance in any position
( signal : hammer or ascending cover or pattern price or ... )
Dont forget use stop loss and attention to money management
Good Luck
Abtin

CHROMIA Breakout Done & Now Retesting. Ready To Go Higher!👉 CHRUSD Technical Indicators:
▫️ All EMA are placed below the price as supports.
▫️ Cup with Handle bullish pattern with breakout done.
▫️ Retest of the neckline in process.
▫️ Waiting now for a bounce strong enough, to take-off toward uptrend rally.
👉 CHRUSD Fundamental:
▫️ Chromia's Dev Team must also restore quickly confidence with its large community and investors who, following nearly 7 months of accumulation in a non-volatile range, are starting to seriously criticize the project and losing interest in it. This is the reason for this breakout, and the next few days, to be at a crucial time for #CHR short term future.
Learn TA, Earn Money, and as usual Have Safe Trade. Enjoy this Sunday with family and loved ones.

What about CHR?This token is in a good position and if Bitcoin cooperates and considering Bitcoin Dominance, the upward trend to the targets can be continued.

CHR Updated Chart - Previous setup met TP1!Here's a quick look at CHR 2 hr chart. As we can see, the price has printed a bigger symmetrical triangle and we could see a break to the upside soon. The price will probably revisit previous ATH when it breaks out. Definitely one to keep an eye on.
The best entry would be, when the price breaks above the symmetrical triangle with good amount of volume .
-------------------------------------------
The idea is: Buy the breakout from the symmetrical triangle and take profits at the levels shown in the chart.
Targets:
- Profits can be taken in the resistance zone .
1. 1.38$
2. 1.42$
3. 1.7$
-------------------------------------------
What are triangles when it comes to trading?
Key points:
"1. In technical analysis , a triangle is a continuation pattern on a chart that forms a triangle-like shape.
2. Triangles are similar to wedges and pennants and can be either a continuation pattern, if validated, or a powerful reversal pattern, in the event of failure.
3. There are three potential triangle variations that can develop as price action carves out a holding pattern, namely ascending, descending, and symmetrical triangles."
-------------------------------------------
If you like the content, then make sure to comment and like the post :D
Follow me for daily profitable trading setups
BTC dictates the market. If BTC falls, then Alts will fall as well. Trade safe!

CHR Loading up for a big move!Here's a quick look at CHR 2 hr chart. As we can see, the price has printed a bigger symmetrical triangle and we could see a break to the upside soon. The price will probably revisit previous ATH when it breaks out. Definitely one to keep an eye on.
The best entry would be, when the price breaks above the symmetrical triangle with good amount of volume.
-------------------------------------------
The idea is: Buy the breakout from the symmetrical triangle and take profits at the levels shown in the chart.
Targets:
- Profits can be taken in the resistance zone .
1. 1.33$
2. 1.42$
3. 1.7$
-------------------------------------------
What are triangles when it comes to trading?
Key points:
"1. In technical analysis , a triangle is a continuation pattern on a chart that forms a triangle-like shape.
2. Triangles are similar to wedges and pennants and can be either a continuation pattern, if validated, or a powerful reversal pattern, in the event of failure.
3. There are three potential triangle variations that can develop as price action carves out a holding pattern, namely ascending, descending, and symmetrical triangles."
-------------------------------------------
If you like the content, then make sure to comment and like the post :D
Follow me for daily profitable trading setups
BTC dictates the market. If BTC falls, then Alts will fall as well. Trade safe!

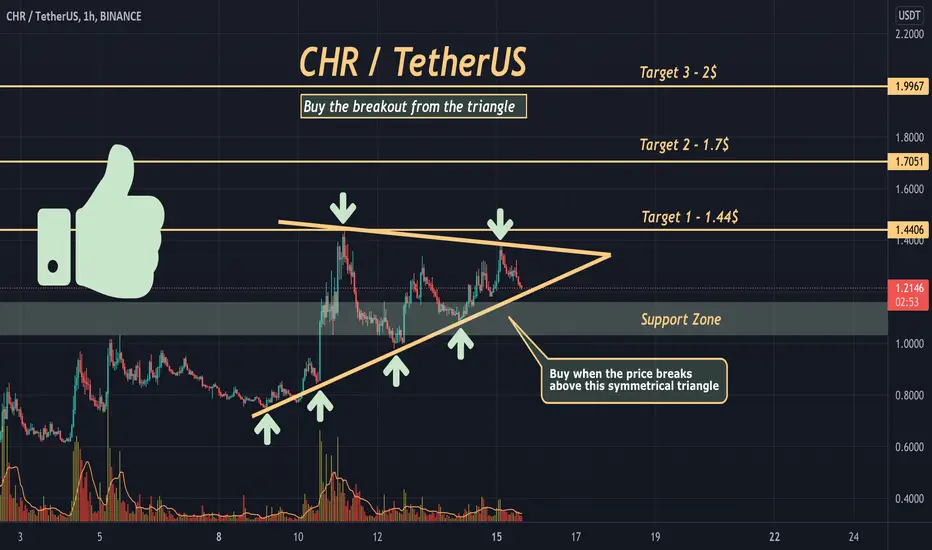
CHR is loading up for another big push to the upside! Here's a quick look at CHR 1 hr chart. As we can see, the price has printed a symmetrical triangle. The price will probably revisit previous ATH when it breaks out. Definitely one to keep an eye on.
The best entry would be, when the price breaks above the symmetrical triangle with good amount of volume , or you can buy when the price breaks above 1.44$.
-------------------------------------------
The idea is: Buy the breakout from the symmetrical triangle (or 1.44$) and take profits at the levels shown in the chart.
Targets:
- Profits can be taken in the resistance zone .
1. 1.44$
2. 1.7$
3. 2$
-------------------------------------------
What are triangles when it comes to trading?
Key points:
"1. In technical analysis , a triangle is a continuation pattern on a chart that forms a triangle-like shape.
2. Triangles are similar to wedges and pennants and can be either a continuation pattern, if validated, or a powerful reversal pattern, in the event of failure.
3. There are three potential triangle variations that can develop as price action carves out a holding pattern, namely ascending, descending, and symmetrical triangles."
-------------------------------------------
If you like the content, then make sure to comment and like the post :D
Follow me for daily profitable trading setups
BTC dictates the market. If BTC falls, then Alts will fall as well. Trade safe!

CHRUSDT - Symmetric triangle!CHRUSDT (4h Chart) Technical analysis
CHRUSDT (4h Chart) Currently trading at $1.24
Buy level :Above $1.26 (Buy after Breakout)
Stop loss: Below $1.07
TP1: $1.34
TP2: $1.44
TP3: $1.60
TP4: $1.80
Max Leverage 3x
Always keep Stop loss
Follow Our Tradingview Account for More Technical Analysis Updates, | Like, Share and Comment Your thoughts.


CHR trapped retail on top now its Anxiety phase next denial fearIt clearly formed clear Head and shoulders. now buyers are in anxiety phase , soon to denial phase than fear n desperation phases open small short position to capture 10-15% down side .
GL NFA

Rouding bottom and Inverse H&SCHR is looking extremely bullish with multiple chart patterns confirmed.
Rouding bottom and Inverse H&S
*NOT FINANCIAL ADVICE
