+10R Liquidity Supply & Demand (LSD)On the 30m chart (CL)
During ODR range formation created zone.
Price then created a higher low and then broke upwards and created another higher high.
So, the idea is to go long at the zone with a SL of 10 ticks and a TP of 101 ticks.
Cl!


CRUDE OIL (CL) PREDICTIONCRUDE OIL (CL) PREDICTION
📊 Market Sentiment
Crude oil prices had been trending lower following signs of de-escalation in the Israel–Palestine conflict, easing tensions with Iran, and emerging peace signals from the Russia–Ukraine front.
However, recent statements from Trump and the possibility of a U.S. military action against Venezuela have shifted sentiment back to the upside.
Venezuela holds approximately 18% of the world’s proven oil reserves and ranks as the 12th largest oil producer globally. Any potential conflict involving the U.S. could significantly disrupt supply expectations, acting as a strong bullish catalyst for oil prices.
📈 Technical Analysis
CL swept monthly liquidity around the $55 level and has since shifted into a bullish structure on the daily timeframe.
In my view, this move indicates that price has gathered sufficient energy for either continuation higher or a controlled retracement before the next bullish leg.
📌 Prediction – Game Plan
I entered a long position at 56.24$.
🎯 TP1: 57.70$
I will take partial profits here and move the remaining position to breakeven.
🎯 TP2: 58.90$
🛑 Stop Loss: Daily close below 55.40$
💬 For deeper sentiment and strategy insights, subscribe to my Substack free access available.
This analysis is for educational purposes only and does not constitute financial advice. Always conduct your own research before trading or investing.

5m & 4H Supply and Demand Short - CLLooks like Price (CL!) is getting to a support area based on the 4H chart (zoom out).
So, I've mapped a daily gap, 4H zone, for a quick short.
There are double bottoms way down around 58.27, so keep an eye out as this 4H trend has got to get swiped.

4H Supply & Demand | Going Long, BabyHere we have a diamond reversal pattern on the 4H.
Now that it broke out, I'm looking for a liquidity zone to retrace to and then go long for just 60 ticks on the 5m chart. Follow for more value.
- Mr. Trader-CL

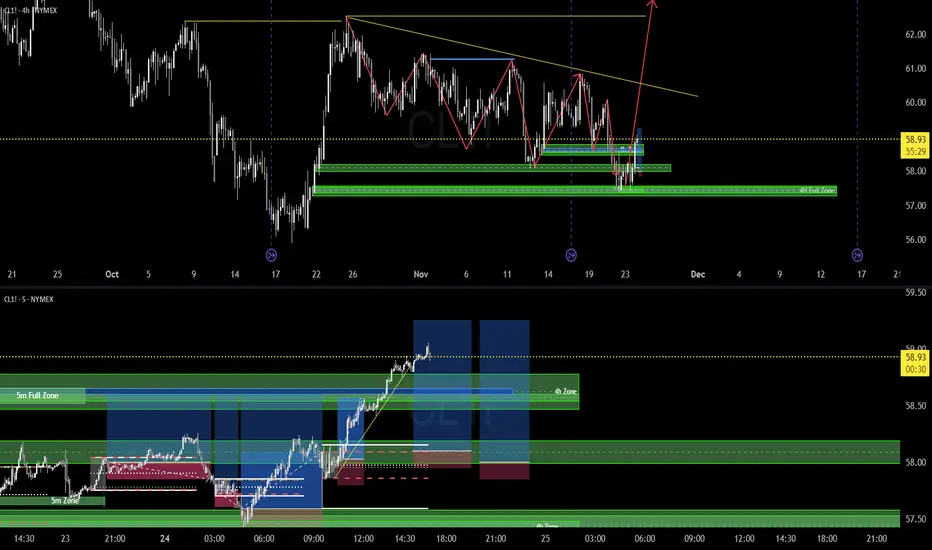
Confidence & Power | Supply & Demand Trading 4H/5m TimeframeOk, here it is for a 2nd chance.
Trendline is gonna get utterly swiped before we make a new high.
Based on 4H zones, I enter on the 5 minute chart.
- Mr. Trader-CL
Crude Oil is InflationOne of the best ways to gauge where inflation is heading is by tracking the relationship between crude oil prices and the U.S. Consumer Price Index (CPI).
If we take a moment to observe their movement from the 1980s to today, we can see that they have generally moved in tandem. The year of their peaks and troughs are in synchronization.
So, who is leading whom?
Is it the inflation data that drive crude oil prices higher or lower — or is it crude oil prices that influence the inflation trend?
WTI Crude Oil Futures & Options
Ticker: MCL
Minimum fluctuation:
0.01 per barrel = $1.00
Disclaimer:
• What presented here is not a recommendation, please consult your licensed broker.
• Our mission is to create lateral thinking skills for every investor and trader, knowing when to take a calculated risk with market uncertainty and a bolder risk when opportunity arises.
CME Real-time Market Data help identify trading set-ups in real-time and express my market views. If you have futures in your trading portfolio, you can check out on CME Group data plans available that suit your trading needs www.tradingview.com

CL Crude Oil Short Supply-DemandSee Chart For Details.
Mainly a technical edge with price inside Daily supply + resistance and we have confirmation on lower timeframes.
Technicals = bearish
Fundamentals = Mixed
Sentiment = Mixed
Overall Slight edge I would say roughly 25% chance of 5:1


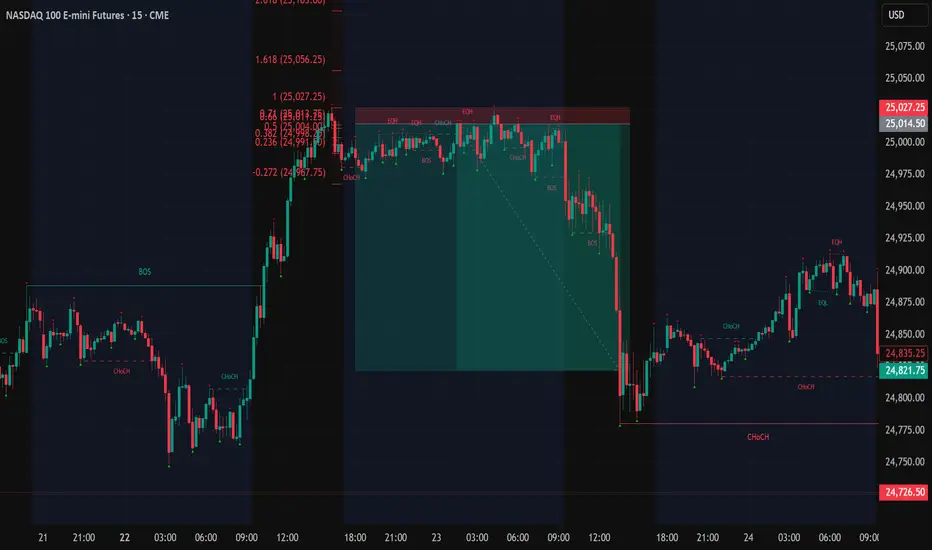
Nq shorts at the momentI took a short position here and am looking to trail it down for a decent RR.
Glory to Christ!

My past present and Futures with Christ!We have been doing things quite different lately.
One setup is all we do.
It is quite boring.
But it works
and Christ is the center of it all!
Crude Oil Pivot at $65 | Break & Hold Fuels UptrendLast Sunday Opec+ agrees further oil output boost by 137K barrels per day, but less than Sep / Aug output, when market open it went higher.
How to manage short-term risk, in this case opportunity with CME Group weekly energy options on such a scheduled announcement?
Video version:
Crude Oil Futures & Options
Ticker: CL
Minimum fluctuation:
0.01 per barrel = $10.00
Disclaimer:
• What presented here is not a recommendation, please consult your licensed broker.
• Our mission is to create lateral thinking skills for every investor and trader, knowing when to take a calculated risk with market uncertainty and a bolder risk when opportunity arises.
CME Real-time Market Data help identify trading set-ups in real-time and express my market views. If you have futures in your trading portfolio, you can check out on CME Group data plans available that suit your trading needs tradingview.com/cme/

Manage Crude Oil Risk with Weekly Energy OptionsOn Sunday Opec+ agrees further oil output boost by 137K barrels per day, but less than Sep / Aug output, when market open it went higher.
How to manage short-term risk, in this case opportunity with CME Group weekly energy options on such a scheduled announcement?
Crude Oil Futures & Options
Ticker: CL
Minimum fluctuation:
0.01 per barrel = $10.00
Disclaimer:
• What presented here is not a recommendation, please consult your licensed broker.
• Our mission is to create lateral thinking skills for every investor and trader, knowing when to take a calculated risk with market uncertainty and a bolder risk when opportunity arises.
CME Real-time Market Data help identify trading set-ups in real-time and express my market views. If you have futures in your trading portfolio, you can check out on CME Group data plans available that suit your trading needs www.tradingview.com

RBOB from $2.08 to $1.23Crude is in a downtrend and therefore so is RBOB and any other crude products. "Drill baby drill" as he says :/
Good luck!

CL down sub $60 before moving up above $73Expected support or reversal zone based on last swing high for CL is at $60. This matches with 0.786 fib level of last move up, suggesting a standard SBS structure forming. Expecting a move up to at least $73 (fib 0.236), possibly also well beyond this.
Based on time fib of last swing high I expect the bottom to occur before July 20th.

Futures Watchlist for week ending 6/27/2025Come join as i go through the future tickers that im watching this week and where i see them going. With war talks filling up on social media this will add to our volatility and we will look at key levels to capitalize off of it! Let me know your thoughts on these tickers. Also let me know if there is another symbol futures or stocks that you want me to breakdown for you!

What Is the Base Price for Oil?What is the base price for oil? Specifically, today we will discuss crude oil, and we can apply this understanding to other commodities as well.
I won't go into too much technical detail about the difference between the base price and the cost price for crude oil, but for most people, it helps to see the title as “Is there a bottom-line price or support level for crude oil?”
My answer is yes, and this is due to inflation. Over time, we tend to pay higher prices for food, gas and many others that we consume.
WTI Crude Oil Futures & Options
Ticker: MCL
Minimum fluctuation:
0.01 per barrel = $1.00
Disclaimer:
• What presented here is not a recommendation, please consult your licensed broker.
• Our mission is to create lateral thinking skills for every investor and trader, knowing when to take a calculated risk with market uncertainty and a bolder risk when opportunity arises.
CME Real-time Market Data help identify trading set-ups in real-time and express my market views. If you have futures in your trading portfolio, you can check out on CME Group data plans available that suit your trading needs www.tradingview.com
Trading the Micro: www.cmegroup.com
www.cmegroup.com

CL Futures Weekly Trade Setup — June 17, 2025🛢️ CL Futures Weekly Trade Setup — June 17, 2025
🎯 Instrument: CL (Crude Oil Futures)
📉 Strategy: Short Swing
📅 Entry Timing: Market Open
📈 Confidence: 68%
🔍 Model Insights Recap
🧠 Grok/xAI – Bearish due to overbought RSI + price stalling near MAs
🤖 Claude/Anthropic – Bearish pullback expected, despite recent strength
📊 Llama/Meta – Overextended Bollinger Band + RSI = short bias
🧬 DeepSeek – Supports downside via divergence + high volatility
⚠️ Gemini/Google – Bullish thesis based on momentum; diverges from consensus
📉 Consensus Takeaway
While short-term momentum is strong, most models forecast a pullback due to:
🔼 Overbought RSI readings
📈 Price extended well above key moving averages
🧨 High volatility and profit-taking zone near $73–$74
✅ Recommended Trade Setup
Metric Value
🔀 Direction Short
🎯 Entry Price $72.65
🛑 Stop Loss $74.20
🎯 Take Profit $68.80
📏 Size 1 contract
📈 Confidence 68%
⏰ Timing Market Open
⚠️ Key Risks & Considerations
🌍 Geopolitical events or OPEC news can cause unexpected surges
📉 If bullish momentum resumes, upside breakout could invalidate short thesis
📏 Risk management is critical—stick to stop-loss if price breaks above $74.20
🧾 TRADE_DETAILS (JSON Format)
json
Copy
Edit
{
"instrument": "CL",
"direction": "short",
"entry_price": 72.65,
"stop_loss": 74.20,
"take_profit": 68.80,
"size": 1,
"confidence": 0.68,
"entry_timing": "market_open"
}
💡 Watch price action at the open. If oil opens weak or fails to reclaim $73, this short setup has a strong edge.

CL ready for new move upBased on time fib and Feigenbaum constants, CL is closing in on the bottom for this swing, expected within marked timezone. The swing highs/lows follows the Feigenbaum projections for the last few swings. I expect a dip below $57 before a new run higher, at least to $72-73.

WTI Crude oil Holds Support Despite OPEC Production IncreaseWTI crude was on the ropes Monday morning following another surprise production increase from OPEC+. Yet despite the weak start to the week, oil prices held above the April low despite the bearish headlines.
Given we've already seen a -15% decline over the prior eight days and a bullish divergence has formed, I suspect some bullish mean reversion is due. Bulls could seek a move to the $60 area, near the April VPOC. Note that the December 2023 low might also provide some resistance along the way.
Matt Simpson, Market Analyst at City Index and Forex.com

Looking to short CL to continue lowerCL is making a corrective move higher before moving down to the ultimate target of last Daily structure leg down. It retraced to Daily bearish Fair Value Gaps (internal range liquidity zones) which should act as resistance. 15M bearish structure is in Extreme premium.
I'm looking for CL to break down bullish corrective structure on 5M chart and start a final move down.

Looking to short CLCL is starting to show weakness on most of the timeframes for potential continuation of leg down of Daily bearish structure.
Looking for retrace to 15M premium zone for a possible short
