Crude Oil is forming a head and shoulder patternA downtrend channel and a HS pattern is forming. What do you think?
Cl1!short

CL Crude Oil analysis - ShortPrice this broke a 13 month Trend line support level, and is showing signs of a retest before what I expect to be a further push lower, beginning a downtrend. First off we see price may have found a short term bottom where price almost exactly hit a tight Fibonacci cluster zone (fib. ext. 150, fib. proj. 127.2, fib. retrac. 88.6). On the same day (5/5/17, NFP Friday) of hitting the fib. cluster zone, we see a quick reversal back up near the short term support break that occurred on Thursday. I'm anticipating price to move slightly higher, closer to the 38.2 fib retracement of the current down swing ($47.58) where I expect price to retest before moving down to continue the current downtrend. TVC:USOIL


THINK REDForget about the inverse head and shoulders crap.
We arent rallying.
We are going to new lows.
YOY surplus is growing as we now enter seasonal maintenance season.
Global production is surging.
Storage is full.
Market has clearly topped.
50 Day under 100 Day
Seasonality is always weak this time of the year.
Best case scenario opec freezes as levels that are too high to begin with.
Dollar is rallying very hard.
Goodness gracious what a short this is.


The technical analysis for oil (2)Continuing the theme of oil, add one more technical analysis. Other indicators for oil 5 from 5 show us a trend reversal, one and the last signal indicates as technical analysis confirmed this, as can be seen from the chart, the price of oil is in reversal zone that shows us Bears open short positions, and Bulls close long positions, the movement of prices on the H4 cyclically repeating for the fourth time violated, from experience I can say that the price of oil price shows a trend reversal and started preparation downward movement. Based on the foregoing, I declare that it is time to open short positions from 48-47. The first target of 25-28, second target 15-18. If you find a useful recommendation, put Like. Tips: WebMoney Z117104600117
Yours faithfully,
Vinter Frank.

PRICE ACTION / TREND FOLLOWING VOLUME #5PRICE ACTION TRADING.
STEP NINE
Find a supply and demand zone.
STEP TEN
Find a PINBAR at demand or supply zone.
PRACTICE,PRACTICE,PRACTICE AND PRACTICE
SEE YOU AT NEXT VOLUME !!

$CHK Bearish Wolfe WaveHello Traders,
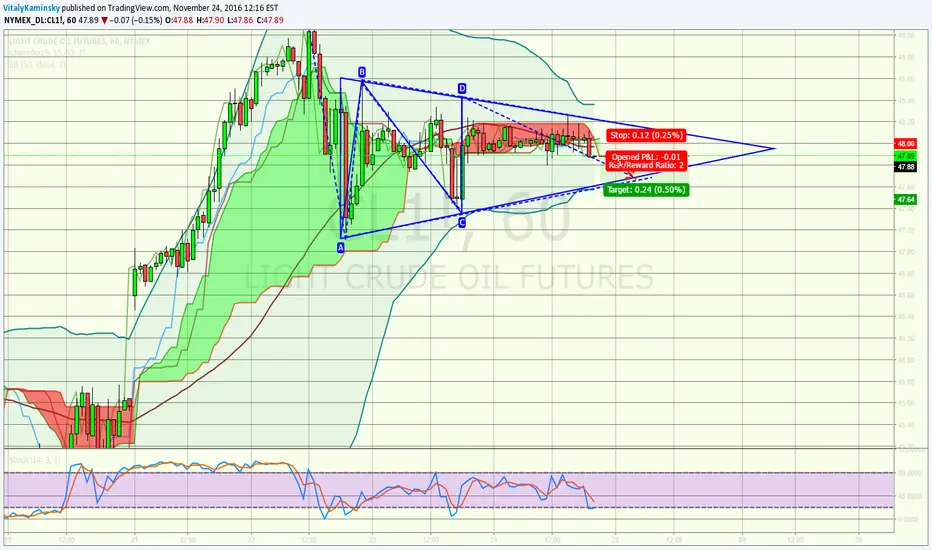
Similar to my CL1! and USOIL charts I posted yesterday. Chesapeake Energy formed a very similar structure. I would be interested to see how well these 3 charts correlate with one another. The charts I am referring to are found below.
Best,
Chartistry
