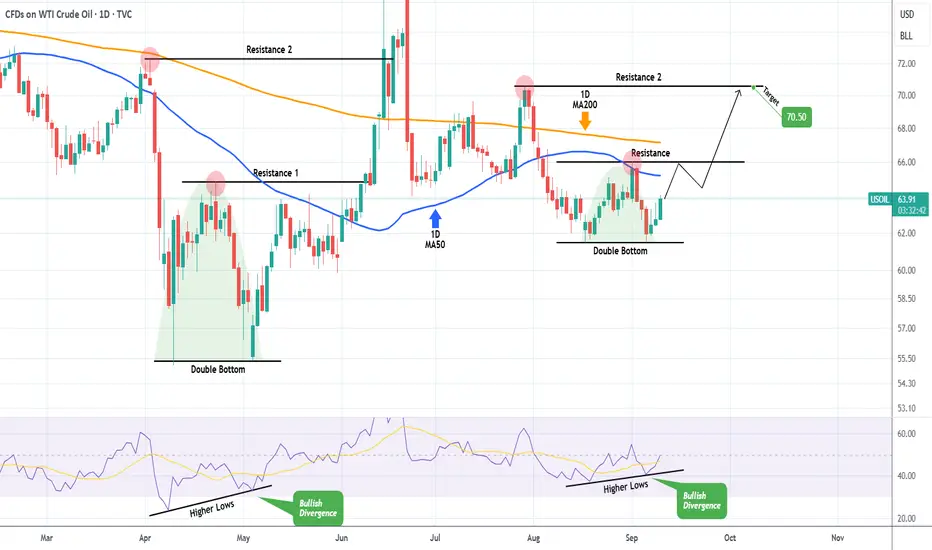
WTI OIL Recent fractal calls for a buy towards $70.50.WTI Oil (USOIL) is on the 3rd straight green 1D candle following a Double Bottom bounce on the 61.50 Support. At the same time the 1D RSI formed Higher Lows, which is a Bullish Divergence.
The same set of conditions emerged on the May 05 bottom rebound, which resulted into initially a 1D MA50 (blue trend-line) test and then a Resistance 2 contact.
As a result, we expect this rise to continue, targeting $70.50.
-------------------------------------------------------------------------------
** Please LIKE 👍, FOLLOW ✅, SHARE 🙌 and COMMENT ✍ if you enjoy this idea! Also share your ideas and charts in the comments section below! This is best way to keep it relevant, support us, keep the content here free and allow the idea to reach as many people as possible. **
-------------------------------------------------------------------------------
💸💸💸💸💸💸
👇 👇 👇 👇 👇 👇
Crude Oil Futures WTI (CL1!)
Crude Oil - Eye twinkle to go long?The Test/Retest was expected, and it was not that clean as it is mostly. Usually I don't want to see price trading back into the fork again.
This time, price managed to jump out of it again and opened above the U-MLH. If it can close outside the fork too, then this would be a good hint for me to load the boat.
The 80% target is the yellow Centerline, or even higher, since the drillers moan about a too low price (Fundamental Fact).
Let's see if we find some petro dollars.


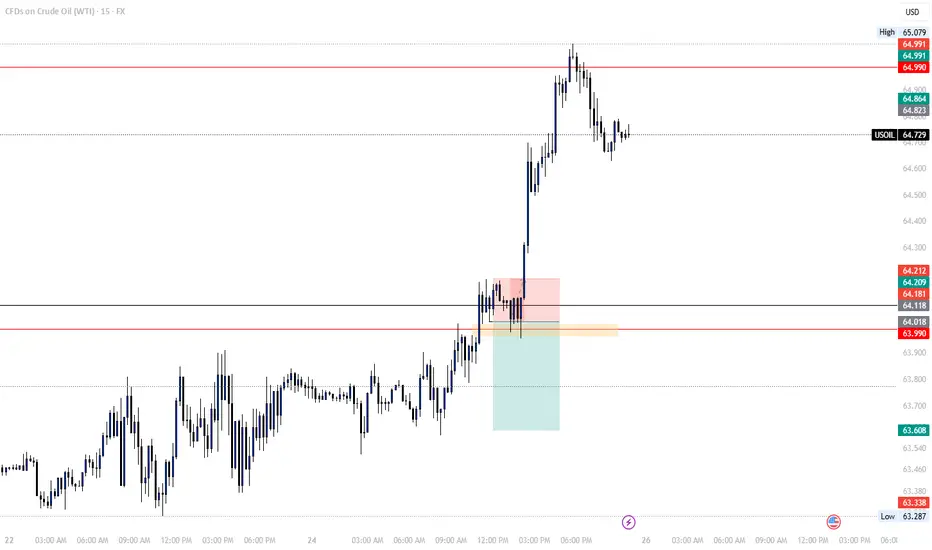
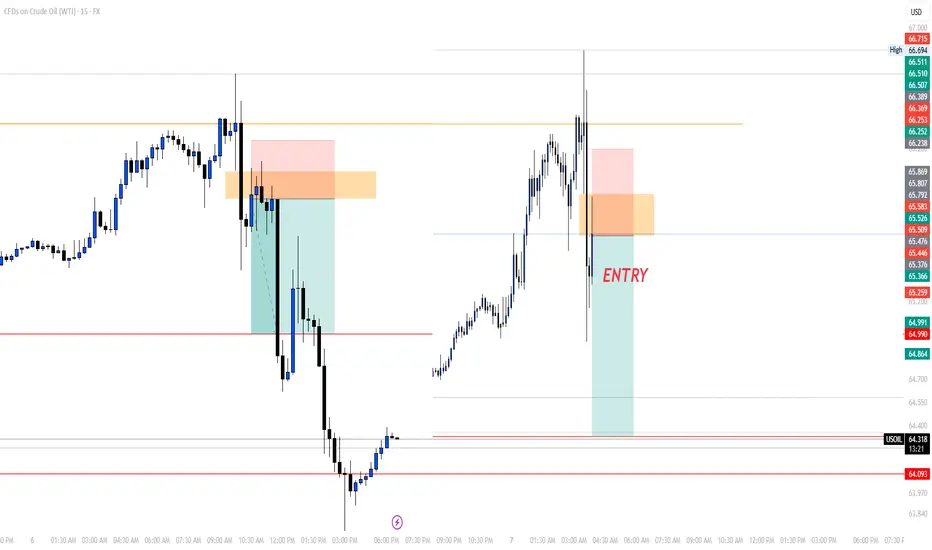
BUY USOILBeen a while since I last shared a trade to take, but today as you can see, the market grabbed the LQ to give us an entry point to take for a long trade.
Follow for more!

WTI OIL Short-term Channel Up 4H MA50 buy opportunity.Last week (August 26, see chart below) we caught the absolute low with our WTI Oil (USOIL) buy signal, hitting our $66.30 Target shortly after:
This time we have another buy signal on the short-term as the Channel Up that emerged has pulled-back all the way to its 4H MA50 (blue trend-line).
The last 3 times it did so, it was a buy opportunity. Assuming this is another Higher Low bottom, the new Bullish Leg that is about to be initiated, should aim for the 1.382 Fibonacci extension, similar to what the previous two did.
This gives us a $66.75 Target for the short-term.
-------------------------------------------------------------------------------
** Please LIKE 👍, FOLLOW ✅, SHARE 🙌 and COMMENT ✍ if you enjoy this idea! Also share your ideas and charts in the comments section below! This is best way to keep it relevant, support us, keep the content here free and allow the idea to reach as many people as possible. **
-------------------------------------------------------------------------------
💸💸💸💸💸💸
👇 👇 👇 👇 👇 👇

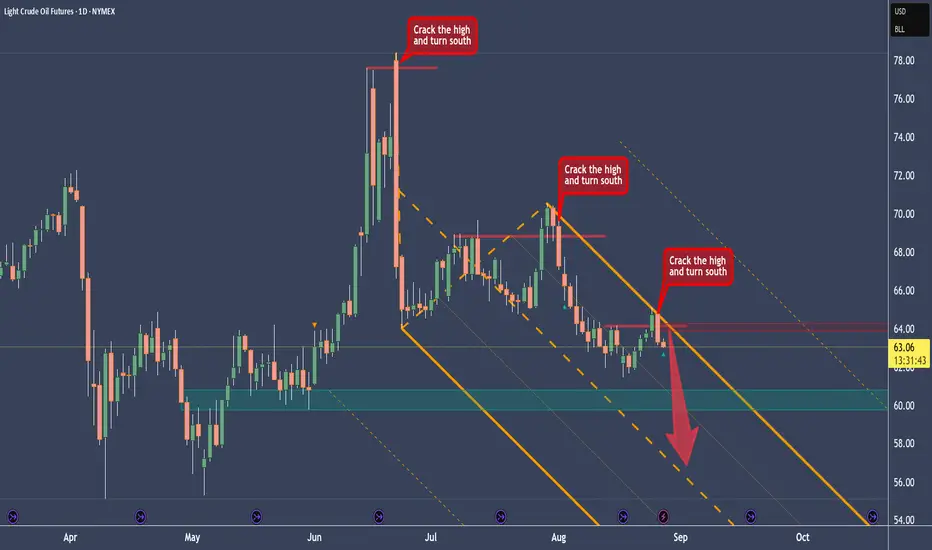
Crude Oil Short After Finding A Recurring BehaviorAfter I cleared the CL chart, I immediately saw a behavior that we can use for a setup right now.
You see that the highs got cracked, and then immediately price turns to the south. And since we are in a downtrend on Crude, we have a legit Short-Trade at hand.
With the modified Shiff-Fork you see how nice CL is reacting at the U-MLH, where it get's rejected. This level also coincides with the crack level.
I personally would love a pullback up to the crack-zone before shorting it. Maybe the trading Gods give us a gift on this Wednesday.
Talking about Wednesday: today we get the Crude Oil EIA numbers, which will probably move the markets.
However you plan is if you trade it, don't have FOMO. There are many more trades to come in your trading career.
Have a happy hump day §8-)
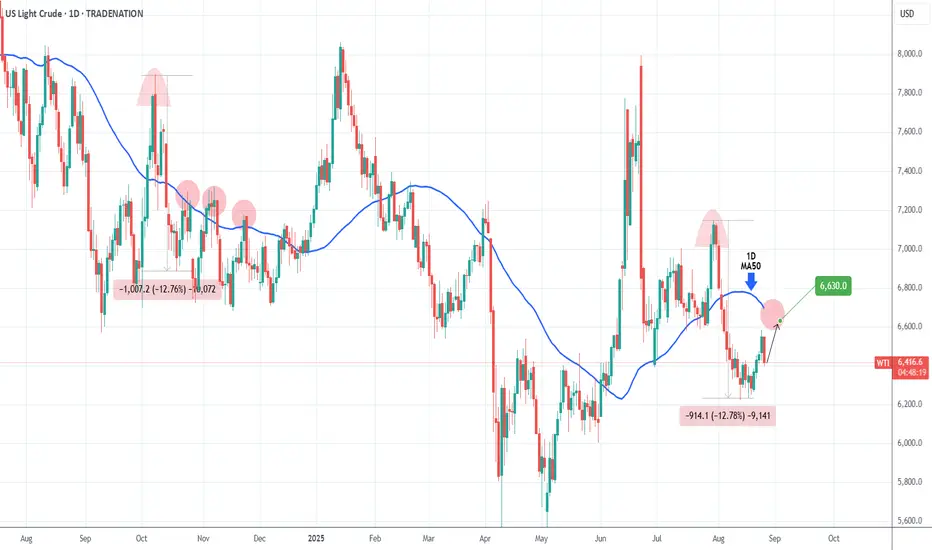
WTI OIL technically more chances to test the 1D MA50. Buy.Last week (August 20, see chart below) we issued a bullish break-out signal on WTI Oil (USOIL) that reached our $65.60 Target within 3 days:
This time we get a new buy signal, despite today's sharp pull-back. The -12.78% decline since the July 30 rejection, resembles the one since the October 08 2024 High.
This rebounded to just above the 1D MA50 (blue trend-line) to form a new Lower High and get rejected again.
As a result, our immediate short-term Target is $66.30.
-------------------------------------------------------------------------------
** Please LIKE 👍, FOLLOW ✅, SHARE 🙌 and COMMENT ✍ if you enjoy this idea! Also share your ideas and charts in the comments section below! This is best way to keep it relevant, support us, keep the content here free and allow the idea to reach as many people as possible. **
-------------------------------------------------------------------------------
Disclosure: I am part of Trade Nation's Influencer program and receive a monthly fee for using their TradingView charts in my analysis.
💸💸💸💸💸💸
👇 👇 👇 👇 👇 👇
TRADE WENT SIDEWAYSIn the trade I posted today, the price managed to take the LQ, fill the Buyside FVG and keep climbing higher.
Small loss which will be recovered in the following days!
Follow for more!
WTI OIL Buy signal if the 4H MA50 breaks.WTI Oil (USOIL) appears to have found short-term Support since the August 13 Low, turning sideways, with its 4H RSI however on Higher Lows, thus displaying a Bullish Divergence.
This is similar to the June 24 - July 02 Bullish Divergence, which once it broke above the 4H MA50 (blue trend-line), it topped a little over the 0.382 Fibonacci retracement level.
As a result, we will be waiting for the 4H MA50 bullish break-out signal to target $65.60 (Fib 0.382).
-------------------------------------------------------------------------------
** Please LIKE 👍, FOLLOW ✅, SHARE 🙌 and COMMENT ✍ if you enjoy this idea! Also share your ideas and charts in the comments section below! This is best way to keep it relevant, support us, keep the content here free and allow the idea to reach as many people as possible. **
-------------------------------------------------------------------------------
Disclosure: I am part of Trade Nation's Influencer program and receive a monthly fee for using their TradingView charts in my analysis.
💸💸💸💸💸💸
👇 👇 👇 👇 👇 👇

SELL USOILOur trade for today is on OIL as usual, in which we're going short after that the market grabbed the liquidity and gave us a clean entry to take.
Follow for more!

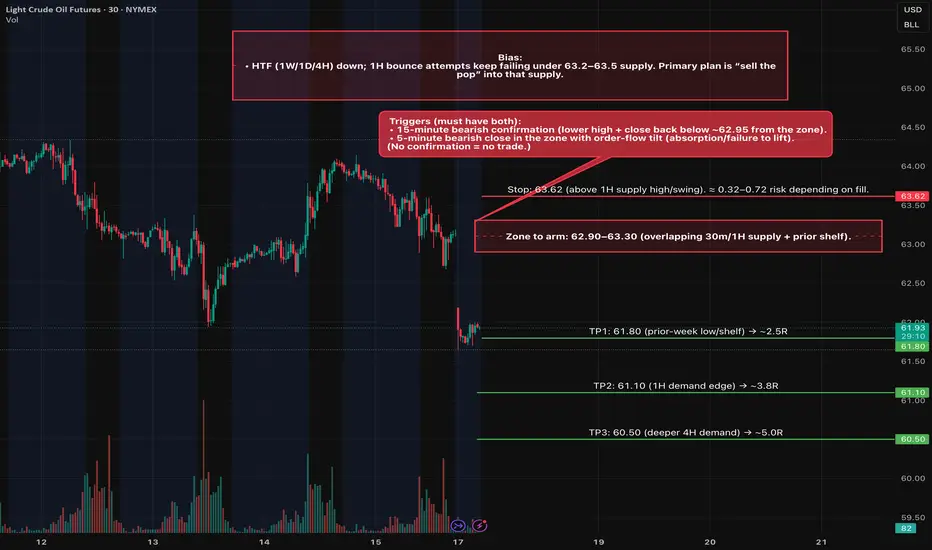
CL (Oil Futures) Short Trade Idea 08/17Setup
• Type: Rejection of 4H/1H supply → continuation lower.
• Zone to arm: 62.90–63.30 (overlapping 30m/1H supply + prior shelf).
• Triggers (must have both):
• 15-minute bearish confirmation (lower high + close back below ~62.95 from the zone).
• 5-minute bearish close in the zone with order-flow tilt (absorption/failure to lift).
(No confirmation = no trade.)
Entry & Risk
• Entry: MOS on the confirming 5m close within 62.90–63.30.
• Stop: 63.62 (above 1H supply high/swing). ≈ 0.32–0.72 risk depending on fill.
• Size: Calibrate so full-stop loss = ≤ 1R of your plan.
Targets (R:R from 63.10 mid-entry, 0.52 stop)
• TP1: 61.80 (prior-week low/shelf) → ~2.5R
• TP2: 61.10 (1H demand edge) → ~3.8R
• TP3: 60.50 (deeper 4H demand) → ~5.0R
Management
• Scale 1/2 at TP1; trail above last 5m swing after a fresh LL or hold for TP2.
• If price tags 63.30–63.50 and closes 15m above 63.50, invalidate the short idea until structure resets.
• Avoid fresh risk within ~10–15 min of EIA Wed 10:30 ET; re-arm after the first post-release 15m bar closes.
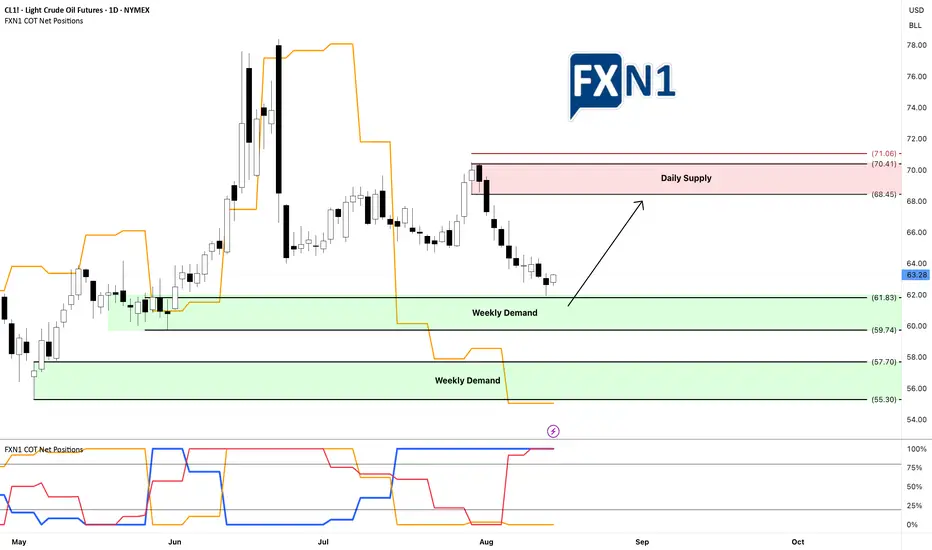
Oil Market Insights: Demand Zones and Future FundamentalsYesterday, CL1! oil tested and rebounded from my weekly demand zone without triggering my entry, resulting in a missed opportunity for several points. This suggests to me that there is buying interest at this level, regardless of the fact that non-commercial traders are short. I am now looking for a retest of this area—if I'm fortunate—to enter a long position. I am also awaiting the new COT data tomorrow to assess any potential shifts in fundamentals. Additionally, I am considering the presence of a stronger demand zone below, which appears even more promising. We'll see how it unfolds.
✅ Please share your thoughts about CL1! in the comments section below and HIT LIKE if you appreciate my analysis. Don't forget to FOLLOW ME; you will help us a lot with this small contribution.
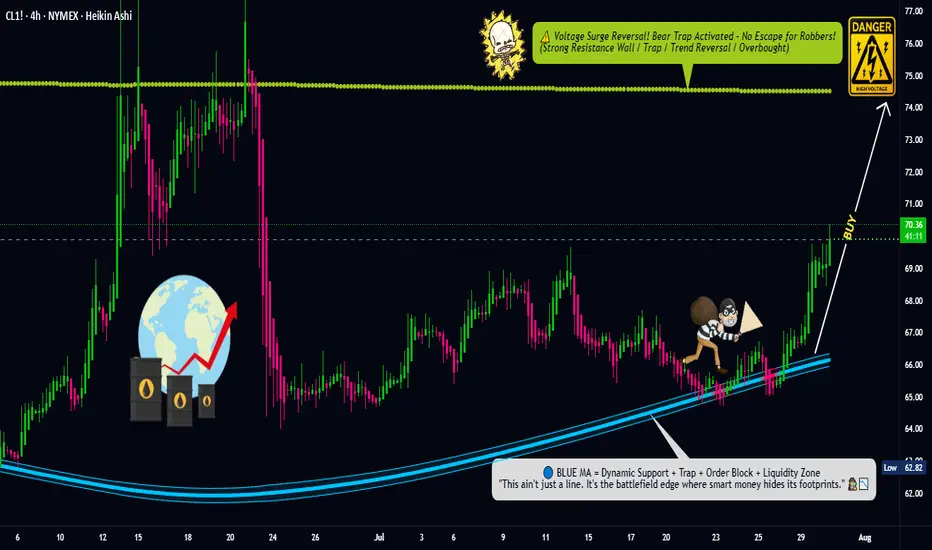
Oil Trap Activated – Limit Orders Set for the Big Score💥🛢️Crude Oil Vault Breach Plan – DCA Heist Begins!🧨💰
🚨Asset: CL1!
📈Bias: BULLISH RAID MODE ON
🎯Target: $74.50
🛡️Stop Loss: $67.50
🔑Entry: ANY LEVEL – Thief stacking limit orders like layers of gold bars 💼⚖️ (DCA Mode Activated)
🕵️♂️Thief Trader is not chasing, we're ambushing 🧠 — scaling in smart with multiple limit traps. The crew never FOMOs, we trap the market 🎯.
💣This is a layered loot plan, not for weak hands. Watch how we load up quietly while market sleeps 😴, then hit hard when the vault cracks open 🔐.
Support this heist by smashing that ❤️LIKE button
💬 Comment your plans below & join the real thief squad
🤝 Together we rob the market — LEGALLY & LOGICALLY
#ThiefTrader #OilHeist #CL1 #BullishTrap #DCA #CrudeOilStrategy #SmartMoneyPlay #MarketRobbery #TeamLoot #NoRetailPanic
USOIL Robbery Alert! Smart Entry Plan Below Key MA Level🔐💥 “WTI Energy Heist: Thief Trader’s Bearish Master Plan” 💥🔐
The Official Robbery Blueprint for Smart Traders
🌟 Hi! Hola! Ola! Bonjour! Hallo! Marhaba! 🌟
💸 Welcome, Money Makers & Market Robbers! 💸
🚨 Get ready to break into the "US Oil Spot/WTI" market with precision-crafted bearish strategy from the one and only — Thief Trader Style!
📉💣 THE HEIST IS ON: SHORT PLAN LOADED! 💣📉
We’ve analyzed the charts using Thief Technicals + Fundamental Lockpick Tools and spotted a high-risk GREEN zone – a consolidation trap where greedy bulls usually get caught. This is where we strike.
🔑 ENTRY:
"Wait for the Neutral Moving Average to Break — Then Make Your Move!"
🎯 Focus zone: 64.50
☠️ Wait for the breakout – do NOT enter before it happens.
✅ Use sell stop orders above the MA line or place sell limit orders on the pullback after the breakout (target within the 15–30 min candle near swing high/low).
🧠 Thief Tip: Layer in entries using the DCA (layered attack strategy) to catch price on its way down. Set a chart alert so you don’t miss the strike moment.
🛑 STOP LOSS:
"Set it smart or don’t set it at all — you choose the fire you want to play with!"
📍 SL only gets placed AFTER breakout.
🎯 Recommended SL at 66.00 on the 4H swing level.
☠️ DO NOT place any orders or SL before confirmation breakout.
📊 Your SL depends on your risk %, lot size, and number of entries stacked.
🎯 TARGET ZONE: 62.50
💸 Lock profits before the bulls wake up. This level is based on market exhaustion zones and historical bounce areas.
🧠 WHY WE'RE SHORTING THIS?
This isn’t just a chart move — it’s backed by full-scale robbery research:
📰 COT Reports
📈 Macro & Seasonal Trends
🛢️ Crude Oil Inventories
💹 Sentiment & Intermarket Correlation
📉 Supply-Demand Dynamics
📚 Before pulling the trigger, educate yourself with the fundamentals. Dive into COT, Seasonal, and Macro reports. Don’t rob blindly — rob smart.
⚠️ Risk Management Alert:
Major news releases? Step back.
Trailing stops? Lock it in.
Position sizing? Know your risk.
Trade like a professional robber, not a street pickpocket.
💥💖 SUPPORT THE ROBBERY PLAN 💖💥
🧨 Smash that BOOST button to support this trading style and help more traders rob the market clean. Every like, every boost makes this community stronger.
💬 Drop a comment, share your entry levels, or post your winning trades.
This is a trading crew – we rob together, we profit together.
🔔 Stay tuned — more heist plans dropping soon.
Until then... Rob Smart. Trade Hard. Take Profits. 💰💪🎯
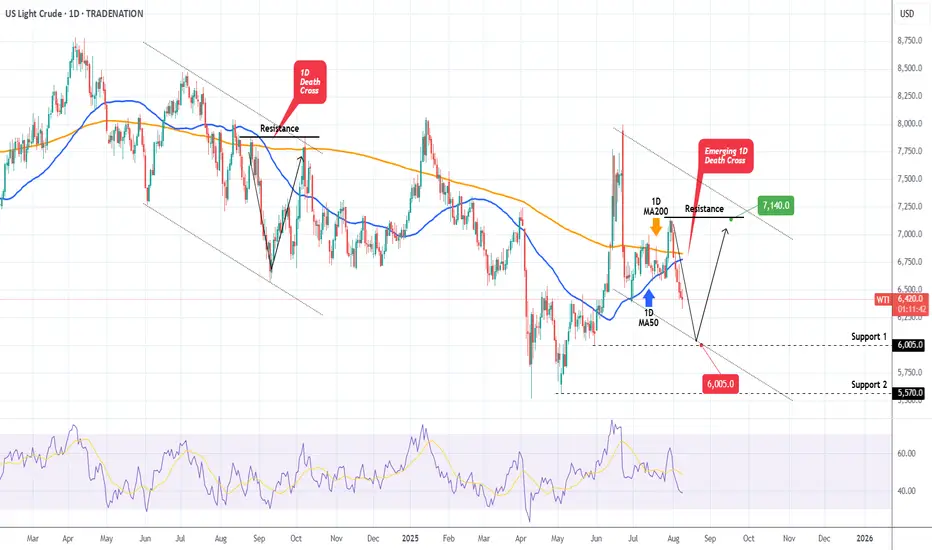
WTI OIL on its first 1D Death Cross since Sep 2024!WTI Oil (USOIL) is on the decline and is about to form a 1D Death Cross for the first time since September 06 2024! That is technically a bearish signal but last time once completed, the market formed a bottom 2 days later.
As a result, we expect a max drop to Support 1 ($60.05) but then more likely a rebound back to the Resistance ($71.40), especially given the fact that the 1D RSI will almost get oversold (>30.00).
-------------------------------------------------------------------------------
** Please LIKE 👍, FOLLOW ✅, SHARE 🙌 and COMMENT ✍ if you enjoy this idea! Also share your ideas and charts in the comments section below! This is best way to keep it relevant, support us, keep the content here free and allow the idea to reach as many people as possible. **
-------------------------------------------------------------------------------
Disclosure: I am part of Trade Nation's Influencer program and receive a monthly fee for using their TradingView charts in my analysis.
💸💸💸💸💸💸
👇 👇 👇 👇 👇 👇
OUR TRADE FOR THE DAYEarly today, I posted that we'll be waiting for the market to give us an entry after grabbing the liquidity, we did have it and caught it.
I didn't share it since it was given to my students.
As you can see on the chart, the market gave us a FVG after that it did grab the liquidity which we entered based on to target again the LQ level to close with a good margin.
Follow for more!
RBOB from $2.08 to $1.23Crude is in a downtrend and therefore so is RBOB and any other crude products. "Drill baby drill" as he says :/
Good luck!

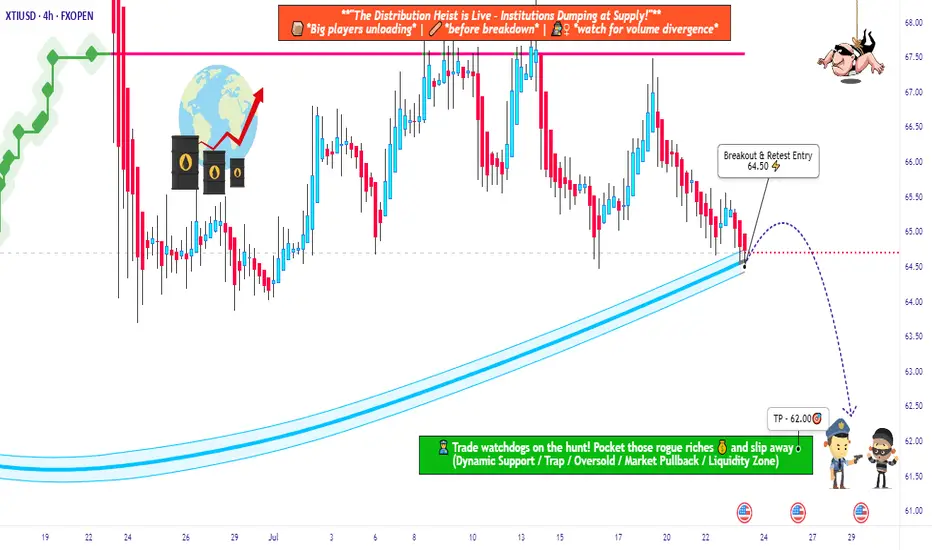
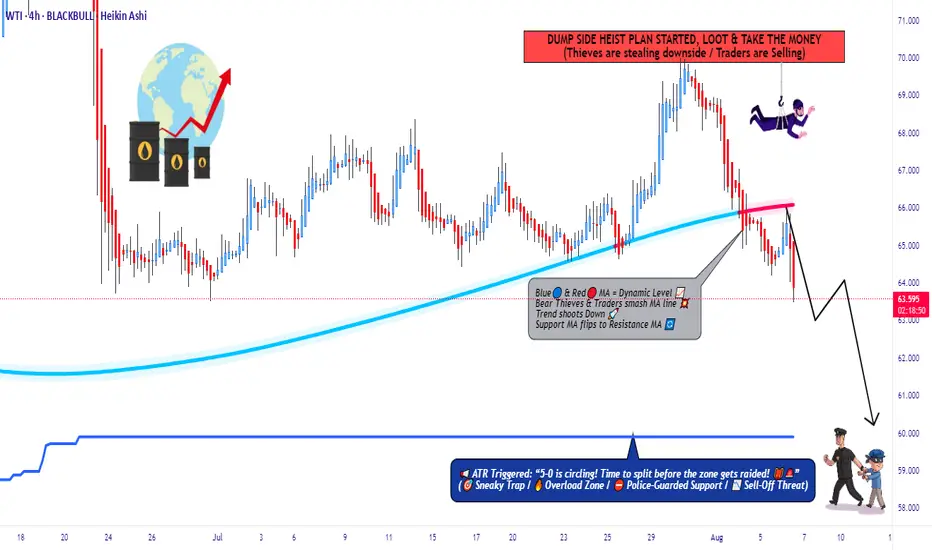
WTI Under Attack – Rob the Market with This Bear Setup🛢️💣 WTI Oil Short Raid: Bearish Heist Activated! 💣🛢️
📉 Thief Trader’s Limit-Layered Attack Plan 🔐
💥 Attention Market Robbers & Chart Breakers! 💥
We're about to break into the XTIUSD / US Oil Spot vault — Bearish style.
🚨 The Setup:
This ain’t your average breakout — we’re talking high-precision, multi-layered entries on a downside raid.
🧠 Thief Trader Strategy: Drop limit orders at key zones like trip wires. Let price walk into your trap.
🎯 Plan:
🧱 Entry: Any level after MA resistance confirmation.
Layer multiple limit orders — DCA-style — after trend shows weakness.
🛑 Stop Loss: 66.300 🔒
Protect your vault. Place SL just above major 4H rejection zone.
🎯 Target: 60.000 💰
Profit at exhaustion level. This is where bulls cry, and we cash out.
🧠 Robbery Logic Backed By:
COT Data 📊
Crude Oil Inventories 🛢️
Macro + Sentiment Flows 🌐
Technical MA Break + Retest Patterns 🎯
🔥 Why this isn’t a random short?
Because thieves do research — not guesswork.
Bulls have overextended. Oil’s price is reacting to strong supply pressure and weakening demand outlook.
⚠️ Risk Note:
No entry without trend confirmation.
No blind shots — place alerts and wait for the setup.
This is a sniper job, not a shotgun spray.
💬 Join the Robbery Crew
Smash that ❤️ & Boost if you're riding with the thieves!
Drop your charts, entries, or sniper shots in the comments 💬
We rob together. We win together.
🔔 Follow for more heist plans – next market break-in coming soon.
💰 Rob Smart. Trade Sharp. Exit Clean. 🏴☠️
TRADE CANCELEDThis morning I posted to take a long trade and we canceled it since the price didn't come to our entry point which is a normal thing to happen, now after that it took the daily LQ, we'll be waiting for the price to give us a sort entry to take.
Follow for more!
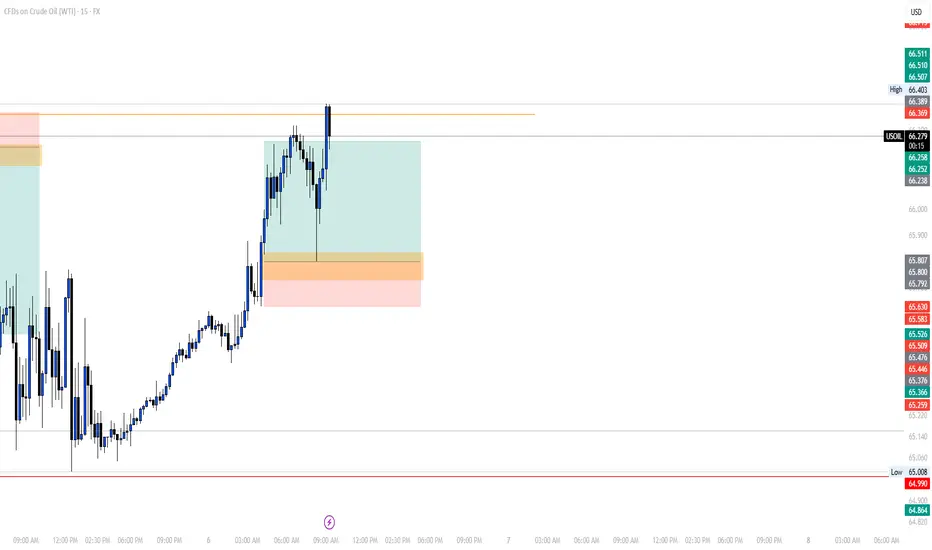
BUY USOILI'm sharing with you our trade today on OIL.
The reason we're buying is because yesterday the market grabbed the LQ now it is reversing to climb higher to fill all of the FVG we got in the previous movement.
For a safe entry, wait for the price to come back to our entry poin at 65.800 since I myself am waiting for the price to come to our entry point.
Follow for more!

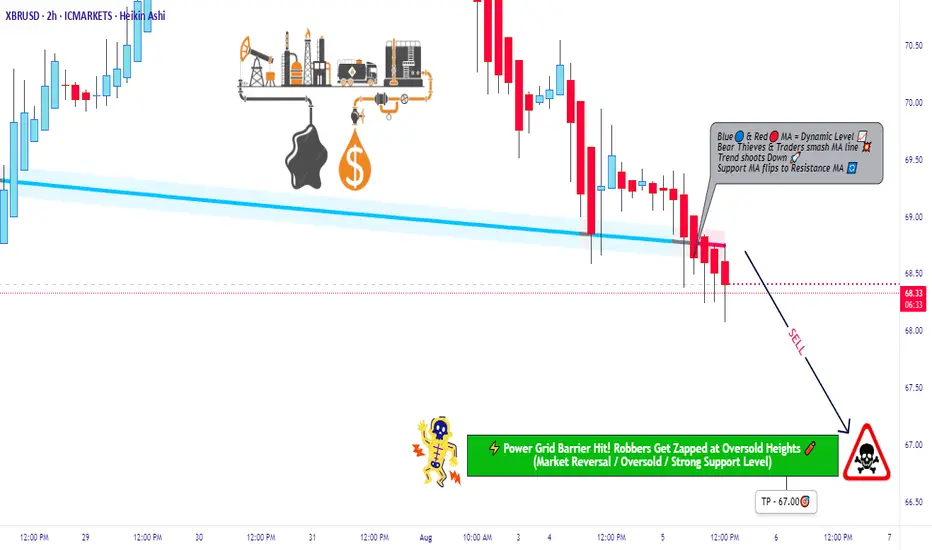
XBRUSD Robbery Setup: Thief's Bear Trap is Active! 🔥💰BRENT BEARISH HEIST PLAN💰🔥
🎯 Asset: XBRUSD / UK Oil Spot / BRENT
🧠 Strategy: Layered Limit Orders | Bearish Robbery in Progress
💼💣💼
Yo Money Movers & Market Jackers!
It’s time to load up the truck and roll out — the BRENT vault is cracked open and dripping with bearish loot! 🐻💵🔓
🎩 This isn’t just trading — this is Thief Trading Style™.
We don’t chase candles. We layer the loot, wait in the shadows, and strike on the pullback. No mercy. Just money. 💸🕶️
🚨 THIEF'S TRADE SETUP 🚨
🕵️ Entry Point:
Any Price Level – we’re everywhere.
Place layered Sell Limits like tripwires on the chart 🎯💣 — 15m or 30m candle nearest swing highs. The trap is set.
🛑 Stop Loss:
🔒 Locked @ 69.50 — right above resistance
This is a tactical retreat, not a failure. Every heist needs an escape route. 📉🔁
🎯 Target Zone:
💥 Aim for 67.00 — smash and grab style.
Get in, take profit, disappear into the shadows.
🧠 WHY THE HEIST?
The BRENT market looks ready for a rug pull —
🧊 Demand slowing
📉 Bearish structure unfolding
🎭 Bull traps getting exposed
🔥 Perfect time for thieves to cash out while the herd dreams green
Before pulling the trigger, check:
📰 Fundamentals 📦 Inventory Data 🧭 Intermarket Analysis 📊 COT Reports
Do your homework — then rob it like a professional. 🧠💼🔎
⚠️ MISSION WARNING ⚠️
Avoid new trades during news drops!
Use trailing SLs to protect loot. This market doesn’t play fair — but we don’t either. 🛑📰📉
💥 Hit BOOST if you're riding with the robbers!
Let’s show this market how Thief Traders steal gains like legends.
Every like = one more gold bar in the van 💰🚚💨
Stay sharp. Stay shadowed.
See you on the next job. 🐱👤💸📉
🔗 #Brent #XBRUSD #UKOil #ThiefTrader #BearishSetup #EnergyMarket #LayeringStrategy #MarketRobbery #SellThePump #RobTheChart
SELL USOILI'm sharing with you our trade for this morning on OIL, which we caught based on a reversal and the 2:25am (NY Time) FVG.
Follow for more!

UPDATEOn our 2nd trade of the day we closed before the price reaches our main target.
As y'all can see on the chart, the price couldn't break our 4:30am FVG, so as soon as it came back off it we immediately closed our position with a RR of 1:2
See you tomorrow!
