GH Reached its #ChartPattern #PriceTarget #AscendingTriangle I posed about this trade forming on August 9th link below. GH reached its ascending triangle price target.
Classicalcharting

BEAT #FailedBreakout #HeadandShouldersI've posted twice about H&S forming. Nothing is certain in trading. Example of a failed breakdown. Always have a strategy around your exits and trade management. Identifying the chart pattern is the easy part, the hard part is managing your trades after you enter them.

QSR 3 Month #SymmetricalTriangle #ChartPatternQSR been consolidating its gains after its run up from covid19 bottom. Stock is forming 3+ months ascending triangle and seems ready to begin its next move. Symmetrical triangles (unlike Ascending and Descending triangles) could end up becoming a trend reversal or continuation patterns depending on the direction they breakout into. the 200 MA is smack in the middle of the pattern which makes it even harder to assume a breakout one way or another. Best route as of right now is to leave bias at the door and wait for a decisive daily close outside chart pattern boundaries for direction confirmation.

CEIX Forming 2 Month #Rectangle #ChartPatternA daily close below $4.90 will complete the chart pattern and set the stage to a possible next leg lower.

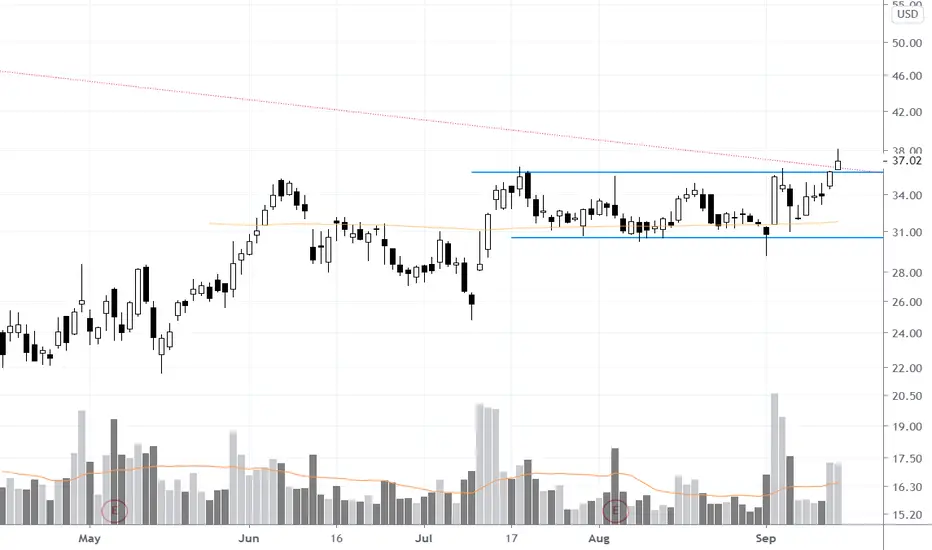
INMD Entering #Breakout #ModePosted about this setting up on September 12th and listed 3 reason why this is a nice looking setup. Rectangle range is pretty tight so target around $45.
see the post here
WEC 3 Month #CupandHandle #Breaktout #ChartPatternWEC entering breakout mode closing above $96 last week. The stock could start its run against its all time highs around $105-$107.

NG Reached its #Rectanlge #ChartPattern #PriceTargetI was shaken out on Sept 11th (w/profits) on that big red bar only for the stock to turn around & reach target.
EMN 3 Month #Rectangle #ChartPatternWatch EMN next week. The stock held up extremely well with the broad market selling off. Higher prices might be in the works next week.

#FICO #Breakout Alert from 2 months #rectangle #ChartPatternNYSE:FICO had 2 daily closes above its ALL time highs showing signs it wants to breakout of its 2 months rectangle consolidation chart pattern.
Keep it Simple!

#CWST setting up a massive #CupandHandle #Breakout #ChartPatternNASDAQ:CWST is forming a 5 and a half months Cup and Handle chart patter on weekly scale. A decisive daily close above pattern horizontal resistance will set the stage to a sizable rally and into All time High (ATH) territory.
#KeepItSimple

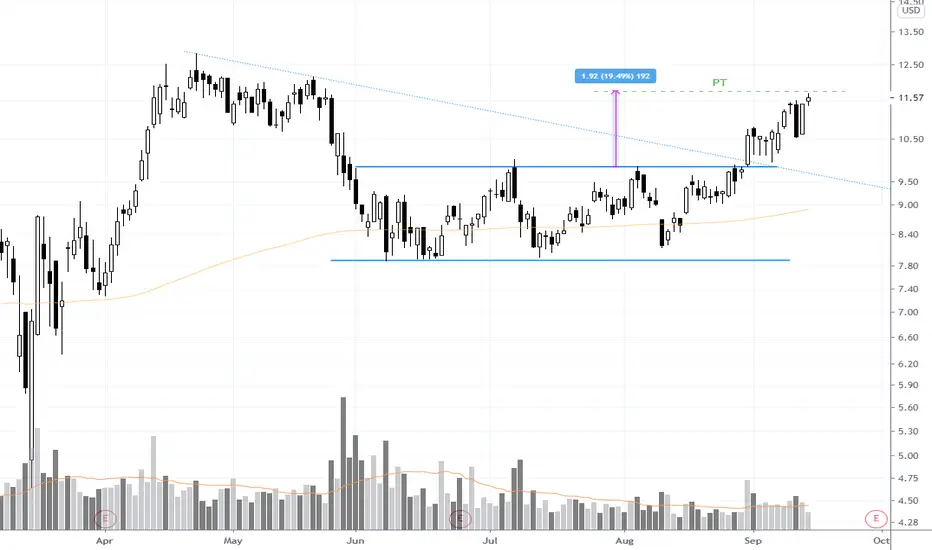
$REAL #Breakout Just got REAL :)and there goes REAL. Breaking out of its 3+ months rectangle chart pattern. Rectangle chart pattern price target added to the chart. i have alerted to this stock twice before. here is the latest chart i posted right before the breakout explaining why this setup is very promising and high probability trade.
$ACCO Forming 3+ month #Ascending #Triangle #ChartPatternIt doesn't get any better than this. 3 plus months of consolidation with a clear chart pattern horizontal resistance line. Stock held up pretty good in today's market reversal and sell off. Get this on you watch list.

INMD 2 Month #Rectangle #ChartPattern (3 reasons to like it)3 reasons to like this rectangle breakout chart pattern. A daily close above $36.75 will:
1) Confirm breakout above 200 MA
2) Clear 2 month consolidation chart pattern
3) Clear weekly down sloping trend line (red dotted line on chart)

ETR 5 Month #Rectangle #ChartPatternA 5 months consolidation pattern (low volatility period) will ultimately lead to a trend.

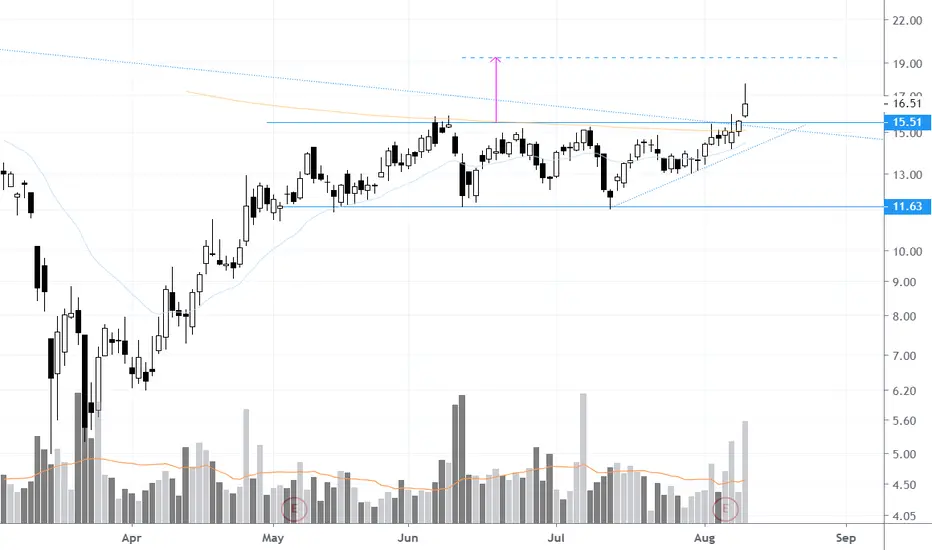
RYAM Entering #Breakout ModeRYAM showing relative strength with buying pressure the last 3 days and breakout from 3 month ascending triangle chart pattern today. Price target up around $5 and identified on the chart.

HUM #Breakout alert and ATH CloseNYSE:HUM completed its rectangle consolidation pattern today with the breakout and close at ATH. Swing target added to the chart. I alerted to this pattern here

#GLD 1 Month #DescendingTriangle #Gold #ChartPatternDescending triangle is bearish in nature. A confirmed breakout (daily close below chart pattern support) could start the next correction phase for gold and take it down to $170/$169 area. I would also be playing the failed chart pattern (close above triangle down sloping line) for a run back to bull market high.

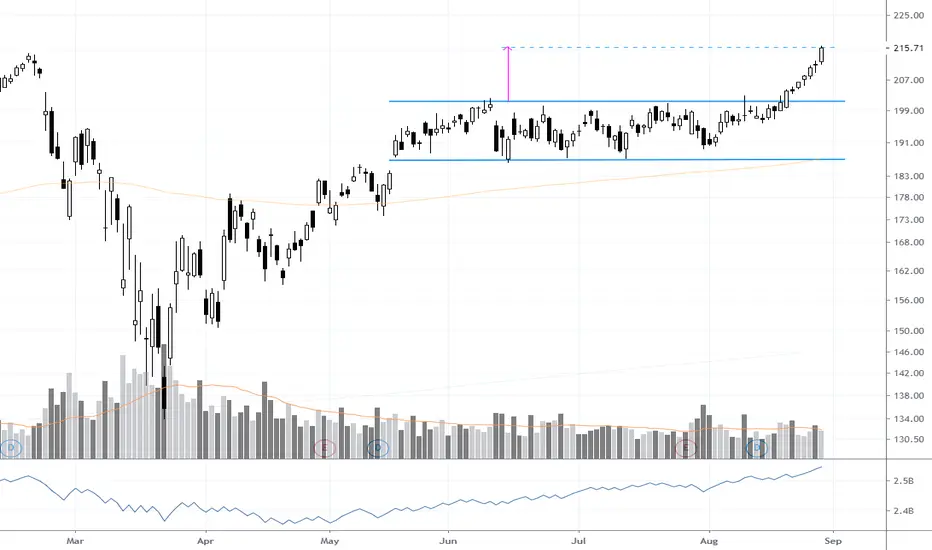
Visa Reached its #ChartPattern #PriceTargetI posted about the rectangle setup back on July 27th when it was forming. Today, Visa hit its #rectangle price target.
here is the post from 07/27
Pulling back to #Breakout #Support in a form of a #FlagPossible long play with flag breakout and test of August high.

1 Month #Flag & Pullback to #Breakout #SupportLooking for a potential flag breakout and a run back to March and July highs.

AUDPLN 4 month #rectangle #ChartPatternBeen consolidating for 4 months forming a rectangle chart pattern. A daily close above rectangle resistance would set the stage for the next leg up.

DLNG 2+ Month #Rectangle #Flag #ChartPatternDLNG has formed a 2+ month rectangle flag pullback setup after a strong rally from April low. A daily close outside of the bullish flag should set the stage to the next leg up.

Possible 5 Month Continuation #HeadandShoulder FormationWorking on possible right shoulder. Interesting chart to watch how it unfolds in the next few days. A flag breakout could set the stage to test pattern neckline with a possible breakout thereafter.
