Sharing my personal 1H outlook for EURUSD
🧠 What's Happening:
Price has been pulling back from the top near 1.173, and now it’s entering a critical Fibonacci reversal zone.
We’re currently sitting just under the 0.5–0.618 fib zone — my key area for a potential bullish reversal.
📌 Reversal Zone:
🔹 1.1589 (0.5 level)
🔹 1.1566 (0.618 level / Deep Zone start)
I’m watching this zone closely for bullish reaction signs (like structure shift, major breakout).
Cleartradingmind

Rejected Hard from 112K | BTC Headed for 105K and Beyond!?
Hey all, just sharing my short-term bias and levels I’m watching for BTCUSD based on price action and RSI clues.
Price got a clean rejection from the 112k supply zone, and now it’s sliding down with momentum. That orange box acted as a solid wall — no surprise there.
After that drop, price is hovering around 107.5k, but I don’t expect this to hold for long without some bullish fuel (which I don’t see right now).
📉 My Plan:
I’m looking for two key levels to the downside:
🥇 Expect 1: 105025 – This is my first target. I think we’ll see a short bounce from here, maybe a fakeout or trap move before further fall.
🥈 Expect 2: 102286 – If price closes below 105k and fails to reclaim it quickly, then I’m confident this level will be tested next.
I might look to enter short again if we bounce to 108.5–109.5k zone and start showing weakness (wick rejections, lower highs, RSI divergence, etc.).

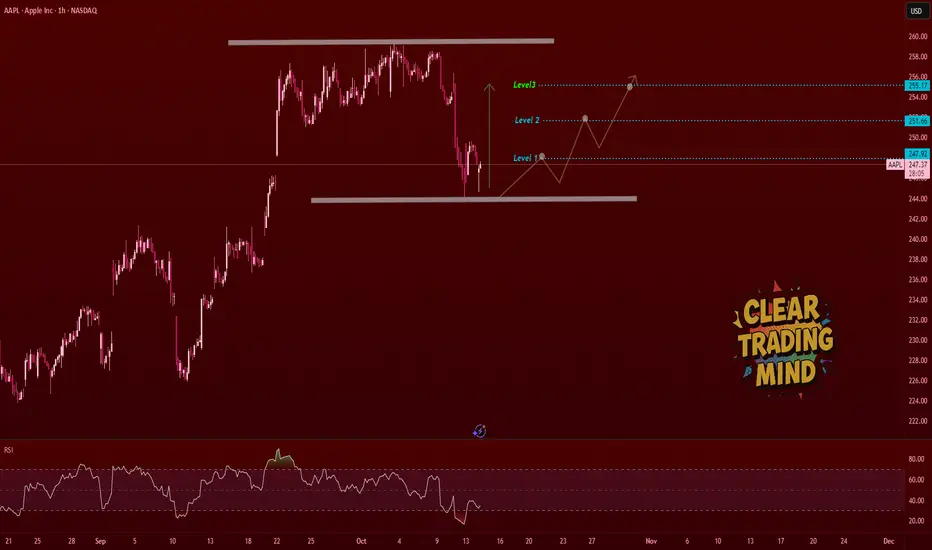
AAPL Bullish Outlook – Level-by-Level Breakout PlayApple is showing a potential bottom structure after rejecting the demand zone at the lower range.
Price bounced from the base and looks ready for a step-by-step move upward.
🔍 My Bullish Plan (1H Chart):
- As long as price holds the bottom range, I expect a recovery move.
- Watching price break each resistance step clearly:
🟢 Level 1 → 247.92
🟢 Level 2 → 251.66
🟢 Level 3 → 255.17
Once Level 1 breaks with strong momentum, I will look for intraday HL (higher low) or consolidation for continuation.
This zone looks good for scaling into bullish structure .
💡 Support Zone:
Marked demand base around 244.50 – strong previous reaction area.
⚠️ Invalidation:
If price fails to hold the demand zone and closes below the base, I’ll cancel the bullish bias.
🧠 Outlook Summary:
- RSI showing slight divergence hinting reversal strength
- Price at range low
- Multiple clean upside levels to work with
- Patience for breakout confirmation = key
CADJPY Bounce Plan – Dual Target SetupPrice is now reacting near the 108.144 entry zone, just above strong support at 107.545.
If this zone holds, I’m expecting a bullish move to trigger toward the upside targets.
🎯 Targets in Focus:
📌 Expect 1: 109.010
📌 Expect 2: 109.721
If price breaks above 109.010 and forms a base, I’ll look for a second leg toward 109.721.
- Entry Level: 108.144
- Support Zone: 107.545 (key invalidation area)
- Confirmation: Bullish candle or structure shift around 108.10 zone
Watching RSI and reaction at current level for early confirmation.

EURAUD Reversal Play – Eyes on 1.7860Price has dropped sharply and is now showing signs of a possible reversal from the support base.
Current structure hints that buyers might step in, pushing price toward the Q1 resistance zone around 1.78602.
If momentum continues, we could see a clean breakout move aiming the upper liquidity zone near 1.7905.
However, a break below 1.77483 will invalidate the setup, so I’ll keep my stop below that level.
🎯 Target: 1.78602
🛑 Stop Loss: Below 1.77483
⚡ Bias: Short-term bullish retracement

USDCHF Breakdown – Eyes on 0.7920Price couldn’t hold inside the rising structure and has broken below the trendline. That confirms sellers are taking control again. The rejection from the supply area above (0.8000 zone) added more weight to this bearish setup.
👉 My expectation is for price to drop toward 0.79200 – that’s the level I’ve marked on the chart.
This aligns with the 1.618 fib extension and sits just before deeper liquidity levels.
⚡ For me, this is a clean short opportunity as long as price stays below the broken support line.
If bulls want to reverse, they need to close back above 0.7980. Until then, I’ll stay with the bearish side.
Plan:
- Targeting 0.7920.
- If price reaches there, I’ll check for reaction (possible bounce or
continuation).
- No long entries for now – only watching sellers.
Patience is the key again here, waiting for price to complete the move into my expected zone.

USDCAD Pullback SetupPrice is now moving into the FVG + VWAP upper resistance band.
This area looks heavy, and I’m expecting sellers to step in.
📉 My expectation → a pullback move down towards 1.37538.
Watching how price reacts from this zone will give more confirmation.

GBPCHF Bullish Expectation – Heading to 1.0938This time I’m looking for a long opportunity in GBPCHF. After many days of sideways ranging, the price strongly reacted from the FVG demand zone (around 1.0799) and broke above the 0.786 retracement level (1.0845).
I’m expecting buyers to keep control here, and my target is around 1.0938 which also matches the 2.0 Fibonacci extension. If momentum continues, price may even push up to 1.0950.
Still, if there’s any pullback, I’ll be watching the FVG zone again (1.0799 – 1.0815) for another bounce. As long as price holds above that area, my bullish view remains valid.
📈 Expectation: Upside move to 1.0938

USDCHF – Ranging Phase but Looking BullishThis time I am looking for a long buy in USDCHF.
The market was ranging for many days, but now I expect a bullish move from the lower zone. Price is trying to hold above the 200 MA and pushing higher.
From this point, my target is based on the Fibonacci extension levels:
- First target is around 0.8126
If buyers continue with strength, this level looks achievable in the next move. For me, this is a good setup to follow the bullish side after the range.

Second Chance Setup – AUDUSD Bears Ready to Smash Supports
Last time, AUDUSD didn’t push lower as expected, instead making a false breakout / FVG sweep that trapped early sellers. But now, price action has given us a much stronger bearish confirmation.
On the 1H chart:
- A Head and Shoulders pattern has formed, signaling distribution.
- Price rejected from the FVG zone and failed to hold above the 200 EMA.
- The neckline has been retested , showing commitment from sellers.
This second chance setup looks more convincing than the first because momentum is clearly shifting toward the downside. My expectation is now for AUDUSD to extend lower toward 0.6456 , with further downside targets at 0.6422 and potentially deeper if sellers remain strong.
📉 Bias – Strong Bearish
📍 Key Resistance – FVG zone & neckline area
🎯 Target Levels – 0.6456 → 0.6422 → 0.6400

AUDUSD – Bearish Push Toward 0.6456 After FVG Rejection On the 1H chart, AUDUSD recently retraced into the Fair Value Gap (FVG) but failed to hold above, showing sellers stepping back in. The break below the 200 EMA combined with a clean trendline break adds more weight to the bearish sentiment.
With momentum shifting downward, my expectation is for price to drop toward the 1.618 Fib extension at 0.6456. If selling pressure remains strong, deeper targets at 0.6450 (Fib 2.0) and 0.6444 (Fib 2.272) could be in play.
📉 Bias – Bearish
📍 Key Resistance – FVG zone & 200 EMA
🎯 Target Levels – 0.6456 → 0.6450 → 0.6444

XAUUSD – Bears Eye 3316 as 200 MA CracksOn the 1H chart, Gold (XAUUSD) just confirmed a break below the 200 EMA, signaling a potential momentum shift in favor of sellers. Price previously retraced into the Fair Value Gap (FVG) and failed to sustain above, which adds to the bearish sentiment.
With the rejection from the FVG and fib-based projections, my expectation is for price to push down towards the 1.618 Fib extension at 3316.50. If bearish momentum remains strong, further downside levels could be in sight at 3299 (Fib 2.0) and 3281 (Fib 2.272).
📉 Bias – Bearish
📍 Key Resistance – FVG zone
🎯 Target Levels – 3316.50 → 3299 → 3281

Bulls Fooled by CPI? EURUSD Bears Back in Control!In my previous outlook, I expected EURUSD to drop right after the CPI release. However, the numbers came out slightly USD-negative, giving bulls a small boost:
- CPI Data (Actual vs Forecast):
- Core CPI m/m: 0.3% vs 0.3% (Neutral)
- CPI m/m: 0.2% vs 0.2% (Neutral)
- CPI y/y: 2.7% vs 2.8% (Mildly bearish USD)
The difference in CPI y/y is small, so the impact was mild, not strong enough to flip the overall trend but enough to create a temporary upward move and stop out the first short attempt.
Current Technical View
Now, price has tapped into the 1hr Fair Value Gap (FVG) and faced rejection. It’s also breaking lower from the 0.5–0.618 Fibonacci retracement area, suggesting sellers are stepping back in.
Bearish Factors:
1. FVG rejection confirms supply zone pressure.
2. Price now below EMA, showing momentum shift.
3. Higher timeframe structure still in a lower-high, lower-low trend.
4. CPI reaction was mild, so fundamentals don’t override the bearish technical setup.
My Bearish Targets This Time
A)- First target: 1.1540 (major support & fib extension area)
B)- Second target: 1.1475 (previous swing low & deeper extension)
This is my second, more technical attempt to catch the continuation of the downtrend after the CPI-induced spike. If 1.1540 breaks, I expect momentum to carry towards 1.1475.

EURJPY – Bearish Break Targets 170.55 & 169.96On the 1H chart, EURJPY has broken below both the trendline support and the 200 EMA, signaling a clear shift in market sentiment toward the bears. The recent drop confirms sellers are in control after price failed to sustain near the FVG zone.
Fib extensions suggest the next downside targets are 170.55 (1.618 Fib) and 169.96 (Fib 2.0). A clean break below these could accelerate momentum toward deeper lows.
📉 Bias – Bearish
📍 Key Resistance – 200 EMA & 172.62 zone
🎯 Target Levels – 170.55 → 169.96

EURUSD – Eyes on the Supply Zone Before the Big DropRight now, I see EURUSD gearing up for a bigger fall. The recent price rejection and break below key fib levels hint at strong bearish pressure. My expectation is for the price to head toward the highlighted Supply Zone around 1.1553.
If the market respects this zone, we could see a short-term bounce. But if price breaks and closes below it, I’m looking for a bearish continuation toward deeper levels near 1.1518 and possibly 1.1494.
The EMA is also above current price action, adding extra weight to the bearish bias. For me, this setup signals a “stay short until proven otherwise” approach.
📉 Bias – Bearish towards the Supply Zone
📍 Key Break Point – 1.1553 zone
🎯 Next Targets if broken – 1.1518 / 1.1494

EURNZD – Double Top + 200 EMA Break… Is the Fall Coming?I think this pair has more chance to go down because a clear Double Top pattern has been formed exactly at a supply zone. After that, price has broken below the 200 EMA, showing weakness in the recent bullish move.
From here, I’m looking at the possibility of a bearish continuation. My expectation is for price to drop towards the 1.94600 area, which aligns with the Fibonacci extension target.
This is just my personal view based on the pattern and 200 EMA break — let’s see how the market reacts in the coming sessions.

From Demand to Glory: Nifty’s Bullish March to 25,220 Nifty Bullish Outlook
-Current Price: 24,905 (approx)
- Key Demand Zone: 24,620 – 24,660
- Key Supply Zone: 25,200 – 25,240
Technical View
- Strong Demand Bounce: Nifty reversed sharply from the demand zone (24,620–24,660),
indicating strong buying interest.
- Trend Breakout Potential: Price is approaching resistance near 24,920; a breakout could push
towards the supply zone at 25,220 (target).
- Momentum Structure: Higher lows formed after the demand zone test, showing bullish
strength.
News & Data Supporting Bullish Bias
- India’s Q1 GDP Growth: The latest estimates show strong economic growth, supporting equity
market sentiment.
- FIIs Turning Buyers: Foreign Institutional Investors (FIIs) have been net buyers over the past
few sessions, supporting index upside.
- Global Market Tone: US and Asian equities are stable, and crude oil prices are moderating,
supporting risk appetite.
- RBI Policy Outlook: Market expects no immediate rate hikes, keeping liquidity positive for
equities.
Expectation
If Nifty sustains above 24,900, we expect a bullish move towards 25,220 in the short term.
Stop-loss: Below 24,780 (to manage risk).

BTCUSD Turning Bearish – Eye on 115,200 Target- The price is approaching a supply zone near 119,450 – 120,000, where previous selling pressure
existed.
- Structure shows a potential lower high formation, signaling bearish momentum could continue.
- Risk-to-reward ratio looks favorable if entry triggers at 119,450 and target is 115,200.
- Confirmation with bearish candle rejection at the supply zone is recommended before
entering.
This is a sell setup aiming for a 420–450 pips move. Wait for price action confirmation near 119,450. If rejected, short positions may target 115,200.

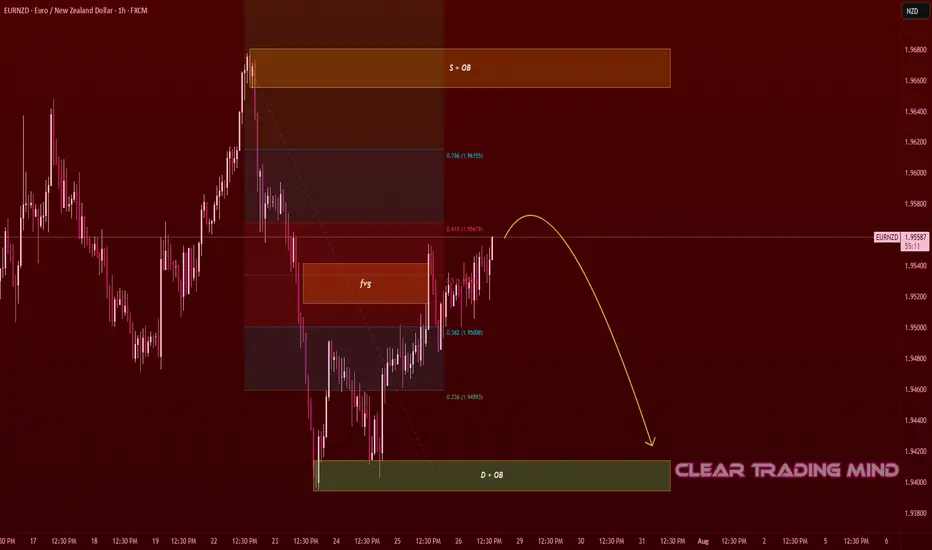
EURNZD Supply Test – Short Setup to DemandOn the 1-hour chart, EURNZD is approaching the 0.618 Fib retracement level and testing a Fair Value Gap (FVG) 🟧 after a strong bearish move.
- Supply + OB zone above 1.96600 is acting as resistance
- Demand + OB zone near 1.94000 is the target area
Plan:
- Expecting a rejection from current levels (1.95500 – 1.95700) or from the upper supply zone
🎯 Target: Demand Zone near 1.94200 – 1.94000 (≈ 150 pips potential move)
🛡 Invalidation: Clean breakout and hold above 1.96600 supply zone
Reasoning:
- Market structure remains bearish after the recent drop
- Supply zone + FVG + Fib retracement creates a strong confluence for rejection
- Looking for confirmation before short entry
(Not financial advice – just a personal market observation)
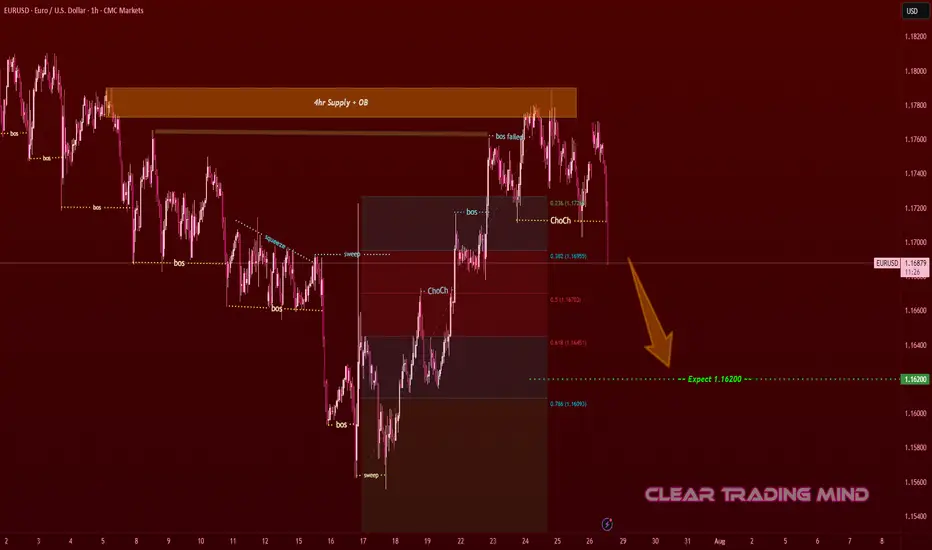
EURUSD Supply Rejection – Bearish Move ExpectedOn the 1-hour chart, EURUSD tapped into the 4hr Supply + OB zone 🟧 and failed to hold above previous structure.
- BoS (Break of Structure) shows weakness at highs
- ChoCh (Change of Character) confirms bearish shift
- Price rejected from 0.236 Fib level (1.17400) and is moving lower
Plan:
- Expecting price to move toward 1.16200 (≈ 120 pips from current level) 🎯
- Bearish momentum remains valid as long as price stays below supply zone
- Confirmation candles & retests strengthen short bias
Reasoning:
- Supply zone rejection + failed breakout
- Clear structure shift (ChoCh) toward lower lows
- Fib retracement confluence (0.5 – 0.618 zone) aligning with sell pressure
(Not financial advice – only a personal observation)
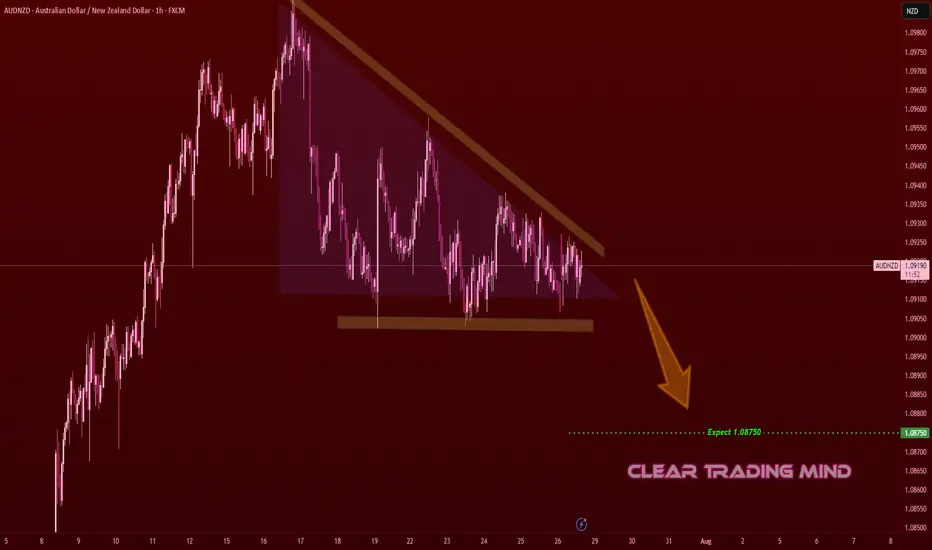
AUDNZD Descending Triangle – Bearish Breakout SetupOn the 1-hour chart, AUDNZD is forming a descending triangle 📐, a bearish continuation pattern.
- Horizontal support is holding but getting repeatedly tested
- Lower highs indicate selling pressure
Plan:
- Break and close below support may trigger a bearish continuation
- Target: 1.08750 🎯 (≈ 35 pips from current price)
- Invalidation if price breaks above descending trendline and holds
Reasoning:
- Descending triangle often leads to breakdowns when tested multiple times
- Lower highs show sellers gaining control
- Short bias remains as long as price respects the triangle resistance
(Personal chart study, not financial advice)
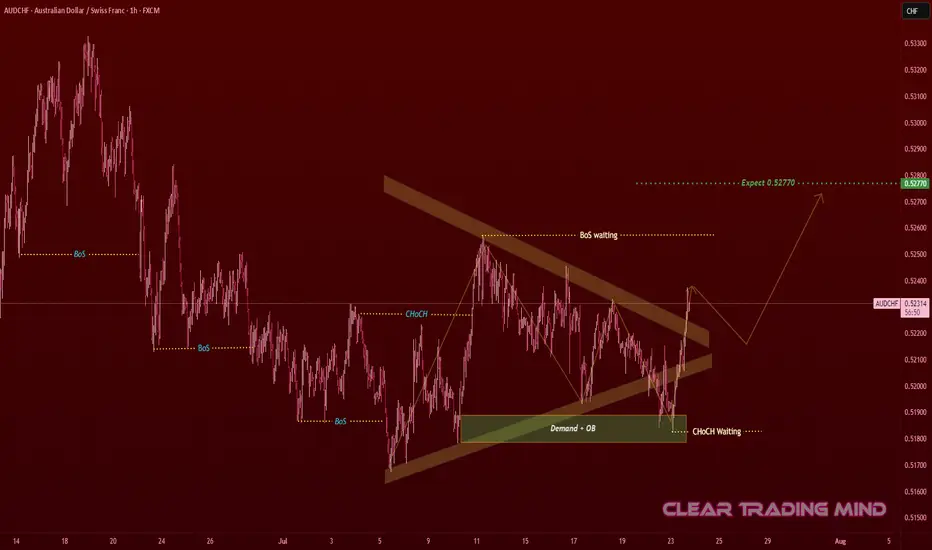
AUDCHF Contracting Triangle – Waiting for Breakout Confirmation
AUDCHF on the 1-hour chart is forming a contracting triangle 🔺, showing consolidation after a downtrend.
From an SMC perspective:
🟩 Demand + OB (Order Block) zone holding strong near 0.51900
🔄 Previous CHoCH shows buyer interest
⏳ Waiting for BoS (Break of Structure) confirmation above the triangle
Plan:
* Breakout Entry: Above 0.52400 after retest 🔓
🎯 First Target: 0.52770 – 0.52800 (≈ 37 pips from breakout)
🛡 Invalidation: Below 0.51900 (demand failure)
Reasoning:
+ Contracting triangles often lead to strong impulsive moves ⚡
+ Buyers are already active at demand 🔥
+ Confirmation of CHoCH + BoS could push price to targets 🚀
// (Not financial advice – personal chart observation)
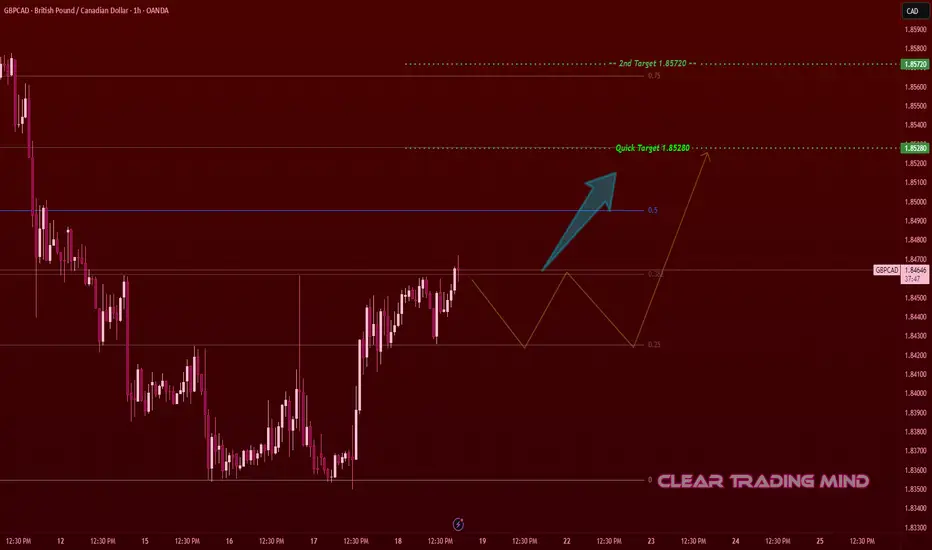
GBPCAD Showing Strength – Breakout Setup with Measured TargetsThis is my personal setup for GBPCAD on the 1-hour chart. After a strong downtrend, the price has started to form a bullish reversal pattern from the 1.83600 zone. I’m watching the current bullish structure which is showing good strength and higher lows.
🔹 Entry Idea:
I’m planning to enter above 1.84700, once price confirms a breakout and retest. This level also aligns with the 0.382 Fibonacci level.
🔹 Targets & PIPs:
🎯 First Target: 1.85280 (≈ 58 pips from entry)
🎯 Second Target: 1.85720 (≈ 102 pips from entry)
🔹 Reasoning:
- Price bounced from the 1.83600 support zone
- Forming bullish structure (higher highs & higher lows)
- Nearing Fibonacci midpoint resistance
- Increasing volume indicates potential buyers stepping in
This is my personal trade idea – not financial advice. Let’s see if price follows the plan!