SAP SE (SAP.de) bearish scenario:The technical figure Descending Triangle can be found in the German company SAP SE (SAP.de) at daily chart. SAP SE is a German multinational software corporation, that develops enterprise software to manage business operations and customer relations. The company is especially known for its ERP software. SAP is the largest non-American software company by revenue, the world's third-largest publicly-traded software company by revenue, and the largest German company by market capitalisation. The Descending Triangle has broken through the support line on 28/01/2022, if the price holds below this level you can have a possible bearish price movement with a forecast for the next 26 days towards 100.00 EUR. Your stop loss order according to experts should be placed at 125.32 EUR if you decide to enter this position.
SAP said on Thursday it has agreed to buy a majority stake in privately held U.S. fintech firm Taulia as the German business software group seeks to expand its presence in supply-chain financing and working capital management. SAP, said it was looking at opportunities in the ‘metaverse’ - virtual online worlds where people can work, play and socialize.
Risk Disclosure: Trading Foreign Exchange (Forex) and Contracts of Difference (CFD's) carries a high level of risk. By registering and signing up, any client affirms their understanding of their own personal accountability for all transactions performed within their account and recognizes the risks associated with trading on such markets and on such sites. Furthermore, one understands that the company carries zero influence over transactions, markets, and trading signals, therefore, cannot be held liable nor guarantee any profits or losses.
Cloud


SNOWFLAKE ($SNOW) longNote:
- NYSE:SNOW
- High Tight Flag
- Hot sector
- Chart setting up nicely
- EMAs coming together
- Fundamentals are great
Disclaimer and Info:
- No guarantee for the correctness of information or calculations
- No advice or investment advice
- Fiscal Year ends January 31.
- All numbers in '000 US dollars (1.234 = 1.23 million USD)
Company profile from TradingView:
Snowflake, Inc. provides cloud data warehousing software.
It provides SQL data warehouse, zero management, and broad ecosystem products.
It offers data warehouse modernization, accelerating analytics, enabling developers and monitoring and security analysis solutions to federal government, financial services, healthcare, media and entertainment, retail and CPG , gaming, education and technology industries.
The company was founded by Marcin Zukowski, Thierry Cruanes and Benoit Dageville in 2013 and is headquartered in Bozeman, MT.
Main sources for data:
- Investor Presentation 3Q Fiscal 2022
- Trading View
- Own calculations
Customers (customers >$1M):
FY2021Q3: 3,554 (65)
FY2021Q4: 4,139 (77)
FY2022Q1: 4,532 (104)
FY2022Q2: 4,990 (116)
FY2022Q3: 5,416 (148) --> YOY Growth: 52% all customers // 128 % customers >$1M
Net Revenue Retention (NRR):
Net Revenue Retention (NRR) also known as Net Dollar Retention (NDR) is an important SaaS metric. NRR is one of the most important key KPIs from the software and service industry. Ultimately, it measures how much of the previous year's turnover was lost through layoffs and how much Annual Recurring Revenue ( ARR ) was gained through account expansion of existing SaaS-customers. The net effect of lost sales (revenue churn) and additional sales from received customers (account expansion) is the Net Revenue Retention.
In order to calculate the NRR, you need at least two comparison periods for the company. Typically, one compares the ARR of the previous year with the current value of the Annual Recurring Revenue. If the additional expenses of the existing customers can more than compensate for the loss of sales through terminations, one speaks of net-negative revenue churn or positive net revenue retention, which then takes a value of over 100%.
Calculation of the Net Revenue Retention (NRR) or Net Dollar Retention (NDR): Expressed mathematically, the NRR or NDR is the percentage of sales in a previous period or base period that could be realized in the current period. This includes additional sales from existing customers, cost reductions for customers and terminations. The net revenue retention rate can also assume values below 100%, which means that the customer cohort of the previous year spent less on average in the current year.
The goal of most SaaS-companies is therefore a net dollar retention of over 100, which would mean that the additional sales of existing customers could overcompensate for losses due to terminations (account churn) and budget cuts (revenue churn). If the NRR is above 100, i.e. the customer cohorts are spending more and more money and new customers can be won at the same time, software companies can grow particularly dynamically.
FY2022Q1: 168%
FY2022Q2: 170%
FY2022Q3: 173%
Non-GAAP Product Gross Margin:
FY19: 58%
FY20: 63%
FY21: 69%
FY22: 74% (est.)
FY2021Q3: 70%
FY2021Q4: 70%
FY2022Q1: 72%
FY2022Q2: 74%
FY2022Q3: 75%
Rule of "40":
The "Rule of 40" ( aka . "Rule of Forty") is one of the simplest and most important SaaS and software metrics. This KPI was developed by the US-based software venture capital fund Bessemer Venture Partners.
It tries to relate the growth and profitability of a company. The revenue growth and the free cash flow margin (also (non-GAAP) operating margin or adjusted EBITDA margin) are added as a measure of profitability. If the sum of the two values results in a value greater than 40 , empirical data are used to assume that this is a very healthy company. The rule of 40 is particularly meaningful for software or subscription companies with high gross margins.
The background to the relationship is that a company that is growing rapidly but is still losing money can be just as attractive or even more attractive than a company that is profitable but only grows more slowly. In addition, companies can often actively decide whether they want to give up profitability in order to grow even faster or save marketing costs and instead accept slow growth but deliver more EBIT .
At the same time, a situation in which a company is neither profitable nor grows significantly faster than 20% can quickly become threatening. Often these companies do not achieve sufficient economies of scale and operating leverage to be profitable and sustainable in the long term.
Therefore, the following applies quite casually: Either grow quickly or make a profit! If both of these don't work, the company often find itself in a dead end.
FY2021Q3: 88%
FY2021Q4: 93%
FY2022Q1: 95%
FY2022Q2: 96%
FY2022Q3: 112%
Sales Efficiency (aka Magic Number):
The "Magic Number" is a KPI of the sales efficiency of SaaS and subscription companies. It goes back to the venture capital fund Bessemer Venture Partners, which specializes in SaaS companies in the US.
To calculate the Magic Number, the newly acquired Annual Recurring Revenue (ARR) is annualized and related to sales and marketing expenses.
Calculation: Specifically, you subtract the sales of the previous quarter from today's sales and multiply the difference by 4. Because the additional quarterly sales will accrue every year from now on, so it becomes ARR or annually recurring sales. This annualized turnover is now calculated from the marketing expenses of the previous period - because these have caused the increase in sales - and the result is a number that is usually between 0.5 and 2.
FY2021Q3: 1,14
FY2021Q4: 0,92
FY2022Q1: 1,00
FY2022Q2: 1,04
FY2022Q3: 1,36
If the magic number is below 0.5, there is probably no product market fit. No invest in marketing is needed.
If the magic number is between 0.5 and 0.75, you are probably spending the right amount in marketing and sales and the amount should rather be optimized operationally.
If the magic number is above 0.75 or even above 1, you should definitely try to spend even more money on acquisition, i.e. via marketing and sales.

CLOUDFLARE ($NET) longNote:
- NYSE:NET
- Reverse play of the last phase of extreme growth and consolidation
- Software companies have been depreciated comparatively strongly in the last consolidation
- Hot sector
- Chart setting up nicely (support around 127$)
- EMAs coming together
- Fundamentals are great
Disclaimer and Info:
- No guarantee for the correctness of information or calculations
- No advice or investment advice
- All numbers in '000 US dollars (1.234 = 1.23 million USD)
Company profile from Wikipedia:
Cloudflare, Inc. is an American web infrastructure and website security company that provides content delivery network and DDoS mitigation services.
Its services occur between a website's visitor and the Cloudflare customer's hosting provider, acting as a reverse proxy for websites.
Its headquarters are in San Francisco.
Main sources for data:
- Investor Presentation 30. Sep. 2021
- Trading View
- Own calculations
Customers (new customers):
FY2020Q3: 100.968
FY2020Q4: 111.183 (10.215)
FY2021Q1: 119.206 (8.023)
FY2021Q2: 126.735 (7.529)
FY2021Q3: 132.390 (5.655)
FY2021Q3: t.b.d.
Customers with >100k$ (new customers >100k$):
FY2020Q3: 736
FY2020Q4: 828 (92)
FY2021Q1: 945 (117)
FY2021Q2: 1.088 (143)
FY2021Q3: 1.260 (172)
FY2021Q3: t.b.d.
Non-GAAP Gross Margin (= Gross Profit / Revenue):
FY2018: 78%
FY2019: 78%
FY2020: 78%
FY2020Q3: 76,35%
FY2020Q4: 76,92%
FY2021Q1: 76,76%
FY2021Q2: 77,02%
FY2021Q3: 78,23%
FY2021Q4: t.b.d.
DBNER (Dollar-Based Net Expansion Rate):
DBNER (aka. Dollar-Based Net Expansion Rate) is one of the most important KPIs, especially for SaaS and other software companies.
The DBNER measures how much more sales (revenue) a certain cohort of customers (usually those from last year) has also spent in the current year.
Calculation of the DBNER: As a rule, the DBNER is calculated by dividing the sales of all customers who were still customers on the last day of a period (e.g. December 31, 2021) by the sales of the same customers in the previous period (base period, e.g. the year 2020). Important: The sales of customers who have canceled in the current period (2021) and new customers who were not customers in the base period (2020) are not considered.
If you want to measure the ability to retain and increase sales (revenue retention) including terminations, the NRR (aka. Net Revenue Retention) is a better indicator in this case.
What is a good DBNER? A DBNER of 112%, for example, would mean that a company's existing customers have spent an average of 12% more this year than in the previous year.
Often the DBNER is in the range of 105-130%. Values over 130% indicate a strong growth in spending within customer accounts.
The DBNER is important because the simultaneous acquisition of new customers and a growing willingness to pay among existing customers can ideally lead to exponential growth.
The so-called "Land and Expand" strategy, which tries to continuously increase sales of new customers, is essential for sustainable growth of software companies.
If the DBNER falls below 100%, that means customers spend less and less on the company's services. At best, the decline can be compensated with the acquisition of many new customers.
Ways to increase the DBNER are the sale of additional products, services and modules, the expansion of licenses to include new workstations and instances or the enforcement of volume or consumption-based business models.
FY2019Q1: 118%
FY2019Q2: 122%
FY2019Q3: 121%
FY2019Q4: 119%
FY2020Q1: 117%
FY2020Q2: 115%
FY2020Q3: 116%
FY2020Q4: 119%
FY2021Q1: 123%
FY2021Q2: 124%
FY2021Q3: 124%
FY2021Q4: t.b.d.
Rule of "40":
The "Rule of 40" ( aka . "Rule of Forty") is one of the simplest and most important SaaS and software metrics. This KPI was developed by the US-based software venture capital fund Bessemer Venture Partners.
It tries to relate the growth and profitability of a company. The revenue growth and the free cash flow margin (also (non-GAAP) operating margin or adjusted EBITDA margin) are added as a measure of profitability. If the sum of the two values results in a value greater than 40 , empirical data are used to assume that this is a very healthy company. The rule of 40 is particularly meaningful for software or subscription companies with high gross margins.
The background to the relationship is that a company that is growing rapidly but is still losing money can be just as attractive or even more attractive than a company that is profitable but only grows more slowly. In addition, companies can often actively decide whether they want to give up profitability in order to grow even faster or save marketing costs and instead accept slow growth but deliver more EBIT .
At the same time, a situation in which a company is neither profitable nor grows significantly faster than 20% can quickly become threatening. Often these companies do not achieve sufficient economies of scale and operating leverage to be profitable and sustainable in the long term.
Therefore, the following applies quite casually: Either grow quickly or make a profit! If both of these don't work, the company often find itself in a dead end.
FY2020Q3: 50,41%
FY2020Q4: 45,70%
FY2021Q1: 45,87%
FY2021Q2: 50,21%
FY2021Q3: 52,26%
FY2021Q4: t.b.d.
Sales Efficiency (aka Magic Number):
The "Magic Number" is a KPI of the sales efficiency of SaaS and subscription companies. It goes back to the venture capital fund Bessemer Venture Partners, which specializes in SaaS companies in the US.
To calculate the Magic Number, the newly acquired Annual Recurring Revenue (ARR) is annualized and related to sales and marketing expenses.
Calculation: Specifically, you subtract the sales of the previous quarter from today's sales and multiply the difference by 4. Because the additional quarterly sales will accrue every year from now on, so it becomes ARR or annually recurring sales. This annualized turnover is now calculated from the marketing expenses of the previous period - because these have caused the increase in sales - and the result is a number that is usually between 0.5 and 2.
FY2020Q3: 0,84
FY2020Q4: 0,76
FY2021Q1: 0,82
FY2021Q2: 1,05
FY2021Q3: t.b.d.
FY2021Q4: t.b.d.
If the magic number is below 0.5, there is probably no product market fit. No invest in marketing is needed.
If the magic number is between 0.5 and 0.75, you are probably spending the right amount in marketing and sales and the amount should rather be optimized operationally.
If the magic number is above 0.75 or even above 1, you should definitely try to spend even more money on acquisition, i.e. via marketing and sales.

Cloud This cloud is going on the earth.
Need correction before the departure to the Jupiter.
The cloud is the future.
TECH: The Next 10 YearsWeb 3.0 is the emerging paradigm of the Semantic web, where there is no central authority or gatekeeper. Whereas Web 2.0 was propelled by advances in social networking, mobile internet access, and cloud, Web 3.0 will be defined by advances in edge computing, decentralized data networks, blockchain, AR/VR and artificial intelligence. Web 3.0 is only just coming into picture. It will serve as an extension of many elements of Web 2.0, but will also create entirely new experiences and blue ocean opportunities.
For example, developers could combine parts of applications together or entire applications to customize how they experience and benefit from products and services.
Through the use of advanced AI, Web 3.0 search engines will offer personalized results based on individual preferences and needs. For example, if an IPA drinker and a Lager fan type ‘breweries near me’ in the search bar, they will receive different results for nearby breweries based on the type of beer brewed. Of course, this also means algorithms will know more about users.
More than 50 percent of data centers in the world are currently owned by Amazon, Google, and Microsoft. In Web 3.0, decentralized cloud networks and autonomous storage units will gain traction. Individuals will host and secure applications or ‘shards’, earning income that would otherwise go to large incumbents.
In Web 3.0, identity management will devolve back to individuals. People will control their digital assets and data, as well as access to them. Centralized and federated identity providers from Web 2.0 will fade into obscurity.
The ‘Metaverse’ will emerge, enabling people to participate and engage with a variety of 3D environments, including games, marketplaces, work spaces, socializing etc. The Metaverse will combine elements of AR/VR, blockchain/digital assets, semantic web and AI.
Whereas Webs 1.0 and 2.0 were cultivated, mass adopted, and financially exploited principally in a few technology hotspots -- US, Western Europe, and APAC, Web 3.0 will be global. We are entering a ‘New Digital World’ of borderless and frictionless transactions that will touch many aspects of life -- work, commerce, socializing, entertainment, etc. More and more people will have the opportunity to participate in this new world and benefit; geography and market access will no longer be major obstacles to success. The future is bright!

Software at 200sma + HorizontalIGV, a Software based ETF, is currently at the 200sma which has shown support before. It is also at horizontal support from February highs.
Trade setup is drawn in chart. The risk-reward-ratio is above 4.
Top 10 holdings
MSFT (10%)
CRM (9%)
ADBE (9%)
INTU (7%)
ORCL (6%)
NOW (5%)
ADSK (2%)
PANW (2%)
SNPS (2%)
WDAY (2%)
Good luck.

AVCT American Virtual Cloud Price Target !!!AVCtechnologies existing enterprise customers including IBM, AT&T, and Etisalat!
AVCtechnologies delivers a full suite of cloud-based Unified Communications as a Service (UCaaS) capabilities to its cloud customers through its carrier-grade Kandy Business Solutions including Cloud PBX, Smart Office UC Clients, Collaboration, Contact Center, and SIP Trunks.
Loop Capital Initiated Coverage on American Virtual Cloud Technologies, Inc. (AVCT) with a Buy rating and a price target of $17.00 !!!
52 Week Range 0.8400 - 9.6200
The price is now $1.46
Market Cap 99.221Mil

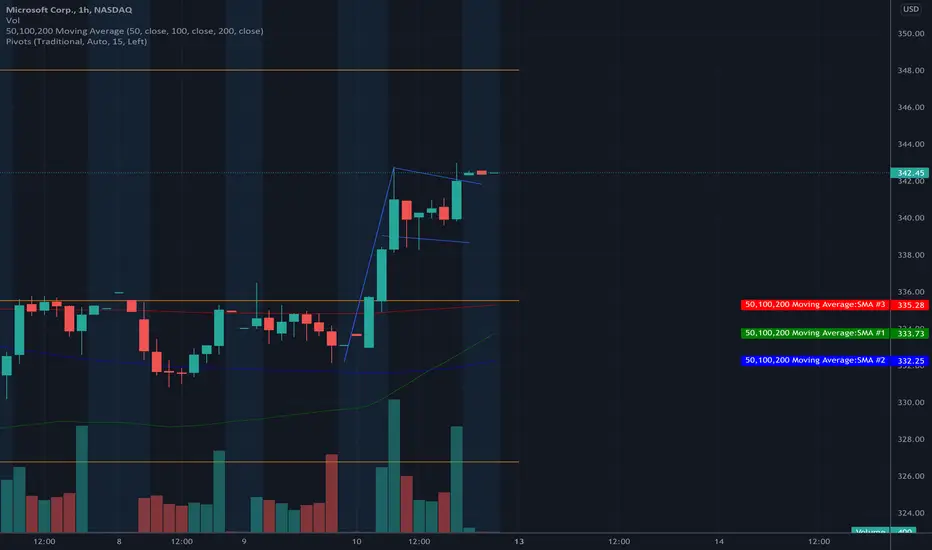
$MSFT | 12/13-12/17 | Watchlist #3 $MSFT +343
(Over 343 for calls)
Technical Analysis: Bull flag breakout on the hourly chart
News catalyst: Last week, Wedbush Securities named MSFT as one of its top tech picks for 2022.
Don't Give Up On BTTUSDUsing again the Cloud indicator,
extreme support can be seen building in the orange zone, with many touches at the bottom of this zone
this was a support even before the massive breakout, expect another breakout if it continues to hodl

$MIME: Email Security While Trust In Big Tech Wanes?As distrust in big tech continues with FB making new lows and cyber security stocks continue to reach out for new highs, the tech hangover from COVID looms large. Mimecast I believe will ultimately find themselves on the right side of technology trends in the future while the rest of the world figures out how invasive they want their online communications to be and how comfortable they are with companies hanging onto their data.

$MU sniper edition #4*This is not financial advice, so trade at your own risks*
*My team digs deep and finds stocks that are expected to perform well based off multiple confluences*
*Experienced traders understand the uphill battle in timing the market, so instead my team focuses mainly on risk management*
Recap: My team entered $MU at $72.92 per share. Our first take profit is $92.
My team averaged up on our position today at $82.5 per share bringing our share average up to $77.71.
OUR FIRST ENTRY: $72.92
OUR 2ND ENTRY: $82.50
FIRST TAKE PROFIT: $92
2ND TAKE PROFIT: $103
If you want to see more, please like and follow us @SimplyShowMeTheMoney

MDB MongoDB revenue increased 50% YoYMongoDB's fiscal third-quarter revenue increased 50% year over year.
Revenue growth rate increasing from 39% growth in the first quarter of fiscal 2022 to 44% in fiscal Q2 and now 50% in fiscal Q3.
MongoDB's 50% revenue growth put total revenue for fiscal Q3 at $227 million.
This was far beyond analysts' average forecast for revenue of $205 million during the period. (fool.com)
With this growth rate and cloud-based database needed for the upcoming metaverses, i think MDB MongoDB can reach all time high by the end of the year.

VMW showing some super bullish signsVMW recently split off from DELL and went out on it's own, which is great news as anything AI and cloud right now is super bullish and besides it's the only one i feel that can actually compete with AMZN Cloud AWS, tbh i'm planning on doing a break down video for this play maybe try to get it out before it reports earnings so i can help show people it has some great fundamentals and coming from one of the TECH giants DELL shows nothing but upside potential in my book as you can see it is on this down trend and has had some false breaks through but being that alot of tech plays are starting to pick up steam it will be one that i will be watching for to get a nice break out to the top side.

Long $OKTA - Ready for next leg upSince IPO Okta has maintained it's growth and it has done that in phases. Looking at weekly chart it looks promising and consistent in 4 year long uptrend.
In 2021 it has mostly consolidated and absorbed last years growth and gearing up for next phase of growth.
Okta has earnings on Dec 1, be careful about position sizing. Try to avoid earnings volatility.

FRSHThis is a very pre-mature chart here I'm doing for you @ALYWLAM
I can expect Frshworks to stay bullish in long run. Although we may be witnessing the start of a shakeout on the stock since it's fairly new into the market.
We've seen an instance like AFRM where it dropped in half from open price all the way down to the 40's before forming a cup and handle and exploding to the upside, which I hope happens with FRSH.
Continue to buy up the stock at any given lvl in the 20's or even low 30's iMO.
I'm bullish on the long term existance of this stock.

ESports - Value Investing - DraftKings Competitor - Metaverse Gaming stocks are great. Gaming #stonks like $DKNG not so much. Valuation matters most in *rising rates environment. #valueinvesting wins next decade.
#cannabisreform is #thefuture
$KERN #thegem
CANNABIS COMPLIANCE SOFTWARE
GL

$CYBR: The Future Is NowCYBR is setting up for a massive weekly/monthly move and I think it's important that traders get positioned for the potential move. Earnings were significantly better than estimates and I suspect they still have plenty of room to grow

FTM breakout imminentFTM has been in limbo today, and it seems that it wants to pick up where it ended yesterday. we are currently at a breakout level.
1H
Ichimoku cloud:
The Kijun and Tenkan lines are above the (green) cloud, and very close to each other. i'm expecting a cross within the next few hours. The cross above the cloud is a strong bullish signal.
Bollinger bands:
The price touched the upper band, but did not close there. this indicates that the upward movement will probably see continuation.
RSI:
RSI is 51 now, so there is plenty of room to push the price up. Because the market is pretty bullish, i'd say RSI is acceptable up to 70.
Volume:
The Volume is slowly getting less and less, indicating that there will be a move. daily close in 30 minutes. let's see what happens.
I hope you enjoyed my analysis and i would love to get you feedback and discuss.
Cheers,
Mike

$ETH / USD -- Mini-Cloud-Bank w/ V Shape RecoveryHello Traders,
Ethereum looks to have formed what I call a mini-cloud-bank patter.
Why, Mini? Because generally speaking Cloud Bank patterns take anywhere from months to years to form, which are followed by a steep 40-60% drop-off with a "V" shape recovery. Clouds usually form during or right before a Bear Market, then take a massive plunge to start a recovery.
Now, my thoughts are, we have mostly seen sideways chop over the last month or so, with some peaks and valleys, before finally dropping 32% from the recent peak. Not speaking too soon, it looks as if the market has found a bottom and has formed a sharp "V" shape recovery, pending no further massive drops.
These types of patterns and market behavior can be ideal for a strong bull run over the next upcoming months for steady and consistent growth to the upside.
Take this with a grain of salt as this is not a true Cloud Bank Pattern but has all of the characteristics of being considered a "Mini" Cloud.
Good luck!

Drawn trendline + LR on QuisCharts are an amazing tool. Been an amazing 1.5 years having control of my money to learn about technical analysis. I have been meaning to take a look at quis technically on this uptrend, Linear Regression I find is a great tool to price gain further context on longer time frames.
I started this chart by inputting my own support and resistance trend lines. It follows that as you map out a line acting as resistance and one as support, you are going to find alot of the stocks price action in between. This price action acts as data to be inputted into a Linear Regression model. Utilizing 3 regression lines set from Standard Deviations -3 to +3, we capture 99.7% of data-price, for Quis.
Quis over the past week has again started tightening up. Trading well below its daily average today into last weeks session. I have to admit I was off on the last tighten up around earnings. stock slipped up and went the other way for a week. these weeks candles and volume will be very telling to me on Quis being ready to go.
Catalysts on the near term horizon include Visa end point certification for LedgerPay. LedgerPay is the first payment processing solution that is built on cloud technology, Microsofts Azure Cloud to be specific. You may have seen news out that Amazon is looking to build its own payment platform for retail business. Its to be able to take in all the data on AWS network and make AWS more valuable. Microsoft in a battle forever now on cloud with Amazon got here first by working with Quisitive, a premier partner of microsoft. Microsoft expects to punch back here with Quis as its boxer, this is due to the product offering and funcationality of Ledgerpay and its data intelligence arm and those capabilities.
Further to certification, I think a contract being landed (guidance given on last earnings call Q&A that customers for Ledgerpay would likely be signing contracts before or shortly after LP is fully commercialized with Visa end point cert. It is on news of these contracts I feel the stock can push up to an area in the +2-+3 SD Channel. CEO Mike Reinhart represented Quis on an gateway investor webinar last week and guided that an uplist in Canada to the TSX was foundationally in place, and that US uplist was near as well. $QUISF currently trade on the pinks OTC. Quis also just filed an updated and amended SBP, as i note in my DD pieces, dilution is part of the game here and a risk to upside movement. Given the last two raises made by quis came after moves up, I think it follows that this will will too, but that may not align with acquisition opportunity forcing it to come earlier.
In any case please always do your DD, feel free to check out my substack lebellechart for my own DD, and follow your own trading & investing rules.
Cheers,
Luke

Snowflake, Inc. $SNOW reaches pattern target, partial exitSnowflake is a cloud computing-based data warehousing company based in Montana, named after the founders' love for winter sports. I like winter sports, and the ticker SNOW is aesthetically appealing in my portfolio.
The trade setup was straightforward. The company IPO'd in 2020 at $220, and after one quarter that saw investors take price up above $400 per share, all post-IPO gains were given back by mid-2021, and price got down to as low as $180.
Between March - July 2021, $SNOW formed an inverted Head and Shoulders bottom, reflected by the blue curved drawings - a left shoulder, a "head", and a right shoulder. Once price broke above the pattern boundary, I reached a measured target of $320 by applying the width of the pattern (from $180 to $250, or $70) to the breakout level of $250.
$70 + $250 = $320
This measurement criteria is based on the works of John Magee and Robert D. Edwards in Technical Analysis of Stock Trends (5th edition, 1948).
My stop-loss, the "Last Day Rule", and my limit order placement is based on teachings from my friend and active trading legend Peter L. Brandt (Diary of A Professional Commodity Trader, @PeterLBrandt).
I've now covered 3/4 of this position for a gain of 28% (70/250).
My maximum risk, assuming my stop loss order filled peacefully at its activation price was only 4% (10/250).
The risk to reward setup at the time of entry was then (4%) to 28%, or 1 to 7.
Snowflake is probably in line for further price gains, but I have no reason to believe I have an edge at these levels.

FIL OutlookI missed a huge run a few months ago and have learned from my mistakes. Long term down pressure seemingly snapped, expecting some more selling pressure before the bullish buying takes over breaking into a large cup & handle that should bring us back to ATH in fall/winter 2021. COINBASE:FILUSD
