BTC at a Crossroad: Head & Shoulders or Moonshot? Analyzing the CME Bitcoin Futures chart, we can clearly see confirmation of the price gap between $92K and $94K, which significantly increases the probability of a Head & Shoulders (H&S) formation.
✅ Key Scenarios to Watch
Scenario 1 – H&S Confirmed:
Potential retracement toward $52K–$62K based on the right shoulder's depth
Scenario 2 – Failure H&S Confirmed:
Bullish breakout could push BTC toward $140K–$150K. based on the right shoulder's depth
🔍 Technical Insight
The left shoulde r formed near the Fibonacci 0.618 / 0.382 leve ls. Based on these Fib zones, the right shoulder could develop within a similar range—critical for validating the pattern if weekly closure occurs over 94K .
Disclaimer: This analysis is for educational purposes only and does not constitute financial advice. Always do your own research and manage risk appropriately before making any trading decisions.
Cme!

CISD and Inversions for framing a narrative. My main ModelThe next day model of MMXM. Thought process on how you can frame your bias for the next day next 4h next hourly and next 15min

CME Group ($CME) Stock: Restores Trading After Major OutageCME Group brought its Globex Futures & Options platform back online after an hours-long outage that disrupted global markets across Asia and Europe. The shutdown struck during a holiday-shortened US session, creating uncertainty for traders managing month-end rolls. Globex processes nearly 90% of CME’s total volume, so the disruption rippled across commodities, rates, equity futures, and FX-linked products.
The outage stemmed from a cooling-system failure at the Aurora, Illinois data center operated by CyrusOne. The facility has long served as the main engine for CME’s electronic infrastructure. High-frequency trading firms rely heavily on proximity to the Aurora center, making the malfunction a notable stress point for global liquidity.
Treasury futures, SOFR-linked options, gold, crude oil, and palm oil markets all experienced interruptions or erratic price action. Liquidity thinned as traders shifted into cash Treasuries to manage exposure. The timing was challenging since the previous day’s Thanksgiving closure already limited activity.
Operational Risk Concerns Rise
The event revived questions about CME’s redundancy planning. The exchange has a disaster-recovery site in the New York area, yet opted to restart from Aurora because early assessments suggested a quicker resolution. The delay highlighted how a single point of failure creates broad market friction across asset classes.
Technical Outlook: Bullish Structure Holds
CME stock maintains a bullish structure. Price retested and held support around $272 after a recent breakout. Momentum targets remain at the $288 resistance zone, followed by $290 if strength persists. The setup favors continuation as long as price remains above support.

Emini Nasdaq 100. Important Areas to look for and Weekly outlookCME_MINI:NQ1!
Highlighted the important levels. what to look for how we can approach the next week in terms of higher timeframe reference points

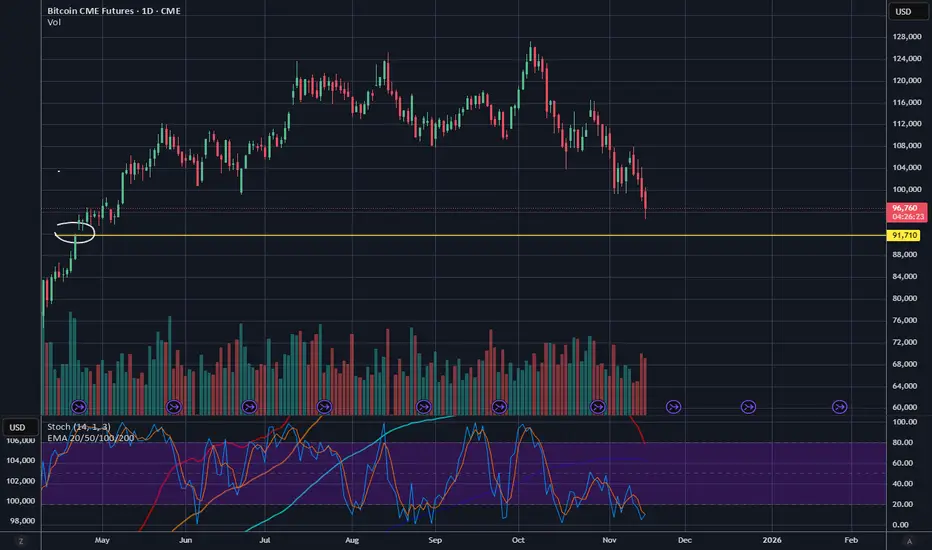
BTC CME - One final push down to close the gap?There is unfilled CME gap at $91,700 that remains unfilled. Could we have one more push down to fill it?
Platinum Rallied More Than Gold and Silver in 2025Platinum has rallied more than gold and silver so far in 2025.
From their trough to its recent high, platinum has gained 102%. Silver takes second place with a 95% increase, while gold comes in third with a 68% rise.
Gold has broken above their all-time highs last year, and silver has also broken is all time high this high this year, but platinum has not—does this mean platinum still has more upside potential than gold and silver?
Platinum Futures & Options
Ticker: PL
Minimum fluctuation:
0.10 per troy ounce = $5.00
Disclaimer:
• What presented here is not a recommendation, please consult your licensed broker.
• Our mission is to create lateral thinking skills for every investor and trader, knowing when to take a calculated risk with market uncertainty and a bolder risk when opportunity arises.
CME Real-time Market Data help identify trading set-ups in real-time and express my market views. If you have futures in your trading portfolio, you can check out on CME Group data plans available that suit your trading needs www.tradingview.com

China Yuan Direction & Critical Dollar SupportThe US dollar is still the leading global payment currency, holding a significant share of 49% compared to all other currencies.
However, the Chinese yuan is on the rise. Although it currently accounts for only 3.5%, its growth over the past two years has drawn my attention.
The yuan’s share increased from 2% in 2023 to 3.5% this year, representing a 75% increase in just 2 years.
And for global commerce, the growth is even more striking:
“In trade, 6% of global commerce was financed in RMB last year, up from under 2% in 2023.”
This represents a 200% increase in the use of the yuan for trade in also just 2 years.
If the yuan continues to grow at the same pace — at a 75% increase every 2 years —
it would take roughly 11 to 12 more years to reach 49%, i.e., around the year 2036.
Video version for the statistics:
Offshore Chinese Renminbi Futures and Options
Ticker: CNH
Minimum fluctuation:
Outright:0.0005 per USD increment = 50 CNH
Disclaimer:
• What presented here is not a recommendation, please consult your licensed broker.
• Our mission is to create lateral thinking skills for every investor and trader, knowing when to take a calculated risk with market uncertainty and a bolder risk when opportunity arises.
CME Real-time Market Data help identify trading set-ups in real-time and express my market views. If you have futures in your trading portfolio, you can check out on CME Group data plans available that suit your trading needs www.tradingview.com

Nasdaq, Bitcoin, Gold, Dollar Index and Fiber Weekly OutlookMajor insights on all the above instruments and the possible draw on liquidity along with entry mechanisms.

Emini Nasdaq 100. 10.10.2025, WalkthroughCME_MINI:MNQ1!
One-sided expansion after Trump announcement on China tariffs. A geopolitical event and major liquidation across the board.


E mini Nasdaq 100. Daily Outlook and walkthroughCME_MINI:NQU2025
Explained the reasoning and the orderflow on NQ. Clean onesided delivery during New York Open

E mini Nasdaq 100. Weekly Outlook. September 01, 2025CME_MINI:NQ1!
Expecting all out meltdown on Nasdaq. And the other two indexes. August was insane. But September will be extremely volatile

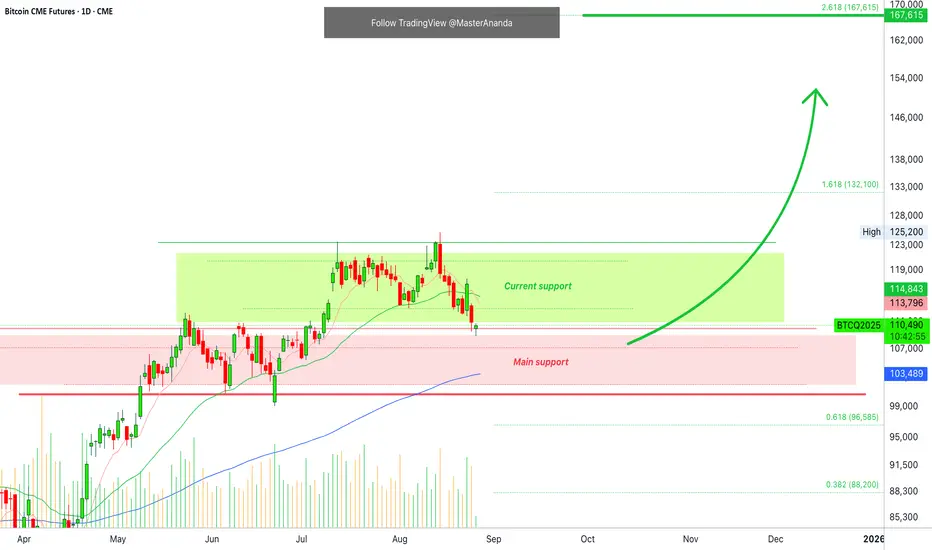
Bitcoin 8X LONG Chart Setup · 330% Profits PotentialWe have two support zones neatly depicted on the chart; green and red. Red is the main support zone, the range between $100,000 and $110,000, while green is the bullish zone support zone between $110,000 and $120,000.
BTC1! is trading within the bullish zone, above $110,000 after a strong monthly higher low, vs 22-June. Volume is standard for a continuation of the broader long-term bullish move. That is, even with short-term swings and price fluctuations Bitcoin is set to continue growing.
Because I believe firmly that Bitcoin will continue to grow, here I am showing you some numbers with mid-term goals.
The final target on this signal I believe is not the last target for the current run, but there is strong resistance at this level so we can always go out to comeback in, or adapt to your own liking since we are all adults.
I give you a great entry with great prices and timing, you take care of the rest. The market is here to bless us with growth, profits and success.
Full trade-numbers below:
______
LONG BTCUSDT 8X (PP: 330%)
ENTRY: $100,000 - $111,000 (STOP: $98,200)
TARGETS: $122,000, $137,000, $155,600
______
Thank you for reading.
Your support is highly appreciated.
Namaste.
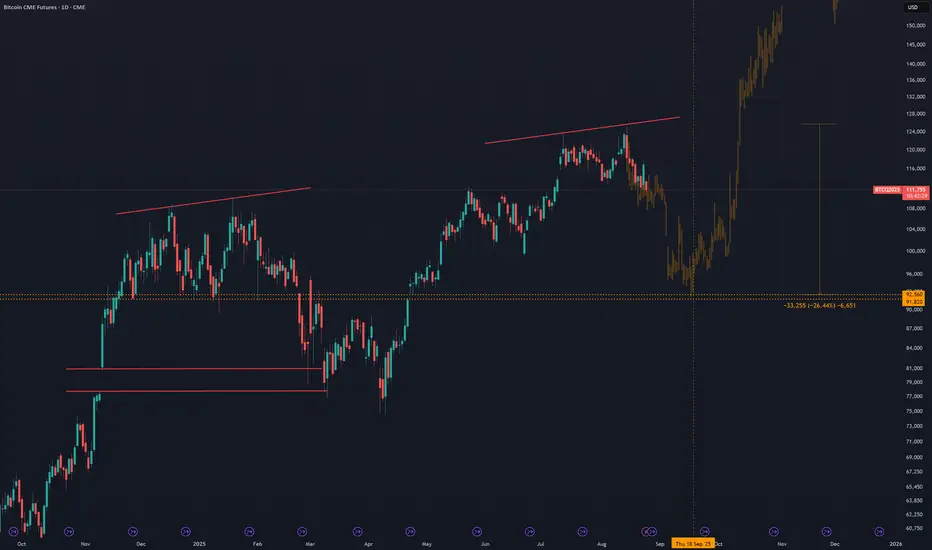
Distribution Pattern Signals Crash Into CME Gap at 92kIt is always the same playbook at this point and it is getting boring to watch. The same double top distribution pattern repeats again and again. This is the game they play, wiping out both shorts and longs before the real rally begins.
The last time we saw this setup Bitcoin pulled back 32 percent into the CME gap at 77k. The next gap sits at 92k and you can bet they will dump it down there too. In reality it is not even that big of a move, just 26 percent, perfectly in line with previous pullbacks.
The real story is the fear it will create. This lines up with September, historically Bitcoin’s worst performing month and a time when blood usually runs in the streets.
DO NOT FALL FOR THIS BEAR TRAP AND SHAKE OUT
BTC CME / FVG levelsHi,
Here are some 4 hour FVG / CME levels I found on BTC, just to have an overview over the levels in case of bull, in case of bear, etc..
Price don't have to respect these levels, but usually does, in accordance with ICT market maker / smart money algorithm theory.
Have a great day, and good luck trading!

E mini Nasdaq 100. NYSE. 20.08.2025, WednesdayCME_MINI:NQU2025
Outlined the daily Institutional Order flow. And the Market Efficiency Paradigm

Bitcoin Goes Bullish · Altcoins Market Resumes GrowingBitcoin and the altcoins market is about to perform one of those surprise moves that it really loves, a huge major advance; we are going up.
How are you feeling in this wonderful new week my friend?
I am happy to have your attention. Please, continue reading below and let me know in the comments what you think about this analysis.
The markets are open, people are trading, buying and selling while prices are rising. Bitcoin is no longer going down and the retrace was very small. The total drop so far amounts to less than 10%, but it is wise to consider that the current range is not $110,000 to $120,000 but $100,000 to $120,000. It is a wide range.
The new all-time high is not a major new level but instead a double-top compared to mid-July. Seeing how a double-top made no impression on the bears, seeing how the market continues super strong, we can easily predict that the bull market is not over and Bitcoin will continue to grow. What about Litecoin?
Chainlink is no longer trading at bottom prices but it has plenty of room available for growth. It is not at the bottom but certainly not a new all-time high either. The same for Cardano. Will it stop growing and enter a bear market when it was already doing so great? No, it will continue growing long-term.
Hedera also grew nicely and a small portion of the market is in the same boat. The bigger part though is still trading near support but not for long. August is the last chance to get those still behind while prices are still low. The fact that many projects are ahead, high up, confirms where the market is headed.
If you think a few years back, everything was down including Bitcoin.
If you think last year, everything was down but Bitcoin.
If you see how the market is doing now, many projects are very strong and growing. This reveals what is coming to the rest of the market.
First one, then two, then six, then twenty and then everything grows.
Bitcoin is about to make a surprise move... The entire market is set to grow.
Namaste.

Very briefy: from Straddles to Spreads — What Options Are Saying📊 Market Pulse (CME data based): Key Flow Signals (15.08)
Gold (Oct series):
Spreads at 3650/3750 are being closed.
📉 Sentiment: moderately bearish — no strong upside expected.
AUD:
No major repositioning or fresh flow.
🟢 Sentiment remains bullish — quiet but intact.
EUR:
No insider-level activity or large block trades.
Neutral zone — no directional edge yet.
GBP:
Growing put interest at 1.35.
🟠 Sentiment: moderately bearish — but this level will act as local support IF reached.
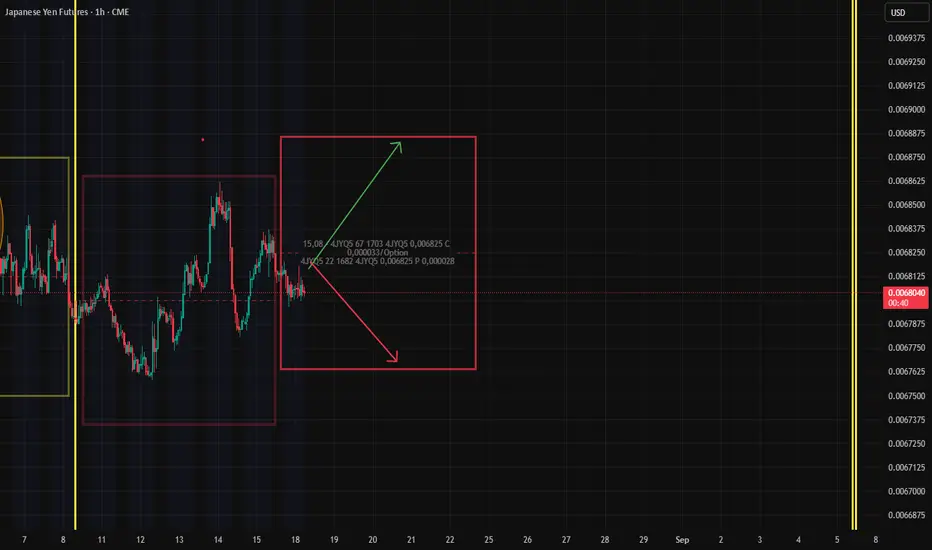
JPY:
Another straddle live — expires Aug 22 (4-day life).
Boundaries set, setup familiar.
We know the drill: fade the edges, watch the break-even levels for LONG/SHORT opens
Weekly Outlook. Index Triad. $ES $NQ $YM. 17.08.2025, SundayCME_MINI:ES1!
CME_MINI:NQ1!
CBOT_MINI:YM1!
Looking for a Weekly Power of Three on NQ ES and YM. A push down towards discount levels and again a massive push up towards new All Time Highs

Gold. Weekly Walkthrough. 10.08.2025,SundayCOMEX:GC1!
One-sided bullish expansion on Gold. Already outlined in the previous video

NQ. Market Efficiency Paradigm. Weekly Outlook 10.08.2025, CME_MINI:NQ1!
Covered the daily and hourly order flow.

Gold Weekly Outlook. 03.08.2025, SundayCOMEX:GC1!
Expecting a run up to daily BPR. Previous weekly closure suggesting bullish price action on Gold. Paytience is the key

Daily Orderflow on ES and NQ. 01.08.2025, NFP FridayCME_MINI:NQ1! CME_MINI:ES1!
Orderflow explanation. Sessional delivery and New York Price action
