Bitcoin CME Gaps (1H)Bitcoin currently has two unfilled CME gaps located in the lower price regions. Historically, CME gaps tend to act as strong magnets for price, as Bitcoin often revisits these areas to fill the gaps before resuming its primary trend. While this behavior is not guaranteed, it has occurred frequently enough to be considered an important factor in technical analysis.
At the moment, the first CME gap is positioned in the 91K–90K zone, which represents a relatively shallow pullback area and could be tested during a normal corrective move. If selling pressure increases or the market enters a deeper retracement phase, the second CME gap located around 88K may come into play as a stronger downside target.
These levels should be monitored closely, as price reactions around CME gaps can provide valuable insight into market strength, liquidity absorption, and potential trend continuation. A clean fill followed by strong bullish confirmation could indicate that the market is preparing for the next leg higher. Conversely, failure to reclaim these levels may suggest extended consolidation or deeper correction.
As always, CME gaps should be analyzed in confluence with other technical tools such as market structure, support and resistance zones, volume behavior, and momentum indicators. They are not standalone signals, but when combined with broader market context, they can significantly improve trade planning and risk management.
If you have a coin or altcoin you want analyzed, first hit the like button and then comment its name so I can review it for you.
This is not a trade setup, as it has no precise stop-loss, stop, or target. I do not publish my trade setups here.
Cmegap

What is bitcoin CME Gap? How to use BTC gap IndicatorWhat is bitcoin CME Gap? How to use BTC gap Indicator
The 'Gap' in the CME (Chicago Mercantile Exchange) futures market, which offers a glimpse into the movements of institutional investors, is one of the key indicators many professional traders watch closely.
1️⃣ What is the Bitcoin CME Gap?
CME is one of the primary avenues for institutional investors to access Bitcoin. However, the CME Bitcoin futures market closes over the weekend (from Friday afternoon to Sunday afternoon, Chicago time, USA). Additionally, there is a one-hour trading break after market close on weekdays.
Conversely, spot exchanges like Binance and OKX, which we commonly see, operate 24 hours a day.
This difference is where a 'Gap' occurs. Especially during weekends, when the break is longer, gaps tend to be larger.
Bearish Gap: Occurs when the opening price after the CME market closes is lower than the closing price. This means that the Bitcoin price fell in the spot market during the off-hours.
Bullish Gap: Occurs when the opening price after the CME market closes is higher than the closing price. This means that the Bitcoin price rose significantly in the spot market during the off-hours.
Abrupt Psychological Shift: This implies that investor sentiment leaned heavily towards one side during the weekend.
Unfilled Order Blocks: The gap area is interpreted as a region where potential unfilled orders (buy/sell pressure) may exist.
Gap Fill Phenomenon: Many traders believe in the adage "gaps get filled" and use it as a trading strategy. This suggests a tendency for the price to move in the opposite direction of the gap, eventually attempting to cover the gap area. However, this phenomenon is not 'mandatory', and whether a gap will be filled immediately or much later must be judged through various analyses.
2️⃣ Easily Find CME Gaps
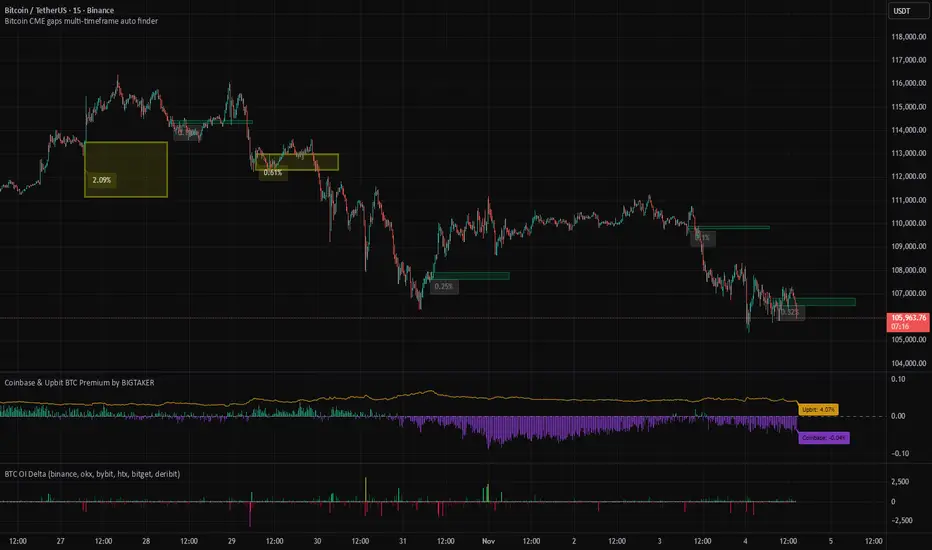
The Bitcoin CME gaps multi-timeframe auto finder indicator automates CME candle analysis and displays it intuitively on the chart.
⚡Indicator Features and Usage
Multi-Timeframe Gap Detection: 5-minute, 15-minute, 30-minute, 1-hour, 4-hour, and even 1-day candles! It simultaneously detects and displays CME gaps occurring across various timeframes. Whether you're a short-term trader or a long-term investor, you can check gaps according to your trading style.
Automatic Box and Label Display: The detected gap areas are drawn as rectangular boxes on the chart. Bullish gaps are displayed in green tones, and bearish gaps in red tones, making them easy to identify at a glance. The size of each gap (%) is displayed as a label above its respective box.
Highlight Function: Large gaps above a set threshold (e.g., 0.5%) are highlighted with an emphasized color. 'Big gaps' can have a greater impact on the market, so they should be noted.
Chart Price Synchronization: The price of spot charts from other exchanges may differ from the CME futures price. This indicator adjusts the price of the gap boxes to the price level of the chart you are currently viewing via the "Chart_price" mode. By using the "Chart_price" mode, you can more intuitively grasp the price level of the gap box on the spot chart and make direct trading plans on the chart of another exchange you are viewing.
Real-time Alerts: You can receive real-time alerts when a new CME gap is detected. You can also set alerts to notify you only about gaps from a specific timeframe. This is extremely useful when you can't continuously watch the chart during weekends or specific times on weekdays.
3️⃣ Trading Strategies
💡Gap Fill Strategy:
When a Bullish Gap Occurs: If the price breaks above a bullish gap but then falls back into the gap area attempting to fill it, one might consider a long position near the bottom of the gap, or a short position if the price fails to rebound from the top of the gap. Alternatively, a strategy of considering a short position in a resistance zone before the gap is filled is also possible.
When a Bearish Gap Occurs: If the price breaks below a bearish gap but then rises back into the gap area attempting to fill it, one might consider a short position near the top of the gap, or a long position if the price fails to fall from the bottom of the gap. Alternatively, a strategy of considering a long position in a lower support zone before the gap is filled is also possible.
💡Utilizing as Support/Resistance Areas:
Old CME gap areas can act as strong support or resistance lines when the price retests those levels in the future.
Observe whether the price encounters resistance and falls again when it reaches the top of a bearish gap, or if it finds support and rises again when it reaches the bottom of a bullish gap. Gaps that overlap across multiple timeframes can hold even stronger significance.
💡Trend Confirmation and Reversal Signals:
If a strong bearish gap occurs and is not immediately filled, but the price continues to fall, this could indicate the start or continuation of a strong downtrend.
If a strong bullish gap occurs and is not immediately filled, but the price continues to rise, this could indicate the start or continuation of a strong uptrend.
You can use the price movement after a gap occurs to gauge market momentum and apply trend-following or trend-reversal strategies.
For example, if a bearish gap occurs but is quickly filled within a few days and breaks above the top of the gap, this could be interpreted as an early sign that the bearish market has ended.
💡Multi-Timeframe Analysis:
When looking for key support/resistance levels, check not only the gaps of the current timeframe you are viewing but also gaps from higher timeframes (e.g., 4-hour or daily gaps on a 1-hour chart).
Gaps from larger timeframes are areas of stronger market interest. When making trading decisions in smaller timeframes, consider the location of important gaps from higher timeframes for risk management or to set entry/exit targets.
Short-term Gaps (5m, 15m): Most gaps occur within 1% and can be utilized for short-term volatility, high-leverage scalping, or day trading. They are suitable for quick entry/exit strategies, with caution against whipsaws. They tend to be filled before the 4-hour candle closes after the market opens.
Medium-term Gaps (1h, 4h): Can be referenced for swing trading or position trading. They can become significant support/resistance areas depending on price movement after the gap occurs.
Long-term Gaps (1d): Can act as major turning points in market trends or as important support/resistance levels from a long-term perspective. If a 'big gap' occurs, the possibility of a shift in the market's overall direction should also be considered. They usually occur during the weekend off-hours, and sometimes large gaps of over 3% occur.
A weekday short-term gap that was filled 4 hours ago.
A weekend long-term gap that saw a trend increase after a 4% big gap occurred.
4️⃣ Conclusion
The 'Bitcoin CME Gap Multi-Timeframe Auto Detector' indicator is a powerful tool that helps you not miss crucial price fluctuation points in the market.
However, no indicator should be blindly trusted. Gaps may not be fully filled, or the price may immediately break out in the opposite direction after surpassing a gap. Instead of relying solely on gap filling, it is crucial to analyze it in conjunction with other indicators to increase your win rate.
We hope you utilize the information gained from this indicator and combine it with your existing analysis methods (chart patterns, auxiliary indicators, macroeconomic analysis, etc.) to build more sophisticated trading strategies.
📌If this content was useful, please support us with a boost and comments. Your small encouragement is a great strength for creating better analyses and content. By following, you can also receive notifications about our postings

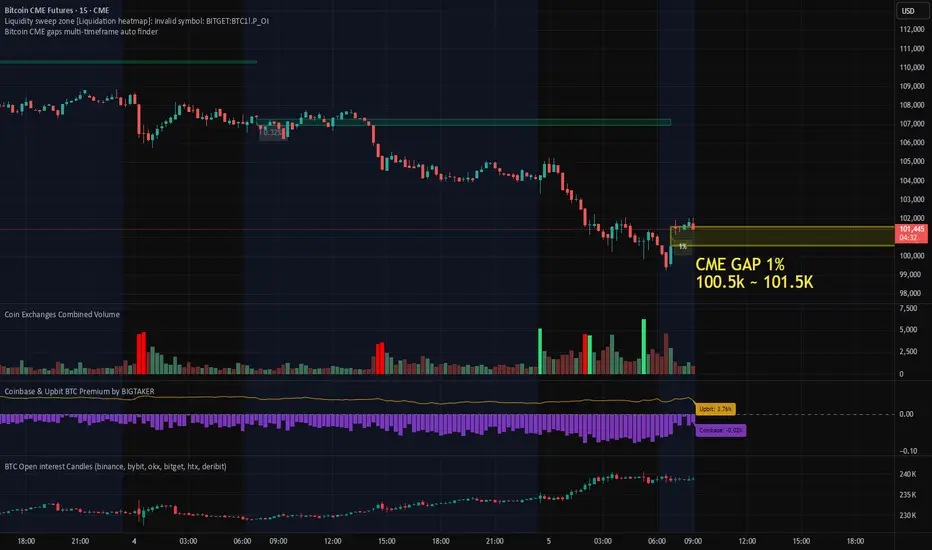
1% Bitcoin CME Gap Formed, Futures Market Data AnalysisThis morning, a ~1% gap formed on the Bitcoin CME futures chart.
Given that the gap occurred after a sharp decline, it’s important to consider the possibility of both a gap fill and a retest of recent lows in the short term.
The Coinbase Premium remains in negative territory, though it has shown slight improvement compared to yesterday, suggesting that U.S. spot selling pressure has somewhat eased.
In addition, Open Interest has increased, with data indicating a rise in short positions.
This suggests that selling pressure has been building during the recent decline, which may lead to a period of heightened short-term volatility and consolidation before the gap is fully filled.
Summary:
CME Gap Range: Approximately 1%
Market Structure: Short-term downtrend followed by consolidation
Coinbase Premium: Still negative, but slightly improved
Open Interest: Increasing (inflow of short positions)
📍In the short term, it is crucial to monitor whether the price enters the gap fill zone and retests the recent lows, while maintaining support at 98K, which remains a key short-term level.
How to use bitcoin CME gap auto finder indicator on tradingview📊 Bitcoin CME Gap Auto Detection and Visualization Indicator
The Pine Script-based indicator Bitcoin CME gaps multi-timeframe auto finder is a TradingView tool designed for cryptocurrency traders and investors to automatically identify and visualize Bitcoin CME (Chicago Mercantile Exchange) futures market gaps across multiple timeframes.
The Bitcoin CME futures market often creates price gaps after weekends or holidays when trading resumes. These gaps typically represent market imbalances, and many traders believe that price levels where gaps occur are likely to be revisited in the future.
This concept is known as the "Gap Fill" theory, where such gaps are considered key price zones that may act as support or resistance levels.
Traditionally, manually identifying these gaps requires checking multiple timeframes and verifying weekend/holiday sessions, which is both tedious and time-consuming.
Indicator Link: Bitcoin CME gaps multi-timeframe auto finder
🔑 Key Features of the Indicator
Automated Gap Detection: Saves traders the time and effort of manually searching for and marking gaps.
Cross-Exchange Synchronization: CME gap boxes are displayed in sync on other Bitcoin charts such as BTCUSDT, BTCUSDT.P, and BTCUSD.
Multi-Timeframe Analysis: Displays gaps simultaneously across various timeframes (5m, 15m, 30m, 1h, 4h, 1D), providing multiple market perspectives.
Visual Clarity: Clearly highlights gap zones, with major gaps emphasized for quick trader recognition.
Strategic Trading Support: Provides essential information for developing and executing gap fill-based trading strategies.
CME Gap History: Allows users to review all past CME gaps formed in historical candles.
Alert Functionality: Sends real-time notifications when new gaps are detected, helping traders respond promptly to market changes.
⚙️ Main Functions and Usage
This indicator provides a wide range of customizable input options, allowing traders to adapt it to their specific analytical needs.
CME Gap Settings:
CME Symbol for Gaps: Specifies the symbol used to fetch CME futures data. The default is “BTC1!” (Bitcoin CME Futures).
Minimum gap percentage (%): Sets the minimum price movement recognized as a gap, allowing users to filter out minor fluctuations and focus on significant ones.
Display Timeframes:
Enables or disables gap visualization for each timeframe (5m, 15m, 30m, 1h, 4h, 1D). Users can activate only the timeframes they prefer to analyze.
Box Colors:
Customizable colors for each timeframe and gap direction (upward/downward), allowing easy visual distinction between gap types.
Box Extension Lengths (Bars):
Sets the number of bars the gap box extends to the right for each timeframe.
This visually illustrates how gap zones can remain relevant as future support/resistance levels.
Label Settings:
Show labels: Toggles the display of percentage labels for gaps.
Label position: Adjusts where the label appears inside the box.
Label text size: Controls the label font size.
Highlight Settings:
Highlight gap % (>=): Emphasizes gaps larger than a specified percentage, providing visual alerts for major gaps.
Highlight label text color: Sets the text color for highlighted gap labels.
Highlight box color: Defines the color for highlighted gap boxes.
Highlight box border width: Adds adjustable border thickness to highlighted gap boxes, making significant gaps stand out even more.
Alert Settings:
Enable Alerts: Toggles alert activation when gaps occur.
Alert Timeframe: Choose specific timeframes for receiving alerts or enable alerts for all timeframes.
🚀 How It Works
The indicator retrieves CME futures data (BTC1!) and compares the previous bar’s close/high/low with the current bar’s open across multiple timeframes to identify gaps.
It is specifically designed to detect gaps that occur when the market reopens after weekends or holidays.
Once a gap is detected, the indicator draws a box to visually mark it on the chart.
If the gap size exceeds the user-defined threshold, the box is emphasized using a highlight color and thicker border for greater visibility.
💡 Trading Strategies and Applications
Support and Resistance Identification:
CME gap zones often act as strong support or resistance levels.
Unfilled gaps may indicate potential price return zones, serving as signals for possible reversals or trend continuation.
Gap Fill Strategy:
Many traders believe that gaps tend to be filled eventually.
This indicator can help identify potential entry and exit points for gap fill trades.
For example, after a downward gap, traders might consider entering a long position when the price begins to recover toward the upper boundary of the gap and close the trade once the gap is filled.
Market Sentiment Analysis:
The size and frequency of gaps can reflect strong market movements or uncertainty.
Large gaps often indicate intense buying or selling pressure, and highlighted gaps help quickly identify these significant market events.
Multi-Timeframe Confirmation:
When gaps occur simultaneously across several timeframes, it underscores the importance of that price zone.
For instance, if a gap appears on both the 1-hour and 4-hour charts, traders should pay close attention to potential price reactions at that level.
Opportunity Detection via Alerts:
By enabling alerts, traders can monitor market changes in real time and act immediately when new gaps form — particularly useful for short-term or high-frequency strategies requiring fast decisions.
🚨 Cautions
Gap fills are not guaranteed: While gaps often tend to be filled, not all of them will, and some may take a long time.
Time zone configuration: Since the CME operates in specific trading hours, make sure the indicator’s GMT+9 timezone matches your local trading setup on TradingView.
Avoid using in isolation: Combine this indicator with other technical tools (e.g., moving averages, RSI, volume indicators) to enhance reliability and accuracy.
※ If you found the Bitcoin CME gap auto finder indicator helpful, please give it a like and follow.
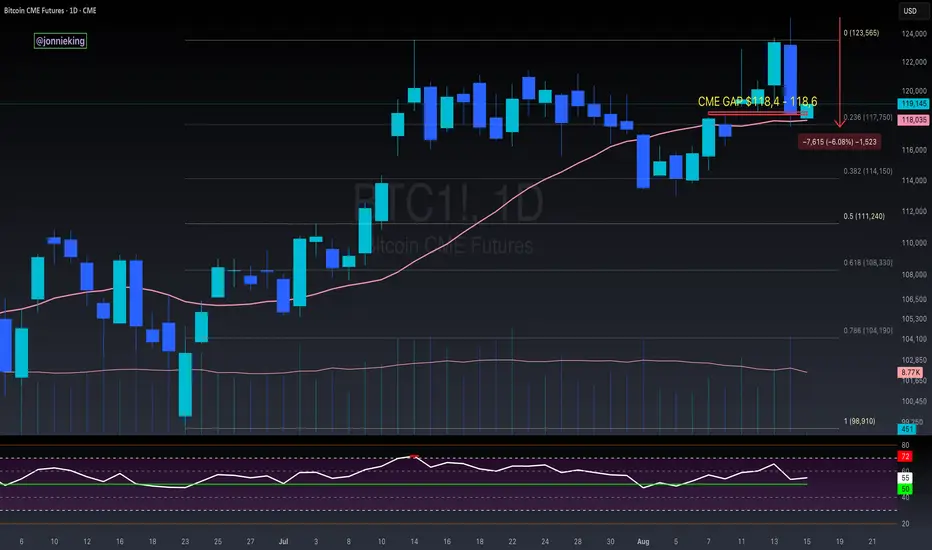
$BTC CME GAP @ $111k - One Last Flush?FYI CRYPTOCAP:BTC CME GAP @ $111k
NBD ~3.5% down from here.
Would be best to fill sooner rather than later so that it's not laying around for sell pressure.
PA got rejected and closed the day below the 50MA which hopefully gives us one last flush before UpTober.
Maybe the government shutdown propels us there 🤔

Bitcoin Setup: Eyeing CME Gap at $113KBitcoin( BINANCE:BTCUSDT ) is currently trading in a Heavy Support zone($112,000-$105,800) and near the Support zone($110,920-$109,900), Support lines, Potential Reversal Zone(PRZ) , and Cumulative Long Liquidation Leverage($110,430-$109,660).
In terms of Elliott Wave theory, Bitcoin seems to have completed a microwave 5, the reason for today's drop was the correction in the SPX500 index( SP:SPX ) and the release of US indices(Final GDP q/q, Unemployment Claims).
Also, we can see the Regular Divergence(RD+) between Consecutive Valleys.
I expect Bitcoin to move back above 100_EMA(Daily) because the breakout volume was not enough, and attack the Resistance lines. If the Resistance lines are broken we can expect the CME Gap($113,380-$113,275) to fill.
First Target: $112,600
Second Target: $113,280
Stop Loss(SL): $109,280
Cumulative Short Liquidation Leverage: $114,866-$113,720
Please respect each other's ideas and express them politely if you agree or disagree.
Bitcoin Analysis (BTCUSDT), 1-hour time frame.
Be sure to follow the updated ideas.
Do not forget to put a Stop loss for your positions (For every position you want to open).
Please follow your strategy and updates; this is just my Idea, and I will gladly see your ideas in this post.
Please do not forget the ✅' like '✅ button 🙏😊 & Share it with your friends; thanks, and Trade safe.

$BTC Bearish Engulfing Candle AlertGOOD NEWS:
-CME Gap was completely filled.
-PA is still above the 20DMA.
BAD NEWS:
-Very concerning Bearish Engulfing candle on the Daily Close.
-Volume confirms the change in trend.
MY TAKE: I wouldn't be surprised to see the market rally into a low liquidity weekend and dump hard on Monday.
$BTC One Last Flush Before the Next Leg Up!Technical Analysis really is a beautiful thing.
As mentioned, price heading down to ~$111k.
Had a small bounce off the 50DMA at $112k.
Hopefully PA doesn’t range for too long in the previous ATH POI. That will really take steam out of the bull’s engine.
I’m expecting one last flush to push the RSI a bit lower before we can continue the trend back up.
As always in a bull market, BTFD!

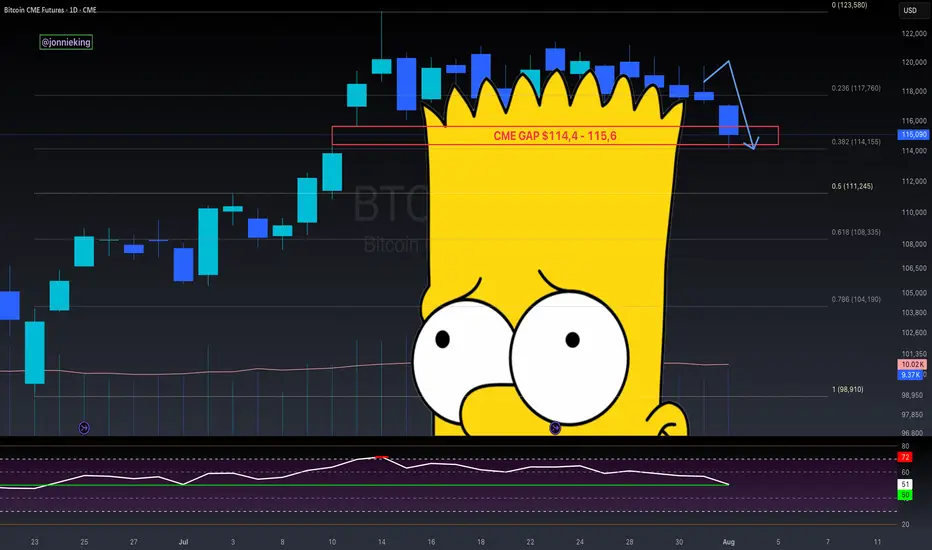
$BTC CME Gap + Bad Bart = Easiest Short EverCME Gap + Bad Bart is like taking candy from a baby 👨🏻🍼
Look at that textbook bounce off the .382 Fib 🤓
Pain ain’t over folks.
RSI still shows room on the downside 📉
Global Liquidity drain on the 4th.
Looking like the 50% Gann Level is next ~$111k
Get those bids in 😎
And never forget the BullTards who were telling you about the “Bollinger Band Squeeze” and UpOnly season 🫠
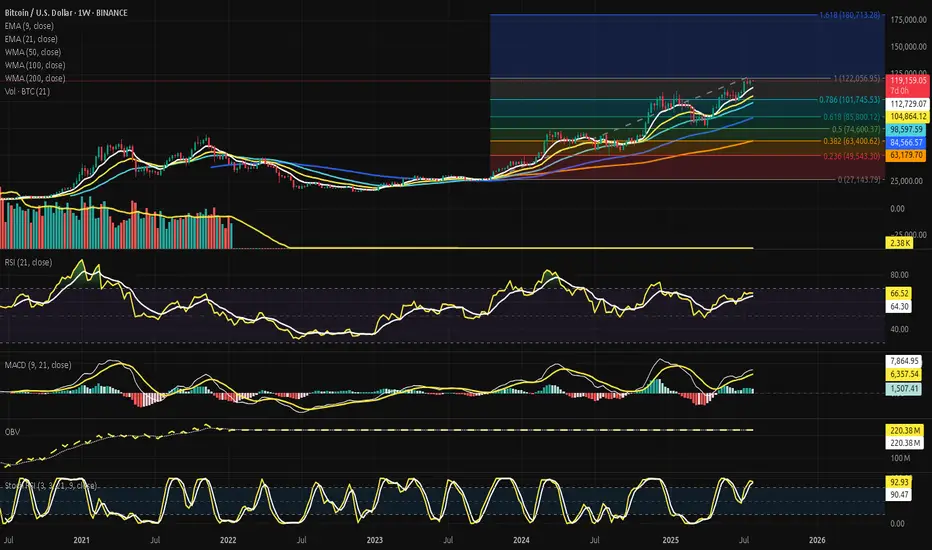
Bitcoin Weekly Seal at the Threshold 122K - No Gaps, No Retreat.⊣
⟁ BTC/USD - BINANCE - (CHART: 1W) - (Jul 27, 2025).
◇ Analysis Price: $119.374,00.
⊣
⨀ I. Temporal Axis - Strategic Interval - (1W):
▦ EMA9 - ($112.771,21):
∴ The weekly close remains above the EMA9, preserving short-term bullish structure;
∴ The EMA9 continues rising at a consistent slope, reflecting sustained upward momentum;
∴ A retracement to this level would represent the first defensive support on a tactical pullback.
✴️ Conclusion: EMA9 acts as a dynamic short-range support and trend continuation marker.
⊢
▦ EMA21 - ($104.883,22):
∴ Price remains notably above the EMA21, confirming structural strength in medium-term trend;
∴ The EMA21 was previously retested during consolidation in Q2 2025;
∴ A weekly close below it would indicate a structural loss of momentum.
✴️ Conclusion: EMA21 confirms medium-term bullish bias as long as preserved.
⊢
▦ WMA50 - ($98.605,81):
∴ WMA50 serves as a major cyclical support and remains untouched since early 2024;
∴ The gap between price and WMA50 indicates strong extension, yet risk of mean reversion rises;
∴ This level aligns with a prior demand zone around ($95K–$100K).
✴️ Conclusion: WMA50 is a latent demand zone - strategic if market reverts from exhaustion.
⊢
▦ WMA100 - ($84.570,72):
∴ This weighted average aligns with the 0.382 Fibonacci level;
∴ A long-term correction toward this band would reflect the depth of macro pullbacks in previous cycles;
∴ Currently distant from price action, but structurally significant if macro volatility increases.
✴️ Conclusion: WMA100 anchors mid-cycle recalibrations and aligns with retracement symmetry.
⊢
▦ WMA200 - ($63.181,79):
∴ The 200-week WMA remains far below price and untouched since early 2023;
∴ This is the ultimate structural support in secular bull cycles;
∴ If revisited, it signals macro-level capitulation or black swan scenario.
✴️ Conclusion: WMA200 holds the foundational line of long-term structural integrity.
⊢
▦ Fibonacci Retracement - (Range from 0 = $27.143,79 to 1 = $122.056,95):
∴ 0.000 = $27.143,79 - Genesis base from Apr 2025 cycle;
∴ 0.236 = $49.543,30 - Psychological line of control in late 2023;
∴ 0.382 = $63.400,62 - Aligned with long-term moving averages;
∴ 0.500 = $74.600,37 - Symmetry pivot of current macro-leg;
∴ 0.618 = $85.800,12 - Golden pocket lower bound;
∴ 0.786 = $101.745,53 - Golden pocket upper edge and structural resistance pre-breakout;
∴ 1.000 = $122.056,95 - Current cycle high (resistance zone);
∴ 1.618 = $180.713,28 - Projected extension target for parabolic continuation.
✴️ Conclusion: Key retracement zones for tactical reactions lie at (0.786 - $101.7K) and (0.618 - $85.8K); upside breakout target confirmed at (1.618 - $180K).
⊢
▦ Volume + EMA21 - (Last: 2.38K BTC):
∴ Volume is stable and slightly rising compared to prior weekly sessions;
∴ No high-volume sell candles indicate panic or exit;
∴ EMA21 on volume shows baseline liquidity remains active.
✴️ Conclusion: Healthy volume confirms orderly continuation rather than climax or exhaustion.
⊢
⨀ II. Momentum & Pressure Indicators:
▦ RSI (21) + EMA9 - (66.71 / 64.34):
∴ RSI approaches the 70-level but remains below overbought territory;
∴ EMA of RSI confirms rising internal strength;
∴ No divergence is observed - internal price energy remains aligned with upward momentum.
✴️ Conclusion: RSI signals strong but not overheated momentum - bulls still in control.
⊢
▦ MACD (9, 21) - (MACD: 7,887.99 | Signal: 6,362.06 | Histogram: +1,525.93):
∴ MACD histogram remains green, showing continuation of bullish trend;
∴ The spread between MACD and Signal is positive and expanding again;
∴ No bearish crossover threat imminent at current slope.
✴️ Conclusion: MACD structure reinforces bullish pressure - trend still intact.
⊢
▦ OBV + EMA9 - (OBV: 220.38M):
∴ OBV remains in an uptrend, supporting price action;
∴ EMA overlay shows no divergence or flattening;
∴ Volume accumulation remains healthy, confirming underlying conviction.
✴️ Conclusion: OBV supports continuation - no signs of distribution.
⊢
▦ Stochastic RSI (3,3,21,9) - (%K: 93.68 / %D: 90.72):
∴ Both %K and %D lines are in the overbought zone (>90);
∴ Crossovers are still bullish but nearing potential exhaustion zone;
∴ Caution warranted for short-term momentum correction.
✴️ Conclusion: Overbought levels reached - watch for tactical slowing, though no reversal confirmed.
⊢
🜎 Strategic Insight - Technical Oracle:
∴ The weekly chart exhibits a structurally intact bull trend, confirmed by the alignment and spacing of EMA's and WMA's across all horizons (short, mid, long);
∴ Fibonacci retracement levels delineate critical reaction zones, with (0.786 - $101.745,53) and (0.618 - $85.800,12) serving as dominant retrace supports in the event of a tactical correction;
∴ The presence of a projected (1.618 extension at $180.713,28) offers a sacred path forward should price breach and sustain above the current high of $122K.
∴ Momentum oscillators (RSI and MACD) continue their upward thrust without divergence, but the Stochastic RSI warns of temporal exhaustion - a typical hallmark before consolidation or rotation;
∴ Volume structure is stable and non-climactic, suggesting continuation rather than blow-off;
∴ No sign of distribution via OBV - accumulation remains intact.
✴️ Conclusion: The market remains within the upper chamber of the Fibonacci spiral. Tactical cooling is possible due to overextension in the momentum field, but no structural damage is observed. A controlled retrace into the golden pocket would be both acceptable and ritualistically symmetrical. The path to $180K remains open, but guarded.
⊣
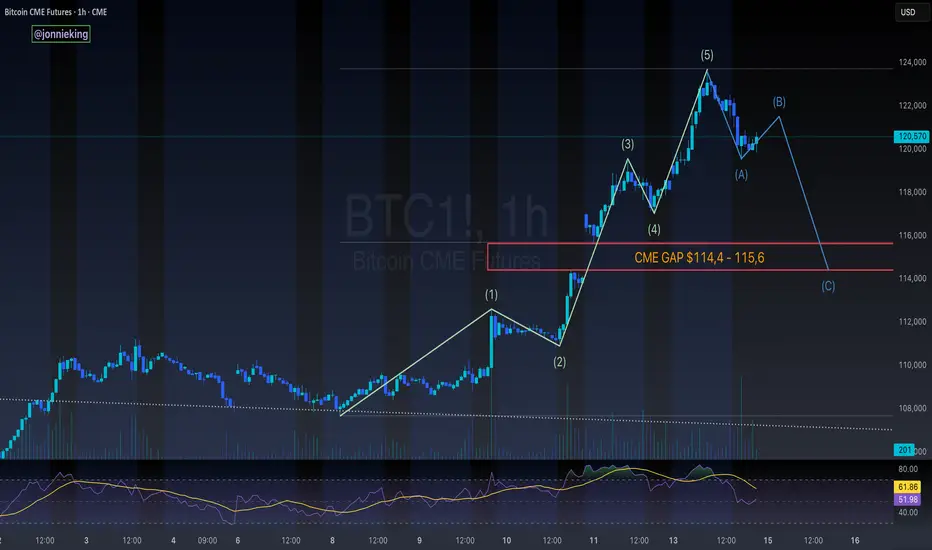
⟁ BTC/USD - CME Futures BTC1! - (CHART: 1D) - (Jul 27, 2025):
◇ Current Price: $120.785.
◇ Chart Link:
⊣
▦ CME Futures GAP - Observation & Ritual Closure:
∴ The current chart shows a clustered consolidation near $120K–$121K with no immediate upper gap visible;
∴ The last prominent CME Gap was filled during the late June run-up and early July vertical move;
∴ No new gap formed during the weekend-to-weekday open for the last 3 sessions - continuity is intact.
✴️ Conclusion: There is no unfilled CME Gap between the current price and previous sessions. All recent discontinuities appear ritually sealed. Attention now turns to potential downside gaps from rapid bullish impulse moves around ($104K–$108K), which could remain structurally unfilled - unless tactically challenged during correction.
⊢
🜎 Strategic Insight - CME Oracle:
∴ The lack of open CME Gaps suggests a clean technical field - no magnet effect pulling price backward in the short term;
∴ The compression near $121K may precede either an explosive breakout toward the Fibonacci extension ($122K / $130K+), or serve as a false plateau before a tactical flush;
∴ Absence of gaps also removes "gap fill" traders from immediate relevance, allowing price to move freely based on liquidity and macro flows.
✴️ Conclusion: The CME chart confirms no active gravitational pull downward - the battlefield is neutral and favorably clean for bullish continuation, pending macro and liquidity alignment.
⊢
∫ III. On-Chain Intelligence - (Source: CryptoQuant):
▦ Exchange Inflow Total + 9EMA - (All Exchanges):
∴ Exchange inflows remain significantly suppressed, with no spikes above 75K BTC since Q4 2023, despite the price nearing $120K;
∴ The 9EMA of inflows is stable and near local lows, showing no abnormal movement toward exchanges;
∴ Historically, spikes in inflow coincide with distribution, fear, or profit-taking, none of which are currently present on a structural level.
✴️ Conclusion: The on-chain exchange inflow behavior confirms low distribution pressure at current highs. The lack of elevated Bitcoin deposits into exchanges indicates conviction among holders and the absence of a mass selloff attempt, even near critical Fibonacci resistance.
⊢
🜎 Strategic Insight – On-Chain Oracle:
∴ While price consolidates near its cyclical high, exchange inflows remain muted, echoing behavior observed during earlier phases of strong market conviction (e.g., late 2020);
∴ This suggests the market is not preparing for heavy liquidation;
∴ The silence of inflows reinforces the tactical hypothesis that current price action is organic and not panic-driven, preserving the ritual path toward ($122K/$180K).
⊢
⧉ IV. Contextvs Macro-Geopoliticvs - Interflux Economicvs:
▦ US-EU Trade Accord: 1(5% Unified Tariff Across All Sectors):
∴ The United States and the European Union have reached a comprehensive trade agreement, averting escalation: a 15% unified tariff will apply across most EU exports to the US, down from a threatened 30%;
∴ Exceptionally high 50% tariffs remain on steel and aluminum, while some industries such as automotive, semiconductors, and pharmaceuticals will be capped at 15%;
∴ Zero-tariff exemptions have been granted to strategic sectors, including aerospace, select chemicals, semiconductor equipment, agricultural products, and critical raw materials;
∴ In return, the EU has committed to invest $600 billion in US infrastructure and tech, and to purchase $750 billion worth of US energy and defense products over three years.
✴️ Conclusion: The trade pact imposes moderate cost adjustments for key industries but restores transatlantic stability. Although friction remains in sensitive sectors, the agreement prevents global trade disorder and enhances strategic economic visibility.
⊢
🜎 Strategic Insight - Macro Oracle:
∴ The accord mitigates systemic trade risk and clears geopolitical uncertainty, which would otherwise impair market confidence in risk-on assets;
∴ Predictable tariffs (15%/50%) reduce abrupt inflationary shocks, enhancing macroeconomic forecasting and central bank policy latitude;
∴ Massive EU commitments in energy and defense inject transatlantic liquidity and strengthen demand for US dollar-based assets;
∴ While European manufacturers face pressure, the global system benefits from lower volatility and restored economic symmetry;
∴ This opens room for speculative and structural capital to flow more confidently into high-volatility instruments, including crypto assets.
✴️ Conclusion: The macro backdrop reinforces the sacred bullish path - a re-alignment of order in the West, combined with non-disruptive trade stabilization, lays the groundwork for continuation of liquidity-driven risk flows. Bitcoin stands to benefit as a speculative vessel in a structurally stable yet monetarily dynamic environment.
⊢
𓂀 Stoic-Structural Interpretation:
▦ Structurally Bullish - Tactically Watchful:
∴ Price remains above all critical EMA's and WMA's on the 1W chart;
∴ Fibonacci structure is intact, with the $122K high acting as ritual resistance and the (0.786 / 0.618 zone ($101K / $85K) as sacred fallback;
∴ Momentum indicators (MACD, RSI) sustain positive bias with no divergences;
∴ CME Futures show no unfilled gaps - the field is clean, allowing strategic extension.
✴️ Conclusion: The macrostructure supports continuation higher into the sacred extension zone ($130K–$180K), with short-term vigilance warranted due to overbought Stoch RSI and reduced volume velocity.
⊢
▦ Tactical Range Caution:
∴ Upper Limit: $122.056 - Cycle high and Fibonacci 1.0;
∴ Mid Guard: $112.770 - EMA9;
∴ Structural Support: ($101,745 - 0.786) Fib retrace;
∴ Golden Anchor: ($85.800 - 0.618) Fib retrace.
✴️ Conclusion: As long as price remains above $101K, the bullish code remains sealed. Breach of $85K would unlock deeper structural reassessment.
⊢
◩ Codicillus Silentii - Strategic Note:
∴ The week closes at the threshold of the Fibonacci (1.0 mark - $122.056), beneath a ceiling forged by time and belief;
∴ All technical layers are aligned, yet the silence in the inflow, the clean CME field, and macro equilibrium whisper a rarer truth - no storm is seen, but no wind is promised;
∴ This is the zone of the Watcher - where action becomes hesitation, and hesitation becomes discipline.
✴️ Strategic Note & Final Seal: Do not confuse absence of danger with presence of opportunity. A vertical structure with no threat below can still falter from within. This is a time not to act, but to remain unshaken.
⊢
⧉
· Cryptorvm Dominvs · MAGISTER ARCANVM · Vox Primordialis ·
⚜️ ⌬ - Silence precedes the next force. Structure is sacred - ⌬ ⚜️
⧉
⊢
CME Gap: $115.8K–$116.8K Target or Trap?There’s a clear gap between $115,800 – $116,800 on the Bitcoin CME Futures chart. Historically, BTC tends to revisit and fill these gaps. Will we see a pullback to close it before the next move up? 📊
🧠 Watching price action closely around this zone. Share your thoughts below! 👇

$BTC 5-Wave Impulse > ABC Correction > CME GapCRYPTOCAP:BTC appears to be headed towards an ABC correction after this impulsive 5-wave move to the upside
Would be a great opportunity to fill the CME gap ~$114k
Lines up perfectly with the 50% gann level retracement to confirm the next leg
don't shoot the messenger..
just sharing what i'm seeing 🥸
Ethereum - ETH - Heading towards the CME Gap - 3200 Target+ After a significant crash, Ethereum has shown a strong recovery.
+ A large CME gap exists between $2,880 and $3,270.
+ Historically, 90% of CME gaps tend to get filled sooner or later.
+ Current price action suggests Ethereum is heading directly toward this gap.
+ High probability that the CME gap will be filled during this move.
+ Next target for ETH: $3,200.
Stay tuned for more updates.
Cheers,
GreenCrypto

CME Gap Aligns with 4h 200 EMAThe CME Gap around 5710-5730 is beginning to align with the 4h 200 EMA.
4h RSI has been diverging bearish 3 times with each leg up within the channel above.
Also, a breakdown of that channel has measured moves down that align with both the 4h 50 and 200 EMA:
- 50 EMA an 0.5x measured move down
- 200 EMA a 2.5x measured move down
Pre-req on targeting the gap is a breakdown of the parallel channel shown above, and then loss of the 4h 50 EMA.
Good luck!

EURUSD – CME Gap and 0.786 Fib Align at Key Demand ZoneEURUSD has been trading with a strong bullish tone recently, breaking through previous resistance levels with conviction. However, after the latest impulse move to the upside, the market is now showing signs of exhaustion. Price has begun to pull back in a controlled manner, creating a potential opportunity for a deeper retracement into a more favorable area of interest. This kind of pullback is typical after an aggressive rally, and right now, there’s clear evidence that price may need to revisit lower levels before any further continuation higher.
Technical Confluence at Its Best:
Below the current range, there is a high-probability demand zone that combines three powerful elements: a well-respected historical support area, a CME gap that was left unfilled during the previous rally, and a 0.786 Fibonacci retracement from the latest bullish leg. These levels don’t just sit close to each other, they stack right on top of one another, forming a dense pocket of liquidity and technical confluence. The market often gravitates toward these types of zones to rebalance price and fuel the next directional move.
Short-Term Bearish Setup – Let Price Come to You:
The expectation is for price to dip lower in the short term. This would allow the market to tap into the unfilled CME gap and sweep the liquidity resting below the current structure. Traders who went long late in the move are likely to have their stops sitting just beneath recent lows, and this sets the stage for a classic inducement and stop hunt scenario. Price doesn't need to collapse, just a healthy retracement into this confluence zone to rebalance and refill the inefficiency before the real move begins.
Bullish Reversal Expectations:
Once price fills the CME gap and reaches into the 0.786 Fib retracement level, the focus shifts back to bullish. If the market holds this support cleanly and shows early signs of strength, like a displacement back above short-term structure or a strong engulfing candle, this could signal the beginning of a new upward leg. Given the context and momentum from the previous rally, it’s reasonable to anticipate a strong reaction that could drive price back toward the recent highs or potentially even higher.
The Psychology Behind the Setup:
This type of setup is a textbook example of how smart money operates. Price leaves a gap, traders pile in on the breakout, and then the market retraces to fill the imbalance and shake out weak hands before resuming the trend. Understanding the logic behind the CME gap, the liquidity below price, and how the Fib level ties everything together gives this setup depth. It’s not just about lines and zones, it’s about how liquidity flows through the market and how structure sets up to trap and reward.
Conclusion:
Patience is key. Rather than chasing the bullish momentum at current levels, the plan is to wait for price to revisit the zone where the CME gap, historical support, and the 0.786 Fib level align. That’s where the real value lies. If the reaction from this zone is clean and confirms strength, it offers a high-probability entry for the next leg up. No need to force anything, let the market come to you, then execute with precision.
___________________________________
Thanks for your support!
If you found this idea helpful or learned something new, drop a like 👍 and leave a comment, I’d love to hear your thoughts! 🚀

Ethereum - CME Gap fill before going up ?Ethereum has formed a classic CME Gap between $1,707 and $1,765, following a strong breakout. CME gaps, especially over the weekend, are statistically likely to be filled before the next major move.
We’re watching for a retest of this gap zone with a potential bounce at the lower boundary, creating a solid long entry opportunity.
Entry: 1,710–1,725 (inside the CME gap)
TP1: 1760
TP2: 1800
TP3: 1900
SL: 1,667 (below gap & invalidation of bullish structure)
Like and support us for more such idea.
Cheers
GreenCrypto

Bitcoin - CME Gap fill before going up ?Bitcoin CME Futures have formed a clear CME Gap in the $91,600 – $93,400 zone (highlighted in blue). Historically, these gaps tend to get filled before the price resumes its trend.
Price may dip into the gap zone (91,800–93,400) to fill the imbalance.
We have a entry around the lower part of the gap ($91,800–$92,200).
Stop loss: Below $91,500 to invalidate the setup.
After the gap fill, we can expected strong bullish continuation
Entry: 91600
TP1: 92800
TP2: 93500
TP3: 94500
SL Below 90500
Like and support for more ideas.
Cheers
GreenCrypto

long AEX indexthe price came back above the support and there is a CME gap between 890.4 and 897 . as long as the price holds this level it is possible we see a little short term bullish momentum to full the cme gap
long entry 840.8
stoploss 829
take profit 895

A New ( But small ) Bitcoin CME Gap has arrivedDue to price rise in Bitcoin over the weekend, we have just opened up a new Bitcoin CME Gap.
ALL previous Gaps are Filled.
CME GAPS ALWAYS GET FILLED
So, we may see PA return to fill this gap.
the only time Gaps do not get filled is when in a Major Bull Run
We are not in one yet.
These are excellent places to put buy orders.

ETH1! (Ethereum Futures - CME) Analysis Based on Gap Filling📉📈 ETH1! (Ethereum Futures - CME) Analysis Based on Gap Filling
On the daily chart of Ethereum Futures (ETH1!) on the CME, three significant price gaps can be observed. Historically, these gaps tend to get filled over time. Based on market cycles, we estimate that around 200 days remain until the end of the crypto bull cycle, after which the bear cycle may begin.
🔹 Key CME Gap Levels:
🔸 Lower Gap: $1450 - $1550 (Largest Gap)
🔸 Mid Gap: $2550 - $2625
🔸 Upper Gap: $2900 - $3200
📌 Trade Setup Suggestion:
✅ Entry: $1480
⛔ Stop Loss: $1300
🎯 Target: $3200
🔥 Risk management and confirmation signals using price action are recommended. If the price reacts at the $2550 - $2625 level, partial profit-taking could be a good strategy.
🧐 What do you think about this analysis? Do you also expect these gaps to be filled? 🤔👇
#Ethereum #ETH #CME #Crypto #Futures #TechnicalAnalysis #TradingView

ETH has two pending CME Gaps#ETH #Analysis
Description
---------------------------------------------------------------
+ ETH has two pending CME future gaps to filled.
+ First gap is around 2900-3400 range and second gap is around 2500-2600 range.
+ Sooner or later these CME gaps will get filled. I'm expecting Gap2 get filled in this or next month and Gap 1 in the second or third quarter.
---------------------------------------------------------------
Enhance, Trade, Grow
---------------------------------------------------------------
Feel free to share your thoughts and insights. Don't forget to like and follow us for more trading ideas and discussions.
Best Regards,
VectorAlgo

Bitcoin, Mind The Gap (85,720) The massive move initiated from Trumps tweet Sunday about the Crypto Strategic Reserve has left a massive gap on the Bitcoin Futures Chart. Gaps tend to get fill sooner rather than later, with a high 90% hit rate on gaps getting filled.
We could see a pullback this week to fill the gap with another run up following back above 90k to save the weekly close ... again.
We see confluence with the golden pocket (0.6128 - 0.65 Fib) here on that retracement and also the most amount of volume (VPVR) being traded there.
A final test of the demand below 90k, which if shown as support, will lead us back into the range of 90k to 110k.

CYCLE 4 | CME GAP: Bull Cycle Period First Major Pull Back?Quick post to address BTCs expected potential first major pull back into this bull run period...
BULL MARKET PULL BACKS
Historically, BTC during its bull market enjoys pull back which ranged from 15% to as much as 30%-40% in prior markets. This is essential for trader participants in the market to take profits, allow BTC to retest low levels and prove new heights are sustainable before ranging to new higher price levels.
The first pull back historically for BTC post the start of the 'Bull Run' phase of BTCs 4 year cycle is traditionally the largest pull back opportunity and historically been the best short term buying opportunity in the Bull Run (NOT FINANCIAL ADVICE).
We can expect a 30-40% correction for this pull back based on historic bull market period examples (Let me know in the comments below if you would like me to detail consistent price behaviour during BTC bull run periods in a future post).
ARE WE AT THIS POINT NOW OF THE CYCLE? WHAT ARE THE INDICATORS SAYING?
As highlighted by the RED arrow on the chart, a number of the indicators like to monitor on the weekly chat are suggesting bearish divergences and fading momentum exists with the current price action. This is calling for a cooling off period of the market.
CME GAP
Historically, BTC has had a tendency to want to 'close' open gap, created by weekend trading of BTC that does not align with equities that follow the traditional 'No Trading' over the weekend policy of Traditional Financial instruments. Hence crypto ETFs which align with these policies (such as the CME Futures chart as seen in this chart) can create 'GAP' between the open (Monday) and close (Friday) candles.
To understand CME gaps, please take the time to review the details discussion in the earlier post.
The orange BOX shows the below CME gap target that BTC price may range towards to close.
NOTE: this box has been listed as Partially Closed as the open Monday candle of the gap did go below before rising during the weekly candle but did no dip past the close of the previous weekly candle.
21W EMA & 20W SMA
Historically, a fully developed healthy bull market for BTC has required periodic retesting and holding of these moving averages. A close of the CME gap at this point of the market would also satisfy this historic trend for BTC.
ORANGE TREND LINE
Bears if eager to continue the 'close the CME gap' trend will need to convince the market by first exceeding the orange trend line. Currently this allows BTC to complete a 10 to 12% correction while also taking the price below the key psychological 100K price level, without phasing the bulls conviction to charger higher.
* Holding the Orange Trend Line Scenario: we want to see price bounce and conviction from the bulls to push BTC to higher highs. The goal for Bears would be to achieve the measured move up to 180K. This would most potentially shorted the bull run (time prospective) and potentially cap our ATH for this cycle early; creating a distribution zone similar to the 2021 cycle top.
* Breaking below the Orange Trend Line Scenario: If we break the Orange Trend Line then Bulls will concede ground to the MA levels (allowing the CME gap to also close). Bulls will write this off as a market reset and holding support at these levels will entice Traders to take positions needed to drive BTC up sustainably to the next higher level(s).
Losing the MAs would ask serious questions to the intent of BULLs and the sustainability of the market moving forward this bull run.....
