What is bitcoin CME Gap? How to use BTC gap IndicatorWhat is bitcoin CME Gap? How to use BTC gap Indicator
The 'Gap' in the CME (Chicago Mercantile Exchange) futures market, which offers a glimpse into the movements of institutional investors, is one of the key indicators many professional traders watch closely.
1️⃣ What is the Bitcoin CME Gap?
CME is one of the primary avenues for institutional investors to access Bitcoin. However, the CME Bitcoin futures market closes over the weekend (from Friday afternoon to Sunday afternoon, Chicago time, USA). Additionally, there is a one-hour trading break after market close on weekdays.
Conversely, spot exchanges like Binance and OKX, which we commonly see, operate 24 hours a day.
This difference is where a 'Gap' occurs. Especially during weekends, when the break is longer, gaps tend to be larger.
Bearish Gap: Occurs when the opening price after the CME market closes is lower than the closing price. This means that the Bitcoin price fell in the spot market during the off-hours.
Bullish Gap: Occurs when the opening price after the CME market closes is higher than the closing price. This means that the Bitcoin price rose significantly in the spot market during the off-hours.
Abrupt Psychological Shift: This implies that investor sentiment leaned heavily towards one side during the weekend.
Unfilled Order Blocks: The gap area is interpreted as a region where potential unfilled orders (buy/sell pressure) may exist.
Gap Fill Phenomenon: Many traders believe in the adage "gaps get filled" and use it as a trading strategy. This suggests a tendency for the price to move in the opposite direction of the gap, eventually attempting to cover the gap area. However, this phenomenon is not 'mandatory', and whether a gap will be filled immediately or much later must be judged through various analyses.
2️⃣ Easily Find CME Gaps
The Bitcoin CME gaps multi-timeframe auto finder indicator automates CME candle analysis and displays it intuitively on the chart.
⚡Indicator Features and Usage
Multi-Timeframe Gap Detection: 5-minute, 15-minute, 30-minute, 1-hour, 4-hour, and even 1-day candles! It simultaneously detects and displays CME gaps occurring across various timeframes. Whether you're a short-term trader or a long-term investor, you can check gaps according to your trading style.
Automatic Box and Label Display: The detected gap areas are drawn as rectangular boxes on the chart. Bullish gaps are displayed in green tones, and bearish gaps in red tones, making them easy to identify at a glance. The size of each gap (%) is displayed as a label above its respective box.
Highlight Function: Large gaps above a set threshold (e.g., 0.5%) are highlighted with an emphasized color. 'Big gaps' can have a greater impact on the market, so they should be noted.
Chart Price Synchronization: The price of spot charts from other exchanges may differ from the CME futures price. This indicator adjusts the price of the gap boxes to the price level of the chart you are currently viewing via the "Chart_price" mode. By using the "Chart_price" mode, you can more intuitively grasp the price level of the gap box on the spot chart and make direct trading plans on the chart of another exchange you are viewing.
Real-time Alerts: You can receive real-time alerts when a new CME gap is detected. You can also set alerts to notify you only about gaps from a specific timeframe. This is extremely useful when you can't continuously watch the chart during weekends or specific times on weekdays.
3️⃣ Trading Strategies
💡Gap Fill Strategy:
When a Bullish Gap Occurs: If the price breaks above a bullish gap but then falls back into the gap area attempting to fill it, one might consider a long position near the bottom of the gap, or a short position if the price fails to rebound from the top of the gap. Alternatively, a strategy of considering a short position in a resistance zone before the gap is filled is also possible.
When a Bearish Gap Occurs: If the price breaks below a bearish gap but then rises back into the gap area attempting to fill it, one might consider a short position near the top of the gap, or a long position if the price fails to fall from the bottom of the gap. Alternatively, a strategy of considering a long position in a lower support zone before the gap is filled is also possible.
💡Utilizing as Support/Resistance Areas:
Old CME gap areas can act as strong support or resistance lines when the price retests those levels in the future.
Observe whether the price encounters resistance and falls again when it reaches the top of a bearish gap, or if it finds support and rises again when it reaches the bottom of a bullish gap. Gaps that overlap across multiple timeframes can hold even stronger significance.
💡Trend Confirmation and Reversal Signals:
If a strong bearish gap occurs and is not immediately filled, but the price continues to fall, this could indicate the start or continuation of a strong downtrend.
If a strong bullish gap occurs and is not immediately filled, but the price continues to rise, this could indicate the start or continuation of a strong uptrend.
You can use the price movement after a gap occurs to gauge market momentum and apply trend-following or trend-reversal strategies.
For example, if a bearish gap occurs but is quickly filled within a few days and breaks above the top of the gap, this could be interpreted as an early sign that the bearish market has ended.
💡Multi-Timeframe Analysis:
When looking for key support/resistance levels, check not only the gaps of the current timeframe you are viewing but also gaps from higher timeframes (e.g., 4-hour or daily gaps on a 1-hour chart).
Gaps from larger timeframes are areas of stronger market interest. When making trading decisions in smaller timeframes, consider the location of important gaps from higher timeframes for risk management or to set entry/exit targets.
Short-term Gaps (5m, 15m): Most gaps occur within 1% and can be utilized for short-term volatility, high-leverage scalping, or day trading. They are suitable for quick entry/exit strategies, with caution against whipsaws. They tend to be filled before the 4-hour candle closes after the market opens.
Medium-term Gaps (1h, 4h): Can be referenced for swing trading or position trading. They can become significant support/resistance areas depending on price movement after the gap occurs.
Long-term Gaps (1d): Can act as major turning points in market trends or as important support/resistance levels from a long-term perspective. If a 'big gap' occurs, the possibility of a shift in the market's overall direction should also be considered. They usually occur during the weekend off-hours, and sometimes large gaps of over 3% occur.
A weekday short-term gap that was filled 4 hours ago.
A weekend long-term gap that saw a trend increase after a 4% big gap occurred.
4️⃣ Conclusion
The 'Bitcoin CME Gap Multi-Timeframe Auto Detector' indicator is a powerful tool that helps you not miss crucial price fluctuation points in the market.
However, no indicator should be blindly trusted. Gaps may not be fully filled, or the price may immediately break out in the opposite direction after surpassing a gap. Instead of relying solely on gap filling, it is crucial to analyze it in conjunction with other indicators to increase your win rate.
We hope you utilize the information gained from this indicator and combine it with your existing analysis methods (chart patterns, auxiliary indicators, macroeconomic analysis, etc.) to build more sophisticated trading strategies.
📌If this content was useful, please support us with a boost and comments. Your small encouragement is a great strength for creating better analyses and content. By following, you can also receive notifications about our postings
Cmegaps

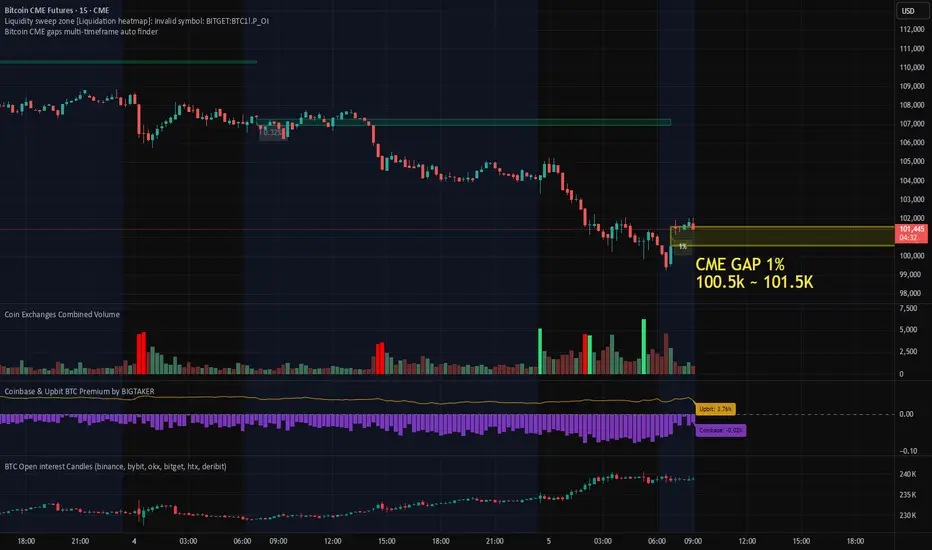
1% Bitcoin CME Gap Formed, Futures Market Data AnalysisThis morning, a ~1% gap formed on the Bitcoin CME futures chart.
Given that the gap occurred after a sharp decline, it’s important to consider the possibility of both a gap fill and a retest of recent lows in the short term.
The Coinbase Premium remains in negative territory, though it has shown slight improvement compared to yesterday, suggesting that U.S. spot selling pressure has somewhat eased.
In addition, Open Interest has increased, with data indicating a rise in short positions.
This suggests that selling pressure has been building during the recent decline, which may lead to a period of heightened short-term volatility and consolidation before the gap is fully filled.
Summary:
CME Gap Range: Approximately 1%
Market Structure: Short-term downtrend followed by consolidation
Coinbase Premium: Still negative, but slightly improved
Open Interest: Increasing (inflow of short positions)
📍In the short term, it is crucial to monitor whether the price enters the gap fill zone and retests the recent lows, while maintaining support at 98K, which remains a key short-term level.
BTC CME gap was formed at 66537$KUCOIN:BTCUSDT
CME gap was formed at ~66113$
We hope that it will not be filled in the coming days 🙃
FYI: ±90% of CME gaps are filled sooner or later (it may be in a week, or maybe in a month).
Keep this in mind.

Patterns, CME Gaps & Golden Pocket RocketCheck notes on the chart.
1) Bearish Rising Wedge
2) Descending Triangle
3) Ascending Triangle
Expansion Creating CME Gap, aka Futures Liquidity Gap. (These almost always get backfilled.)
4) Current Pattern, Bullish Ascending Channel.
We had a fake out to flush the longs, and create liquidity, and to backfill the CME Gap.
All other narratives are fun stories.
We have since course corrected violently, failing to break out of the previous range, creating a Swing-Failure , which is locally bearish. This likely retraces to 23k, before a continuation higher to fill the next CME gap around $27,355 and $28,740 .. of course some profit taking, or other exogenous events such as the indexes falling could correlate with some pull backs, but ultimately I'm expecting 35k to fill this year.
Strong resistance there, likely to struggle to get above.
If it does, the next gaps that could be liquidity grabs are
$45,000-$46,500
$52,500-$53,500
I don't believe we see a new ATH this year or next. 2025 is my target for ATH, which I believe we be a minimum of 130k and a max of 180k. I will scale out of positions between those two prices.

BITCOIN - CME Gaps #BTC $BTC💰 #BTC is between two CME Gap right now☝️
⬆️Higher CME Gap | 27.355 - 28.920
⬇️Lower CME Gap | 19.550 - 20.985

BTC CME gaps#BTC1!
#Bitcoin #CME futures
$BTC dropped and filled the gap between $26650 and $22860, and the support zone hold the bears for now.
🐮 so we probably see a pullback to resistance zone around $30k that there is a gap zone between $27355 and $28920.

BTC/USDT 3-Major CME gaps need to be filledAs per CME Gap finder tool, Market must fill the gap created and as are shown on the charts.
Comment If you think I am predicting accurately?

BTC short term agenda Bullish Engulfing confirmed on 2h timegrame
CME gap between 19,4k - 18.5 almost filled
MACD trend changed to bulish
BB median movement changed to bulish
3rd Elliot wave down completed
Going for 4th, which is a small ride till 20,7k (8%)
Enjoy it :)

BTC CME Gap$BTC CME Gap Update
As We Can See In The Chart 📈
It's Finally Filled The Gap Between ($24605 - $26080) In Weekly Time Frame 📊....

4 Reasons why the BTC Bottom could be CloseINDEX:BTCUSD
In today's video I look at 4 reasons why I think we are close to the bottom:
1. 200 week MA - historically the 200 week MA has indicated the bottom
2. Fibonacci golden pocket retracement - a fib pulled from the very start of bitcoin in July 2010 to the all time high, show a zone for the possible low
3. Weekly RSI - historically we have never gone below a certain level and we are nearing that level
4. CME Gaps waiting to be filled - there is a gap that is about to be filled
These four factors are aligning very well with weekly and daily support levels that BTC is nearing.
Could this be the bottom or close to it?
Have a look at the video and let me know in the comments what you think.
Not financial advice. DYOR. Papertrade before using real money.
If you liked this idea, please give a thumbs up and follow.
Safe trading.
Shawn

BTC SHORT TERM OUTÑLOOKBTC is currently overbought and needs a pullback to retest $41K-$42k for much stronger upward move ahead. You could also view through the CME gap around the $42k which we expect to fill before the weekly closing(Friday).
At this point I will be opening a short position around the 44k-45k targeting the CME gap around 42K.
CME gap fillingHello guys
You see the market trying to fill cme gap and its near.
Have good trades friends 🙏


BTC Bitcoin CME Gap DiscussionHello friends, I am showing you the CME gaps I circled for Bitcoin (BTCUSD) on a 1D linear chart that I was able to spot. The CME gap is the difference between the trading price of a CME bitcoin futures contract when the market closes on Friday and opens on Sunday. The reason I am showing this chart is because though CME gaps are formed, the price tends to get back to that gap and fill it at some point. Since price is near certain prior gaps, there may be a chance the CME gap gets filled.
Not everyone believes in CME gaps, but this is another metric to review when looking at Bitcoin and the crypto markets.
If you enjoy my ideas, feel free to like it and drop in a comment. I love reading your comments below.
Disclosure: This is just my opinion and not any type of financial advice. I enjoy charting and discussing technical analysis . Don't trade based on my advice. Do your own research! #cryptopickk

#CME vs #BitcoinHello Padawans,
This is a quick update about CME gaps, which are near the current price.
And the last Friday close was around $38180.
FYI: ±90% of CME gaps are filled sooner or later.
Keep this in mind.
Let's see what will happen next,
Cheers,
may the force be with you!

BTC/USD : Where are we heading first ? COINBASE:BTCUSD BINANCE:BTCUSDT
Hello everyone 😃
Before we start to discuss, I would be glad if you share your opinion on this post's comment section and hit the like button if you enjoyed it !
#BTC has broke below the 47K's level and it just reached the lower order-blocks on most of the exchanges at $42K.
However most of the analyzers believes that the Ever-Grande fundamental cause the dive; But I believe that we had the sign on NVT signal's Indicator earlier !
Now it's moving below the FIB retracement 0.5's level and has been rejected by Higher S/R zone.
As we are holding below this zone, #BTC won't remain bullish in Short-Term and Mid-Term at all; But any hold above will give us this possibility to fill the Gap above...
CME gap has formed and it's located on ( $53490 - $49360 ) and so we all know that it we'll filled sooner or later; 96.7% of CME gaps has been filled since it's been started to run.
But as #BTC moving below the S/R zone, It'll be targeting the lower S/R zone located at $44500.00.
Also the master candle's half wick is located on $44245.00; So we can say that will be a fresh retest to gain the momentum to fill the CME's gap above.
📚 Why do I mentioned $44245.00 ? It's a little trick for price action scalpers to use the chance as a possible support level to gain advantage in short-term scalps !
For example you can take look on Sep.7th and Oct.13th candle's wick and how the next candle react to the shadow's below..
📍 Have to mention that in my side, the bull cycle is over for now and the bears have the powerful hand on the movement; So it's very possible for bears to cause another dive into $40550's main retest as the Demand zone is standing there !!
- Any break below $40K will charge charge the dump into lower mid-range channel to retest the bullish order-block located on $32K.
📊 Now you may ask your self what are the range channels and wick's half ? Follow me !
As you can see on the chart below, I mentioned the Moon-Lines and the wick's half as we're approaching them both.
You're able to see that #BTC is moving in a formed zones; This zones have 5 levels and we'll discuss about the Higher range zone and the Mid range zone !
Currently #BTC is moving in the Higher-range zone which means that the macro view is still suggesting the new ATH and bulls into advantage.
However the bias will be changed into neutral after we break below the $40550's support level !!
That's why I mentioned the $40K's Demand zone as our main retest zone before any major leg-up cause it'll be defended by bulls for 100%
Now that We talked about the support level and the pressure zones; It's the time to have a look into different FIB's chart; Deployed by logarithmic chart and logarithmic Fib !
📊 Is there any difference between log FIB and Linear FIB ( Classic FIB ) ?
Answer is yes; Why ? Cause if we look into the Linear chart, We'll notice that the $40550 level is below 0.618 FIB's level, Which means that the bull-run has been ended for surely good.
But on the Logarithmic chart below, You'll find-out that there's a FIB level located on the Demand zone we mentioned before 😉👇🏼
You can see that we still have the space to retest the lower levels on logarithmic chart and it's why I don't believe that we currently standing on the local dip.
We might experience and I would fill my bags for mid-term there !!
Hope you enjoyed the content I created, You can support us with your likes and comments !
Attention: this isn't financial advice we are just trying to help people on their own vision.
Have a good day!
@Helical_Trades

BTC down when Amazon denies BTC paymentsAs we didn't expect - the rumours about BTC payments pulled BTC price higher than H1 downtrend channel.
As we expected than - a good bounce from the resistance of 40500 - 40000 to the level of 37000 - 36500.
The price now is about 37000 and we should share our trading ideas with you.
The main thing is that we are still in a major sideway correction.
It is on the way, and we can see the real efforts to brake the downtrend and move up again (but not now).
There still was no real downtrend correction, as you can see it in the chart.
Probably BTC can move higher, but not so high as the Binance squizze (LOL).
Please also mention that now we have a HUGE GAP on 34550 - 32450 that can be closed in this week.
So we are again looking for a good SHORT position and will keep in touch with more good ideas from Scalper Season Team.
If BTC will be stable for few days higher than 42000 - 41000, than we can expect it above 57000 - 55000.

Filling old CME gaps...This is just a crazy analysis of the possibilities of filling an old CME gap, mentioned at $9,700-$9,850.
The past few days and weeks have been very volatile with huge, possibly coordinated and sustained dumps. So what are the possibilities of going lower? What could be the bottom?
As we are now at another unexpected crossroad in the crypto saga, we will all be looking for answers and potential scenarios of what will happen next. As much as the fundamentals of crypto have never been stronger, short-term uncertainty will always loom over our heads. Oftentimes we will look at indicators, trendlines, levels, news and social sentiment for answers. But the market does what it does, and whales do what they do, so we are all just left with best guesses.
One interesting factor for the movement of crypto is CME gaps. There will be many CME gaps on the way up, and most will be filled quickly. Some may never be filled, and some could be filled after a long time, sometimes by unexpected events like the coordinated dump going on at this time of writing.
We are currently hoovering below $40,000 and a daily close below $37,250 could lead to a much deeper drop. I will be speculating on how low it could, go based on unfilled CME gaps and somewhat arbitrarily placed trendlines and Fibonacci levels, possibly leading to a worst case scenario of filling an old CME gap.
The biggest unfilled gap would be one at $9,700-$9,850, with another mentioned at around $3,000. I can't actually see the gap in my chart on any timeframe, but it is mentioned in these articles... Edit: I had to remove the links to the articles to post this piece, but they can easily be found by Googling "CME gap 9700".
(Removed link...)
On the chart I have also indicated some of the more recent unfilled CME gaps found on the Binance chart. Some are micro-gaps of of $0.01, and some are bigger. Will they still get filled? Could it happen due to the coordinated dump, leading to a flash-crash, and will the drop be exasperated by government regulation, environmental concerns and eroded confidence in Bitcoin due to manipulation?
Back to the CME gaps...
Some CME gaps on the 15 min timeframe that I have identified are found at:
$33,500.00-33,534.58
$32,299.84-32,438.06
$21,331.69-21331.70
(there could be more...)
What could be the levels we hit? Well, I was once taught that confluences are strong indicators, and by drawing up some trendlines and Fib levels we can check if there are any confluences worth noting...
With a Fib retracement from the recent peak of $64,854 on April 14, 2021 to the low of $3,782.13 in March 13, 2020, we can see that we have levels at:
$51,784.62
$41,524.55
$34,318.07
$27,111.58
$18,195.09 (level to note)
And with another Fib retracement from the recent peak to the recent dip at $43,960 on April 25, 2021, we get a closely coinciding level at $17,928.97 as a level to note.
This would indicate a strong support/resistance level can be found at around $17,928.97 to $18,195.09, as can be seen in the chart. We could bounce here, but dropping below this could lead to a much deeper decline, possibly to the next Fib confluence level. So where could that be?
Well, drawing a a Fib retracement from the recent peak to the recent drop to $30,000 gives us a Fib 1.68 level at $8,460.23.
Drawing yet another Fib retracement from the Jan 9, 2021 peak to the Jan 22, 2021 drop, gives us a closely coinciding level at $8,576.46 (Fib 2.618).
This would indicate a strong support/resistance level at $8,460.23-$8,576.46, a bit below the mentioned $9,700 CME gap.
Furthermore, drawing a trendline from the Dec 17, 2017 peak to the Aug 17, 2020 peak leads us to a point just above the CME gap at around $10,375 if looking at our current date (May 22, 2021). The further in time we go, the lower this level will be, and we don't know how long this dump will go on before it reaches its target. By August 20, 2021 we would be below the line, if the bearishness would go on that long. A flash-crash would naturally bring us below the trendline much sooner.
Hitting this trendline would be sort of a second retest of the "breakout" of our current bullrun, if we can consider the start at Jun 20, 2020. With some panic leading to a flash-crash, eroded confidence in Bitcoin and Crypto, we are not to far from hitting the CME gap at $9,700-9,850 and potentially staying there long enough to fill it.
Will this ever happen?? It's far-fetched, but nothing is certain or impossible in the world of crypto. Especially not with huge market manipulators controlling a majority of the assets and governments fighting for control of our old and future monetary system.
Where could we go after a drop to the CME gap? With a Fib grid from the low of $3,782.13 to the peak of $64,854 we can find the 1.618 Fib level at $102,596. The 1.618 level is a level that often gets reached. The next level would be $163,668. Will this happen, if so when and how long would it take? We'll just have to wait and see.
This is just an exercise I made for fun, and not financial advise of any kind.
Be safe trading, do your own research, and be kind if you leave a comment. =)

After close of the gap from weekend 24-25.04 now 2 up and 6 downgap from weekend closed, now we can close the ol ones below ;)

Ethereum ST (February 1st 2021)Ethereum/USD (February 1st 2021 through March 2021)
Low: $1,302
High: $3,302
Wanted to come up on another update for Ethereum before the big Chicago Mercantile Exchange futures launches on February 8th.
I think 5 important short term future levels to watch for could be $1,570, $1,901, $2,436, and $2,971-$3,302. I specifically want to see bearish reactions off of those levels, the 1.27 could be important too but maybe not as important as these other fibonacci levels.
I think with the introduction of CME futures for Ethereum, price could get extremely volatile. It may get a glorious pump but it may end in terrible devastation too. Bitcoin's CME futures launch was January 13th 2020, and Bitcoin managed to pump up to mid-February before it took another month to crash. But at that time, things were fundamentally different and Bitcoin had already been in a months-long major downtrend. Ethereum could still be in a major uptrend but if this crash I've been theorizing about comes, it could be far worse than March 2020.
There could be some decent volatility this week before it really starts pumping, but when it gets going it will probably be insane. If a real crash happens after, we could see prices back under $600 for sure. This will be very unpopular, but in my opinion, Ethereum could go back under $100 by the time the bear is done. For now, the market euphoria may only increase more and more.
The red box is my predicted range for Cindicator forecasting this week.
Related ideas attached below:
Thanks for tuning in :) Disclaimer, anyone in the trade needs to do their own due diligence and decide what is right for YOU. My charts can be wrong at any time and it's very important that you have your own strategies and plans in place. I run this channel for my own educational purposes of learning to trade, and I will never be 100% right, so please do not let me confirm any bias for you! (Dangerous to do so, stay safe and remember the basics & rules of risk assessment.) Expect the unexpected and happy trading!


BTC1! FUTUROS DE BITCOIN CME - GAPBuenos días!
*Esta idea a través de Tradingview no es sinónimo para entrar posiciones en corto* primero debemos hacerle un seguimiento a la debilidad en la tendencia actual.... para un retroceso fuerte como lo vemos en el patrón de barras proyectado. no debería superar el máximo anterior $12.635. Para empezar a caer con fuerza en primera instancia, rellenar GAP, ubicado entre los ($9.665 - $9.925). una vez alli un rebote de gato muerto y seguir la tendencia bajista. finales 2020 e inicios 2021
