we shall see a good amount of increase in POPCAT price !It seems the price is forming a head and shoulders pattern, which, if correct, suggests a good price increase in the coming days. However, we should wait for the pattern to fully complete.
Best regards CobraVanguard.💚
Cobravanguard

XRP Technical Outlook: Channel Break Could Signal New Highs !!The price is currently moving within a bullish channel and may reach the upper boundary of this channel. If the channel is broken to the upside, we can expect a new all-time high (ATH) for Ripple.

ADA - Time to buy again!The price can form a head and shoulders pattern. If that is happen, expect a significant price increase.

Do you think I'm joking ???As you can see, the price is forming two bullish patterns on the 4h timeframe, If my view is correct, btc will rise to $100k
And if this pattern is correct and breaks, higher targets are possible.
previous analysis

I think the only one Liking my post is me!The price on the 4h timeframe is within an ascending triangle, which can be promising. If the price breaks this pattern with bullish candles, it could easily rise by the distance of AB=CD.

Nothing !!!As you can see, the price is forming two bullish patterns on the 4h timeframe, If my view is correct, TON will rise to $1.9
And if this pattern is correct and breaks, higher targets are possible.

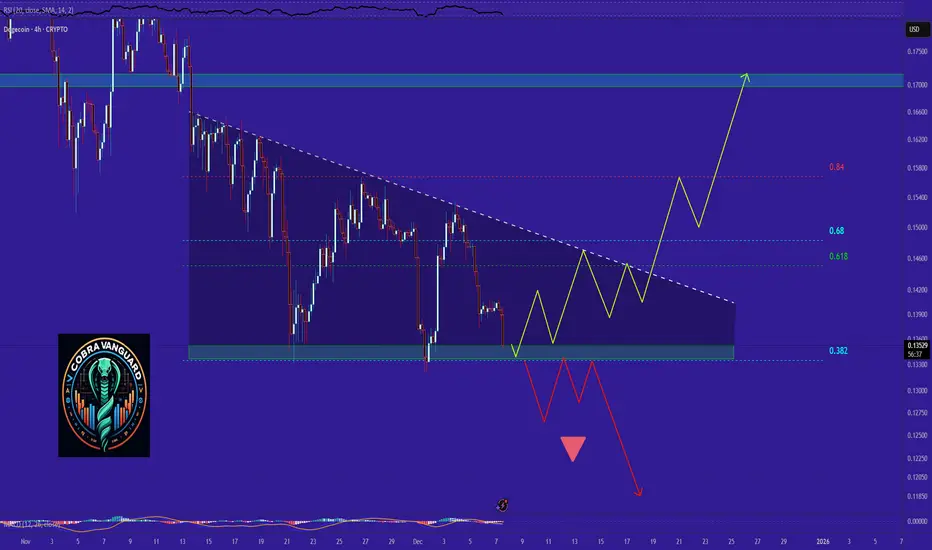
This is my last hope for Dogecoin !!This is my last hope for Dogecoin. If this support is lost and the descending triangle pattern proves valid and the price follows it, Dogecoin will fall below 10 cents for a long time. But since the crypto market often breaks rules and patterns, maybe this time it will reverse again and, after breaking the triangle, push the price back above 17 cents.
What do you think will happen? Leave a comment !
bitcoin - Time to buy again!The PRZ zone has provided strong support for the price, and now Bitcoin is at a critical level. It seems that $103000 could be the next target.

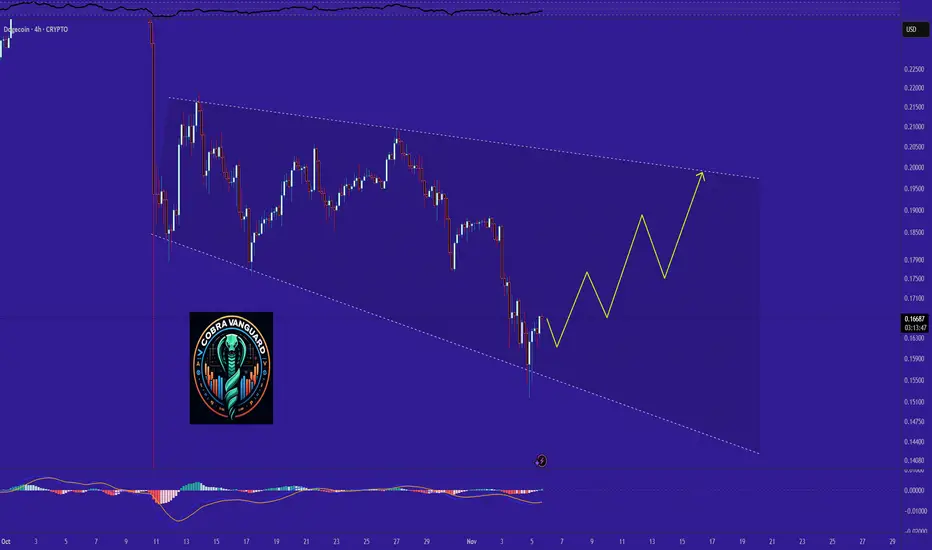
DOGE It will grow soon...So if you pay attention to the DOGE chart you can see that the price has formed a Ascending wedge which means it is expected to price move as equal as the measured price movement.( AB=CD )
NOTE: wait for break of the WEDGE .
Best regards CobraVanguard.💚

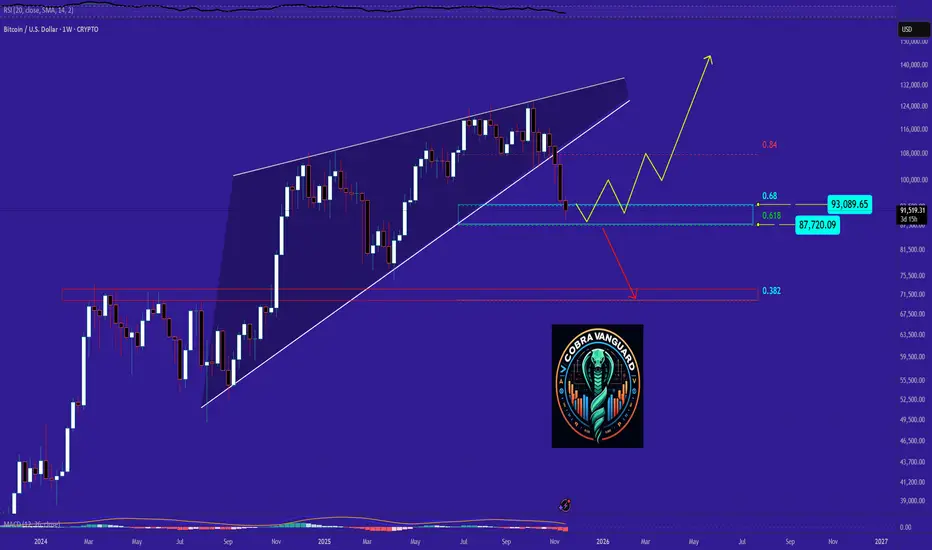
bitcoin Outlook after the Dip. What to expect NOW?After breaking out of the descending wedge, the price has reached a very strong PRZ (Potential Reversal Zone) support area. If the price holds this zone, there is hope for a rebound toward new highs. However, if this support fails, the price could drop below $70,000.
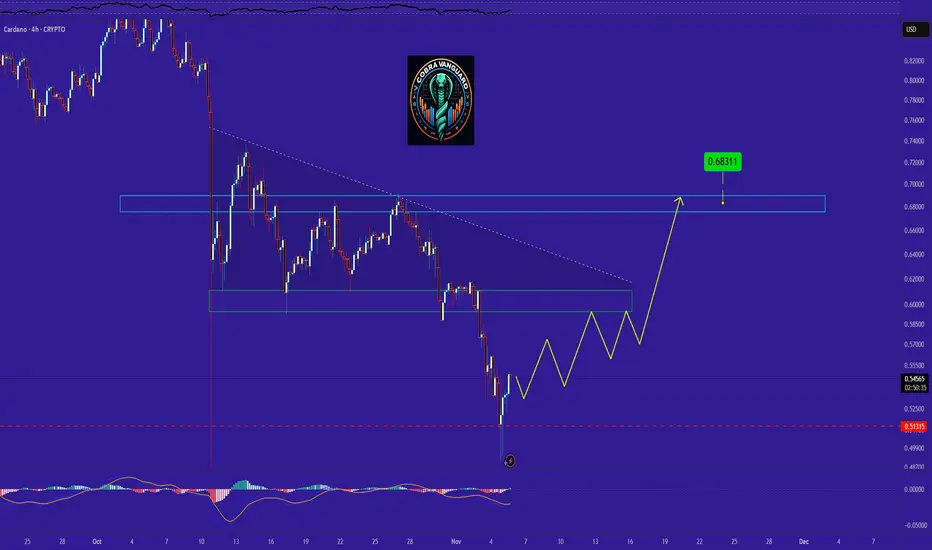
My only remaining hope for CARDANO !!! if you pay attention to the ADA chart you can see that the price has formed a Ascending FLAG which means it is expected to price move as equal as the measured price movement.( AB=CD )
NOTE: wait for break of the FLAG .

Did you Know ?!!!The price can form a head and shoulders pattern. If that is happen, expect a significant price increase.
Did you really think that profiting from the current bull run (a comprehensive upward market) would be easy? Don't be naive. Do you think they will let you buy, hold, and sell at low levels without any struggle? If it were that simple, everyone would be rich. But the truth is: 90% of you will lose. Why? Because the crypto market is not designed for everyone to win. They will shake you. They will make you doubt everything. They will panic you and sell at the worst possible moment. Do you know what happens next? The best players in this game buy when there is fear, not sell; because your panic gives them cheap assets. This is how the game goes: strong hands feed off weak hands. They exaggerate every dip, every correction, every sale. They make it look like the end of the world so that you abandon everything, and when the market starts up again, you'll sit there saying, "What the heck just happened?" This is not an accident. It's a system. The market rewards patience and punishes weak emotions. The big players already know your thoughts. They know exactly when and how to stir fear to make you give up. Because when you panic, they profit. They don't play the market. They play you. That's why most people never succeed. Because they fall into the same traps over and over again. People don't realize that dips, FUD (fear, uncertainty, doubt), and panic are all part of the plan. But the winners? They digest the noise. They know that fear is temporary, but smart decisions last forever. We've seen this hundreds of times. They pump the market after you sell. They take your assets, hold them, and sell them to you at the top, leaving you with nothing, wondering how it happened. Don't play their game. Play your own.

Trading Alert (BTC)Well, the price is expected to drop to $88k due to the candle closing below the $100k level

Trading Alert (BTC)4h +Trading Alert
• Watch for a long trigger when price reaches the green support zone and the green circle
• Add to your scalp sell watchlist if price approaches the black resistance area
• Targets should be evaluated in accordance with scalping rules and risk management
✅ Good luck and stay sharp!

SHIBA's situation+next targets and expected movementsIt seems the price is forming a head and shoulders pattern, which, if correct, suggests a good price increase in the coming days. However, we should wait for the pattern to fully complete.
Best regards CobraVanguard.

My only remaining hope for bitcoin !!!I might be wrong and this might never happen, but it might come true From a technical perspective!!!

It might let us down once again !!!Cardano’s price on the 1-hour timeframe is forming an ascending triangle pattern.
If this pattern breaks to the upside, there’s hope that the AB leg will equal the CD leg, potentially pushing the price up to around $0.60.
However, since crypto often disappoints expectations, it might let us down once again—so stay cautious.

Do you think I'm joking ???The price is currently moving within a bullish channel and may reach the upper boundary of this channel. If the channel is broken to the upside, we can expect a new all-time high (ATH) for Ripple.

Be careful with bitcoin !!!As you can see, the price has dropped significantly after breaking the head and shoulders pattern, and now,with some price stabilization—it could potentially return to its previous highs

ADA at the Brink Breakdown or Breakout?The price has already dropped, and now it's time to buy targeting the $0.70 range.
DOGE Outlook after the Dip. What to expect NOW?The price could rise from here to the top of the wedge, potentially reaching around $0.20.
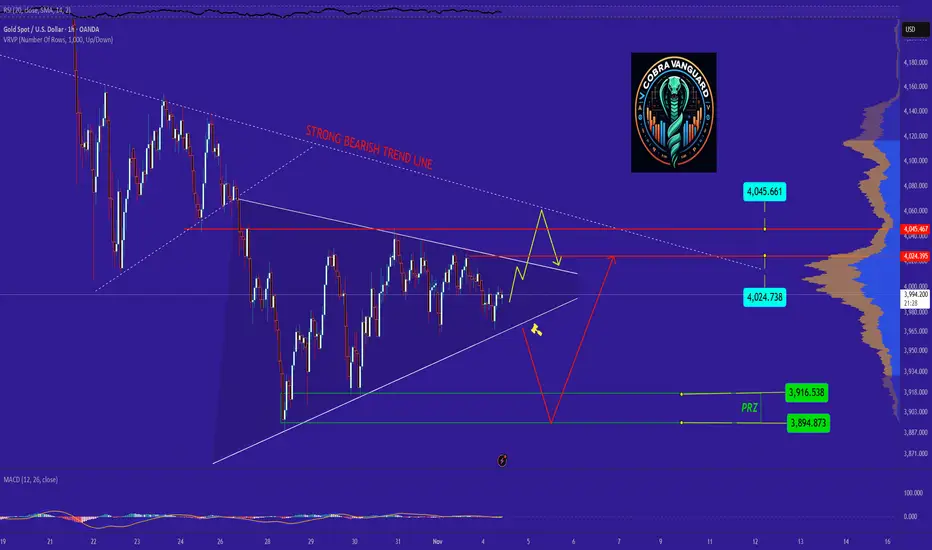
GOLD at the Brink Breakdown or Breakout?GOLD at the BrinkBreakdown or Breakout? —if the triangle breaks downward, it could fall toward the bearish PRZ zone. But if new positive news or rising Middle East tensions emerge, there's hope for a bullish move. For now, the news remains neutral.
What do you think—will GOLD fall or rise?
Bitcoin at the Brink: Breakdown or Breakout?Bitcoin is on the edge of a cliff . If this channel breaks downward, Bitcoin could fall below $100,000. But if the price respects this PRZ (Potential Reversal Zone), we can expect a solid rally toward $111,000, then $117,000, and eventually $125,000.
What do you think—will Bitcoin fall or rise?
