FIL Is Losing Bearish Momentum => Bullish Takeover Soon?📉FIL has been printing a series of progressively weaker bearish impulses, first a big drop, then a smaller one, and now a flat one.
This loss of bearish strength is happening while price is hovering above a major demand zone (orange), a level that previously triggered a massive rally.
📉📈Notice how the bearish swings are curving and flattening (dotted pink curve). This is often an early sign that sellers are exhausting.
⚔️As long as FIL remains above the demand zone, we will be looking for bullish reversal setups, especially if price retests the orange zone one more time and rejects it.
🏹For the bulls to take over entirely, price needs to break above the blue consolidation zone, confirming a shift in momentum.
Do you think FIL is gearing up for a bigger move? Let me know below! 👇
⚠️ Disclaimer: This is not financial advice. Always do your own research and manage risk properly.
📚 Stick to your trading plan regarding entries, risk, and management.
Good luck! 🍀
All Strategies Are Good; If Managed Properly!
~Richard Nasr
COIN-M

COINBASE entering a brutal Bear Cycle. 1st Stop = $150Coinbase (COIN) has been on a strong decline since its July All Time High (ATH) and right now is within the 1W MA50 (blue trend-line) - 1W MA100 (green trend-line) range. This is similar so far to the correction phases since March 2024 that found a bottom on the Support Zone but more importantly looks identical to the start of the 2022 Bear Cycle.
Based on the latter, after the current 3-wek consolidation is over, the stock should decline more, towards the 0.236 and 0.382 Fibonacci levels. The latter is where the Support Zone is, hence our medium-term Target is $150.00 (marginally above).
If the Support Zone breaks and the market keeps mirroring the 2022 Bear Cycle, we are looking at a brutal sell-off that could be as low as $54.00 (Fib 0.786) and $32.00 (Fib 1.0). Notice that in 2022, the most efficient bottom buy signal was given initially by a massively oversold 1W RSI (nearly 20.00) and finally confirmed by a Higher Lows Bullish Divergence of the same indicator. Use that to time the bottom to your advantage regardless of the price and buy for the next long-term Bull Cycle.
---
** Please LIKE 👍, FOLLOW ✅, SHARE 🙌 and COMMENT ✍ if you enjoy this idea! Also share your ideas and charts in the comments section below! This is best way to keep it relevant, support us, keep the content here free and allow the idea to reach as many people as possible. **
---
💸💸💸💸💸💸
👇 👇 👇 👇 👇 👇

MARA HIGH PROBABILITY BUY SETUP SOON!!!🚨 MARA HIGH PROBABILITY BUY SETUP 🚨
* Here We Can See Clearly The Next Potential Moves For MARA Coming Hours/Days.
* Keep Your Eyes Close On Your Trading Positions.
* Happy PIP Hunting Traders.
FXKILLA.

COINBASE Still looks strong!NASDAQ:COIN Coinbase appears to have printed completed 2 of (V), extending the targets to the upper boundary trend-line and R4 weekly pivot, $718.
Price found support at the weekly pivot just above the weekly 200EMA and lower trend-line.
🎯 Terminal target for the business cycle could see prices as high as $718 based on the weekly pivots
📈 Weekly RSI has reset below the EQ.
👉 Analysis is invalidated below wave (IV)
Safe trading

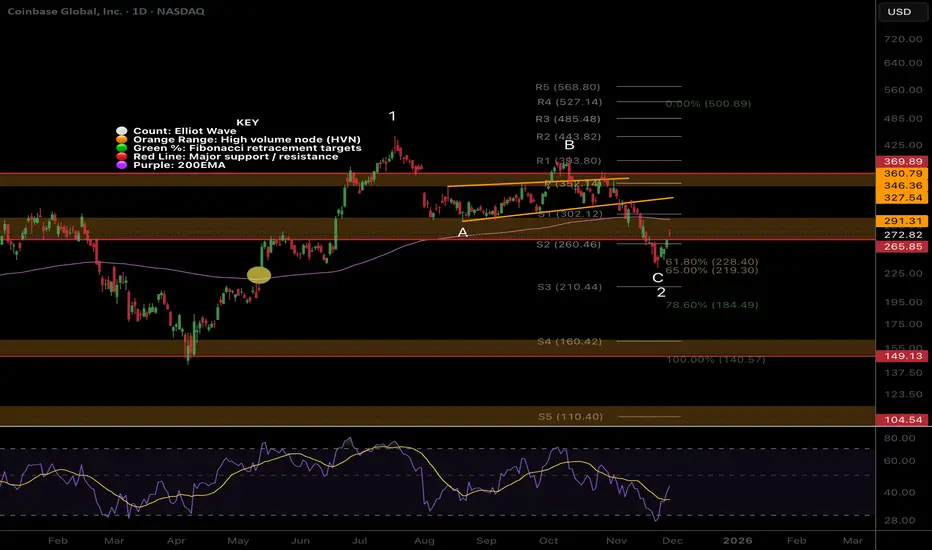
COIN bottom forming? Wave 4 changed to wave 2NASDAQ:COIN Price appears to be completing wave C of IV, a corrective pattern to the downsid,e expected to be shallow
Wave 4 was invalidated due to the retracement depth becoming wave 2 of V, which actually presents a bigger target for the wave 3 move to come. Price stopped at the golden pocket reflecting its higher cap characteristics.
📈 Daily RSI has printed a confirmed bullish divergence from oversold.
👉 Continued downside has a target of the S2 pivot at $210
Safe trading
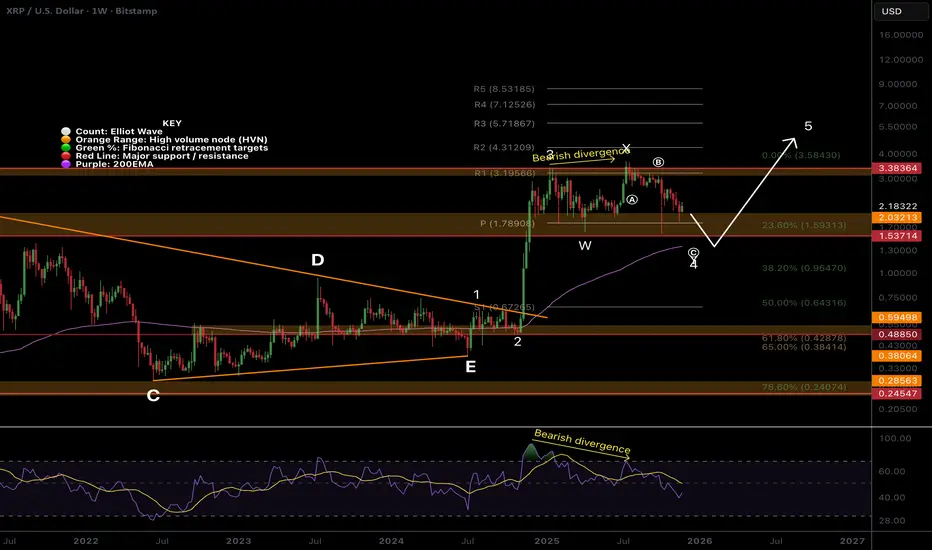
$XRP count changed, wave 4 underwayCRYPTOCAP:XRP Wave 4 appears to be a flat correction defined by the poke above the all-time high. Wave 4 is expected to end at the 0.382 Fibonacci retracement, also the weekly 200EMA ~$1.2.
The multi-year triangle is a penultimate move, so continuation in wave 5 to price discovery is my preferred count. For no,w price is stuck in a range aboev the weekly pivot.
🎯 Terminal target for the business cycle could see prices as high as $4.31 based on the weekly pivots
📈 Weekly RSI is bearish with room to fall after printing bearish divergence
👉 Analysis is invalidated if we fall below $0.64, as wave 4 can not go below 0.55 Fibs
Safe trading
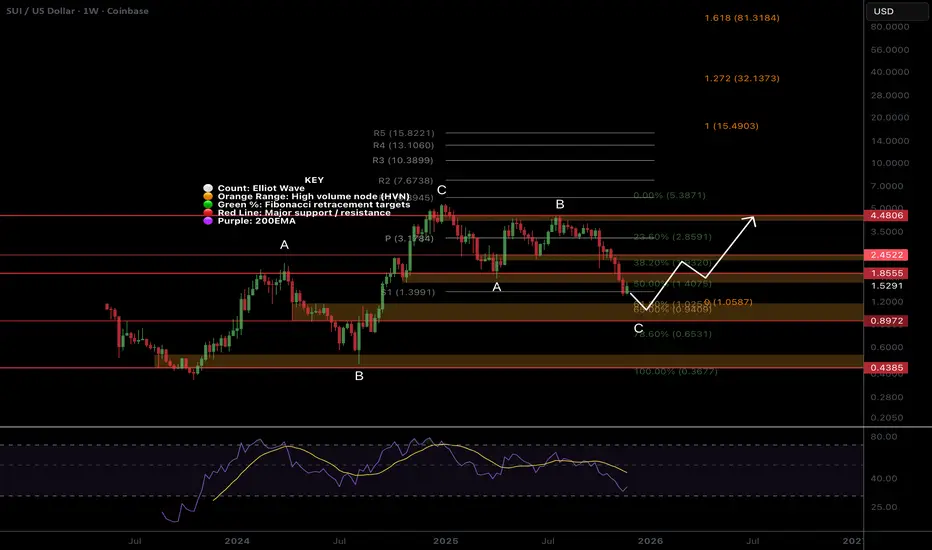
SUI Macro outlook changed...Price appears to be near the completion of a wave C correction.
Price is falling below the S1 pivot, bringing up the next target of the golden pocket and High Volume Node. There is no weekly 200EMA. The series of macro ABC’s suggests upside targets may be limited to the R3 pivot.
🎯 Terminal target for the business cycle could see prices as high as $10 based on weekly pivots
📈 Weekly RSI is bearish, almost oversold with no divergence
👉 Analysis is invalidated below wave B at $0.43
Safe trading
Sol continues to hold up strongCRYPTOCAP:SOL is holding up well with only a shallow retracement to the 0.382 for wave (4)- the weekly 200EMA.
Price is above the weekly 200EMA, which is bullish, but lost the pivot, which is bearish, giving the overall pattern ambiguity. Wave C is underway, but looks near completion at wave 4’s expected Fib targets.
🎯 Terminal target for the business cycle could see prices as high as $660 based on weekly pivots
📈 Weekly RSI is bearish with room to fall, but doesn’t often reach oversold.
👉 Analysis is invalidated if we close back below $50, as wave 4 can not go below the 0.5 Fib.
Safe trading

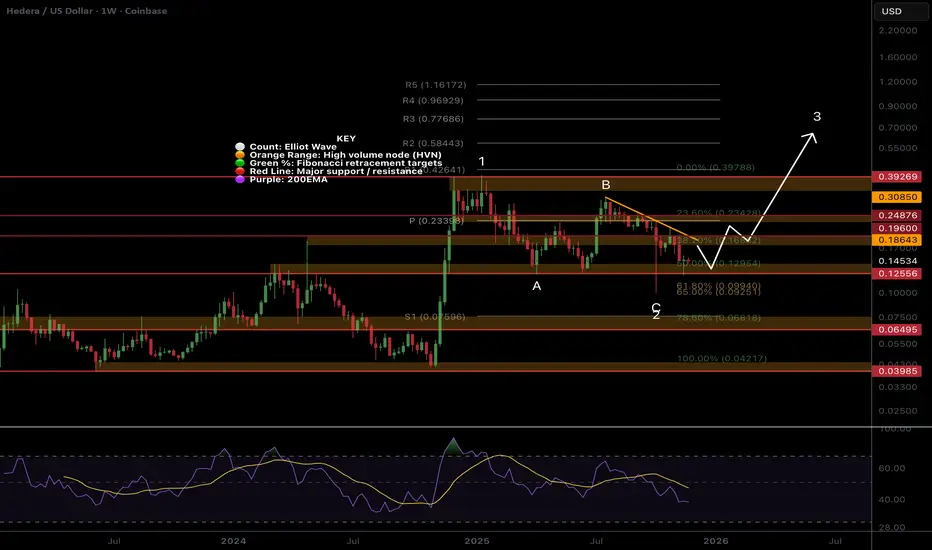
HBAR still holding strongCRYPTOCAP:HBAR Price has printed a textbook ABC for wave 2, but as long as we are below the descending trend-line, the probability is lower still. The wick has now been revisited, which is expected behaviour.
Price is below the weekly pivot. The next downside target is the S1 pivot at $0.075, which is also the alt-coin golden pocket, 0.786 Fibonacci retracement and High Volume Node support.
🎯 Terminal target for the business cycle could see prices as high as $0.8
📈 Weekly RSI is bearish with no divergence
👉 Analysis is invalidated if we close below wave 2, keeping wave 2 alive.
Safe trading
FET looking more and more like a pump & dump scam.Huge engulfing candle from the oversold threshold just above the 0.786 alt-coin golden pocket.
The trend remains down despite this candle with no bullish market structure yet. The weekly 200EMA is finally turning down. Until we get above the descending trend-line, the probability is lower. The 5-wave structure down hints at no new all-time high, as this is a motif wave.
🎯 Terminal target for the business cycle could see prices as high $1.2 when momentum returns
📈 Weekly RSI tapped oversold with no divergence and can remain here for months
👉 Analysis is invalidated above the weekly pivot
Safe trading

ETH hit my downside target now what?Wave 1 appears to have completed a leading diagonal with a poke above all-time high- what we expect from wave 1. Wave 2 is underway, testing the weekly 200EMA so far, and an expected reversal point- also the 0.382 Fibonacci retracement.
The retracement has been shallow, but ETH was beaten down and undervalued, making a shallow pullback expected. The 0.5 Fibonacci retracement is the next downside target at the S1 pivot.
🎯 Terminal target for the business cycle could see prices as high as $9000
📈 Weekly RSI was oversold with bearish divergence and has now reset below the channel EQ.
👉 Analysis is invalidated only if we get below the wave (4) bottom $1365
Safe trading

DOGE, Weekly bullish divergence!Uptrend remains intact from the wave 4 bottom. We could still be in wave 4 as they are characterised by their long, complex ranges. A flat or a triangle is possible.
Wave (1) appears complete as a leading diagonal followed by a deep wave (2), which is expected after this pattern. Price is bullishly riding the weekly 200EMA but bearish below the pivot. Wave (3) should be powerful and fast; any slow grind may hint that we are still in wave IV
🎯 Terminal target for the business cycle could see prices as high as $1.7 based on Fibonacci extensions
📈 Weekly RSI has printed bullish divergence, a good sign but it can take weeks to play out
👉 Analysis is invalidated below wave (2)

BNB Count changed, wave 4 underwayPrice completed a macro wave 3. Wave 4 is expected to end at the 0.382 Fibonacci and may not extend below the 0.5. Crypto assets can overextend in wave 5, which I believe we will see over the next year.
ave 4 is underway testing the previous all-time High Volume Node and 0.236 Fibonacci retracement zone. Price remains in an uptrend.
🎯 Terminal target for the business cycle could see prices as high as $2000, the R5 weekly pivot
📈 Weekly RSI printed bearish divergence from overbought and is already resetting below the EQ. It rarely gets oversold.
👉 Analysis is invalidated below the weekly pivot and 200EMA
Safe trading

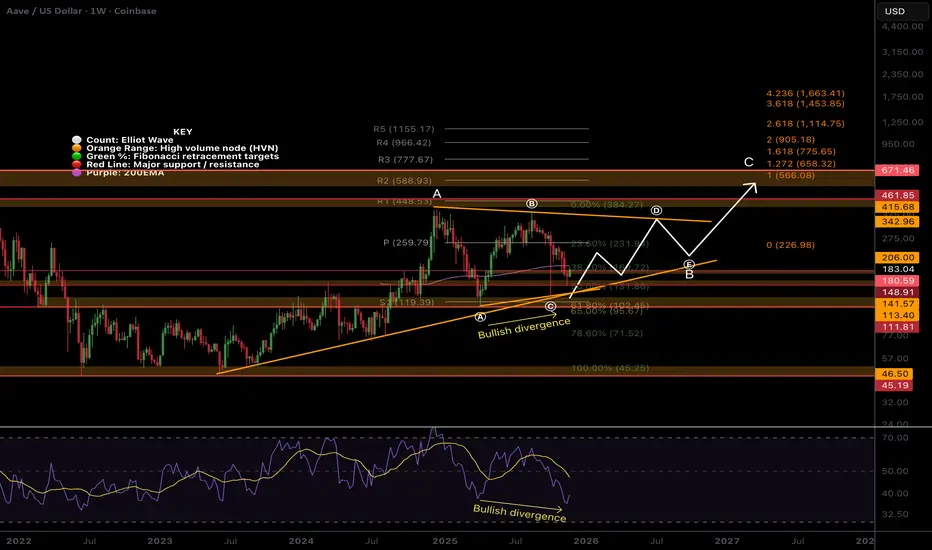
AAVE Macro outlook, weekly bullish divergenceA price range between $440 and $130 continues. Price appears to have completed triangle wave (c) of a larger wave B. Wave (D) is next, with a target of the upper boundary trend-line ~$340.
Price has lost the 200EMA but followed the outlined path of a pump and pullback after wave ©. The weekly pivot is the likely termination point for wave (E), but there is work to be done first. Price found terminal support at the golden pocket Fibonacci retracement.
We are just in a huge range, and there isn’t much more to say on the macro. This asset has been one of the best winners for trading the last 3 years, sticking to the rules strictly.
🎯 Terminal target for the business cycle is still the 1:1 Fib extension, but may be overextended to the 1.272, per wave C rules. Both are around the all-time High Volume Node ~$600
📈 Weekly RSI has room to fall and has printed bullish divergence.
👉 Analysis is invalidated below wave (A) or wave (B)
Safe trading
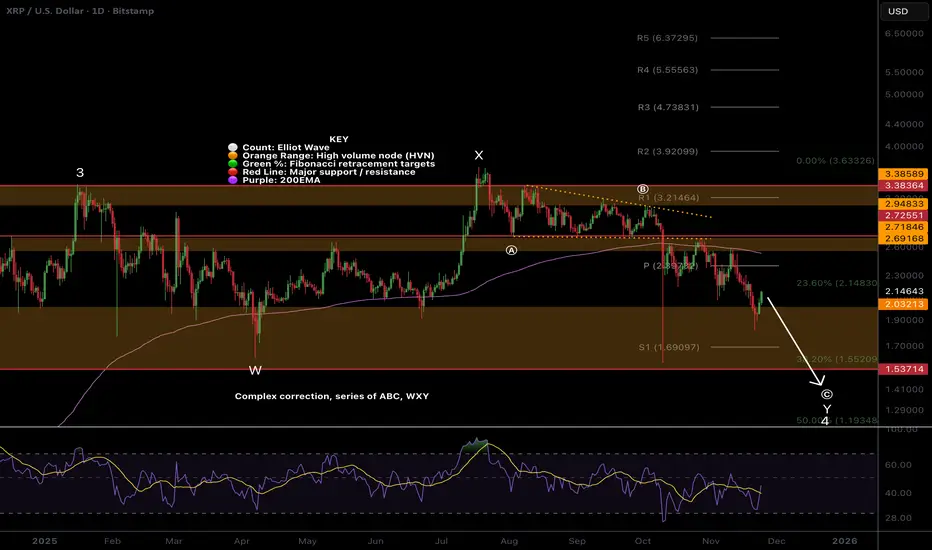
XRP count changed, wave 4 underwayPrice appears to have completed a WXY after the Oct 10th flash crash, but further downside is possible to complete wave 4.
Wave (B) completed a barrier triangle, which suggests the thrust down was the final move before reversal. Price has revisited the wick- expected price behaviour, and we are now looking for a bottom.
Price is below the daily 200EMA and pivot, which is bearish.
📈 Daily RSI reached oversold with no divergences
👉 Continued downside brings up the $1.75 High Volume Node EQ
Safe trading
SUI Dropped hard! More to come?Price accelerated in a downtrend, falling below a major High Volume Node support, invalidating the macro triangle.
Wave C of a textbook ABC correction is underway with a target of the golden pocket. and S2 pivot at $1.
📈 Daily RSI is oversold with no divergence
👉 Continued downside has a next target of $1
Safe trading

SOL looks weak, lower in wave C?Price continues lower, a textbook ABC correction so far.
Wave B ended shy of all-time high. Price lost the daily 200EMA and is testing the major High Volume Node support. The probability is a continuation to the downside.
📈 Daily RSI reached oversold with no divergence
👉 Continued downside brings up the $112 target
Safe trading

HBAR still in the channel!Price is back in the descending range after dropping below during the flash crash, which can be viewed as an anomaly.
Wave 2 appears complete at the golden pocket Fibonacci retracement. Price was rejected at the daily 200EMA and channel upper boundary and has lost the daily pivot and High Volume Node, suggesting further downside is to come.
📈 Daily RSI bounced from oversold alongside price with no divergence.
👉 Continued downside has a target of $0.07 at the next High Volume Node support and alt-coin golden pocket 0.786
Safe trading

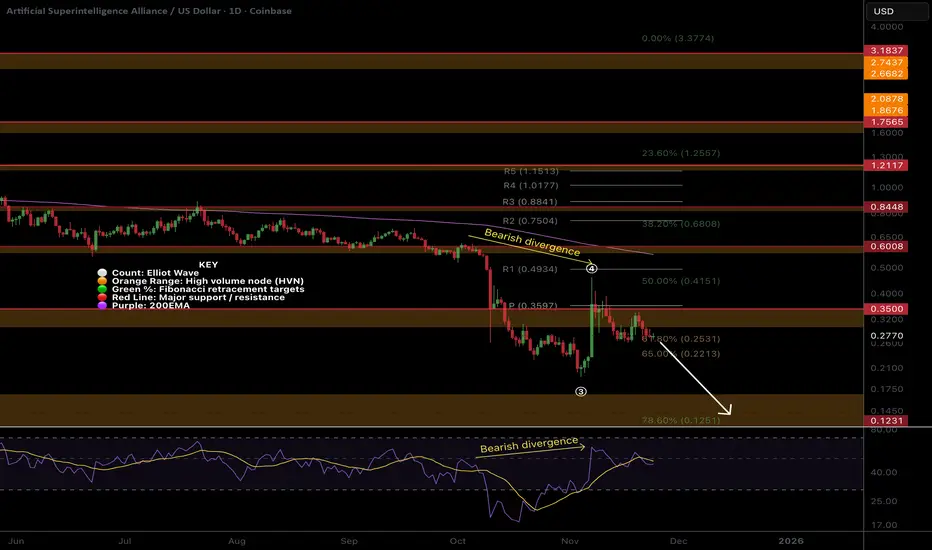
FET looks weak, more downsidePrice bounced with a one-day candle of 70% for wave (4), immediately being rejected on daily bearish divergence.
Chasing candles higher is what’s on the cards of naive investors now. Greed and FOMO immediately took over socials with much gloating, and price humbled them. This is a recipe for lower. Price has lost the High Volume Node, pivot and is well below the 200 EMA.
📈 Daily RSI went too high, too fast, and now has bearish divergence in a bear market, a strong signal.
👉 The next downside target is $0.13
Safe trading
Doge, bullish divergence on daily.Price was rejected at the daily pivot per the last report’s analysis. The downtrend is intact.
Wave (2) appears complete after the Oct 10th flash crash, just above the ‘alt-coin’ golden pocket, 0.786 Fibonacci retracement. The trend remains down, so further downside is the higher probability. Price needs to overcome the heavy resistance ahead before we can talk about being bullish long-term.
📈 Daily RSI has printed bullish divergence
👉 Continued downside has a target of the 0.618 Fibonacci retracement and High Volume Node $0.12
Safe trading

BNB, downtrend in tact.The downtrend is intact. Price completed macro wave (3) at the R1 pivot, retraced and lost the daily 200EMA, 0.236 Fibonacci retracement and S1 pivot, but the downtrend looks exhausted.
Wave 4 appears complete with a textbook ABC correction ending at strong support and the channel bottom. The downtrend is intact, so the probability is still to the downside until the structure flips or price recovers the daily 200EMA.
📈 Daily RSI has reached oversold with no divergences
👉 Continued downside has a target of the High Volume Node at $730
Safe trading

AAVE Local, bottoming soon?Locally, price continues bearish after falling out of the wedge, completing wave (B) of the macro triangle. Price action looks ready to reverse
Wave © appears complete after the big drop, black swan event- Oct 10th. I was looking for a dip back into the long lower wick, which we have and price is finding support. This suggests we grind higher from here, but we must get through the daily 200EMA, just above the High Volume Node resistance and daily pivot. This area will be tough to crack and was rejected on the first attempt.
📈 Daily RSI has printed bullish divergence from the oversold threshold- a bottoming signal.
👉 Continued downside has a next target of $114.
Safe trading

COIN Short Trade Setup — Smart Entry Levels Revealed!🎯 COIN "The Crypto Exchange Heist" 💰
Stock Market Profit Playbook for Swing & Day Traders
📈 Analysis Overview 🔍
Asset: NASDAQ:COIN | Coinbase Global Inc. ⚡
Current Price: $295.22 (Nov 7, 2025) 💵
Market Cap: $79.60B 🏆
Trading Volume: Bullish liquidity ✅
Technical Bias: BEARISH CONFIRMED ⬇️
🎲 The Setup: Bearish Hull Moving Average Breakout
We've identified a critical bearish breakdown pattern with Hull Moving Average (HMA) confirmation. The rejection from the $350 resistance zone combined with oversold conditions creates the perfect "HEIST" opportunity for disciplined traders.
Key Technical Signals 🚨:
✅ Hull MA showing downtrend confirmation
✅ Price rejection from upper resistance
✅ Volume compression into breakdown
✅ RSI divergence in overbought territory
✅ Support trap formation at key levels
🎪 ENTRY STRATEGY: The "Layering Heist" Technique 💎
Method: Multiple Limit Order Layers (Position Stacking Strategy)
Instead of chasing ONE entry, we deploy the Thief OG Layering System — multiple entry levels to average down as the bearish thesis develops:
📍 Entry Layers (Top to Bottom):
Layer 1: $340.00 💎
Layer 2: $330.00 💎
Layer 3: $320.00 💎
Layer 4: $310.00 💎
Pro Tip: Feel free to add MORE layers based on your risk tolerance and account size! The more precise your layers, the better your average entry price. 🎯
🛑 Stop Loss Placement (Risk Management Critical)
Thief OG's Recommended SL: $350.00 🚫
This sits above the rejection zone — if price reclaims $350+, the bearish thesis is invalidated, and we exit.
⚠️ DISCLAIMER: This is YOUR trade. We recommend this SL, but YOU control your risk. Adjust based on your position size and risk appetite. No feelings — just math! 📊
🎁 PROFIT TARGET (The "Escape Plan")
Primary Target: $240.00 🎯
Target Type: Strong Support + Oversold Zone + Trap Confirmation
Why $240?
Historical support confluence 📍
RSI reaching oversold extremes 📉
Previous institutional accumulation zone 🏦
Fibonacci 0.618 retracement level ✨
⚠️ CRITICAL NOTE: This is YOUR profit target decision. Once you're in profit, TAKE YOUR MONEY — don't be greedy! Secure gains at comfortable levels. Risk management > Ego. 💪
📊 Correlation Pairs to Watch 🔗
Keep an eye on these related assets for confluence signals:
Bitcoin (BTC)
Price Action: CRYPTOCAP:BTC is COIN's strongest correlation driver
Why?: Crypto market sentiment flows through BTC first → COIN follows
Watch For: BTC breaking $100K could trigger COIN capitulation 📉
Ethereum (ETH) 💠
Price Action: CRYPTOCAP:ETH directional bias impacts institutional flows
Why?: ETH derivative volume is massive on COIN's platform
Watch For: ETH breaking below $3,500 = bearish acceleration ⬇️
Nasdaq 100 (QQQ) 📈
Price Action: NASDAQ:QQQ tech sector health matters
Why?: COIN correlates with tech rallies & risk-off dumps
Watch For: QQQ support breaks = COIN weakness confirmed 🔴
Fear & Greed Index 😨😊
Watch: Extreme Greed (75+) = Potential top | Extreme Fear (25-) = Potential bottom
Why?: COIN is highly sentiment-driven
Action: Lower entries during Fear zones for better risk/reward 🎰
📋 Trade Checklist Before You Enter ✅
Confirm HMA bearish alignment on your timeframe
Check BTC & ETH correlation for confluence
Position size = Max 2-3% portfolio risk per trade
Set alerts at each layer level
NEVER move SL in the red (that's a LOSS, not protection)
Secure profits on the way up (don't wait for PT)
Journal every trade (you learn more from losses)
💡 Pro Trading Tips 🧠
Size Down in Uncertainty — If volume is low, position smaller
Trail Your SL — Once profit doubles, move SL to breakeven
Partial Profits — Take 50% at $280, let the rest run to $240
Never Average-Up — Only add on confirmations going DOWN
Time Your Layers — Don't slam all orders at once; space them out
📢 Join The Community 🚀
✨ If you find value in my analysis, a 👍 and 🚀 boost is much appreciated — it helps me share more setups with the community!
#COIN #Coinbase #CryptoTrading #SwingTrade #DayTrade #TechnicalAnalysis #BearishSetup #TradingStrategy #CryptoExchange #NASDAQ #HullMovingAverage #TradingIdeas #CryptoMarkets #RiskManagement #ProfitPlaybook #ThiefStrategy #EditorPick 🚀✨
