FET - Bulls Preparing for a Comeback?FET has completed a clean correction after its previous strong impulse move, retracing all the way back into the support zone around 0.23–0.28, which has been acting as a key demand area for weeks.
Price bounced from that zone and is now attempting to reclaim structure, signaling that buyers might be preparing to take control again.
For now, the market structure is simple:
Impulse upward ➝ Correction ➝ Potential new impulse.
If the bulls manage to hold above the orange zone and break the descending correction trendline, the next impulsive leg toward 0.50 becomes the most likely scenario.
However, if FET breaks back below 0.23, the bullish setup would fail and deeper downside would be expected.
We are now at the stage where the market decides whether the bulls fully take over… or if this bounce is just a pause before another dip. 🤔
⚠️ Disclaimer: This is not financial advice. Always do your own research and manage risk properly.
📚 Stick to your trading plan regarding entries, risk, and management.
Good luck! 🍀
All Strategies Are Good; If Managed Properly!
~Richard Nasr.
COIN-M

Crypto & Bitcoin Do or Die!In this video we show you the mother of all trendlines on BTC and why we think it will likely catch a dead cat bounce.
The total crypto market cap is at an inflection point. If this level doesn't hold we have a failed weekly bullish pattern.
A failed bullish pattern of results in extreme downside pressure.
BTC is retracing to a key 618 Fib level from your tariff low selloff so there is some support here.
Its also hitting a monthly chart trendline going back several years.
I like crypto for a long here on a risk to reward basis. If we lose this area keep in mind our next major support is $85k which is another 10K lower.

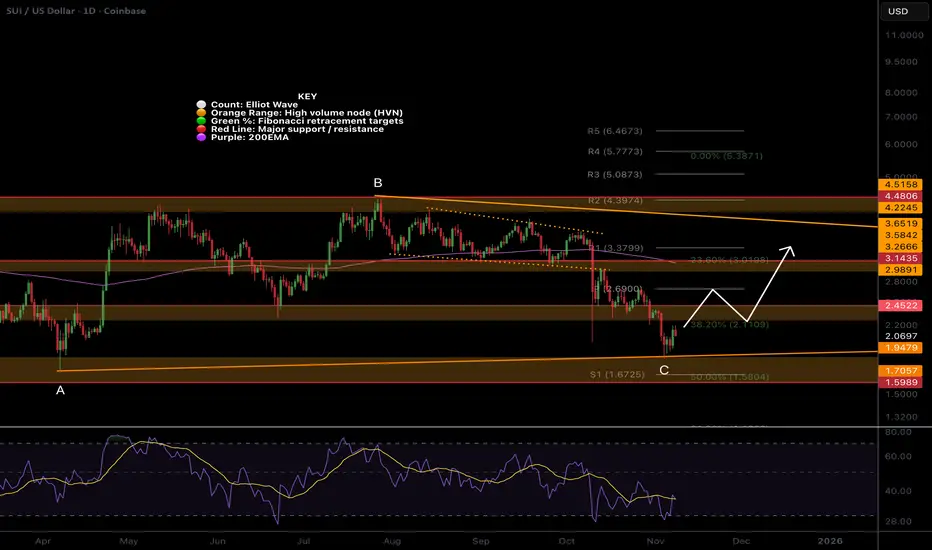
SUI remains in a shallow Fib triangleCRYPTOCAP:SUI Price remains in a downtrend, falling below a major High Volume Node support, tapping the macro triangle lower boundary.
Wave C of the triangle appears complete. If this count is correct, we should accelerate to the upper boundary around $3.6 over the next month or so, with some difficulty at the daily 200EMA and pivot as resistance.
📈 Daily RSI printed bullish divergence from oversold
👉 Continued downside loses the triangle pattern, and the next target is $1.6
Safe trading
SOL holds up wellCRYPTOCAP:SOL Price continues lower in the channel, a textbook ABC correction so far.
Wave 1 ended with a wedge throw-over. Price has found support above the Fibonacci golden pocket and High Volume Node at the channel's lower boundary. The probability is a continuation to the downside with a target of $140.
📈 Daily RSI tapped oversold with no divergence to suggest a bottom
👉 Continued downside brings up the $112 target, a great buy opportunity
Safe trading

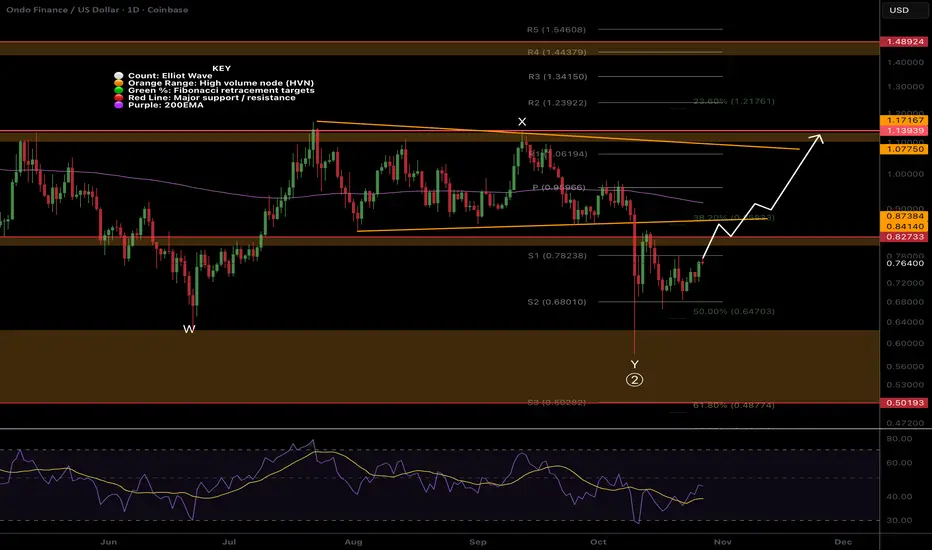
ONDO,1 more push lowerLSE:ONDO Price is sitting just above High Volume Node support, testing the descending trend-line as resistance. As long as we are below the trend-line, the probability is to the downside.
Wave 2 appears complete after 5 waves down from the wave X flat correction. Price was front-run at the golden pocket Fibonacci retracement, but only a bounce so far. We are below the daily pivot and 200EMA, which is bearish.
📈 Daily RSI tapped oversold twice with slight bullish divergence.
👉 Continued downside has a target of the bottom of the High Volume Node at $0.5
Safe trading

HBAR back in the channel!CRYPTOCAP:HBAR Price is back in the descending range after dropping below during the flash crash, which can be viewed as an anomaly.
Wave 2 appears complete at the golden pocket Fibonacci retracement. Price was rejected at the daily 200EMA and channel upper boundary and has lost the daily pivot and High Volume Node, suggesting further downside is to come.
📈 Daily RSI reached oversold and has printed hidden bullish divergence, which is bullish
👉 Continued downside has a target of the $0.13 High Volume Node
Safe trading

ETH Correction complete?CRYPTOCAP:ETH Wave 2 is taking the form of a complex WXYXZ correction broadening wedge. Ugly, hard to trade or find any entries. This will cause a lot of stress. This is also potentially a wave 4, but my preferred count is 2 for now.
Wave 2 appears complete with a swing below the boundary, but the recovery should have been stronger by now; instead, we are stalling below the daily 200EMA. The trend is down, and so we should expect more down. Wave X printed a triangle
📈 Daily RSI has not reached oversold and is still bearish with no divergences.
👉 Continued downside has a target of the High Volume Node $2600, where I will be adding.
Safe trading

DOGE More downside to come?CRYPTOCAP:DOGE Price is testing the bottom of the channel and pivot point as resistance, where it is likely to be rejected.
Wave (2) appears complete after the Friday flash crash, hitting the ‘alt-coin’ golden pocket, 0.786 Fibonacci retracement. The trend remains down, so this is the higher probability. Price needs to overcome the heavy resistance ahead before we can talk about being bullish long-term.
📈 Daily RSI has printed bullish divergence, which is bullish
👉 Continued downside has a target of the 0.618 Fibonacci retracement and High Volume Node $0.12
Safe trading

BNB Bearish continuation?CRYPTOCAP:BNB Price appears to have completed wave (1) at the R1 pivot and has retraced to the daily 200EMA, 0.5 Fibonacci retracement and S1 pivot so far. A tough nut to crack.
Wave (2) appears complete with a textbook ABC correction ending at strong support. The downtrend is intact, so the probability is still to the downside until the structure flips.
📈 Daily RSI has not reached oversold and is still bearish with no divergences
👉 Continued downside loses the 200EMA and brings up the Golden pocket as support $740
Safe trading

AAVE local analysis updated, Bear trend continueEURONEXT:AAVE Locally, price continues bearish after falling out of the wedge, completing wave 1. Until the price gets above the orange descending trend-line, the probability is downside continuation.
Wave 2 appears complete after the big drop, black swan event. I was looking for a dip back into the long lower wick, which we have and price found support. This suggests we grind higher from here, but we must get through the daily 200EMA, just above the High Volume Node resistance and daily pivot. This area will be tough to crack.
The alternative count is a triangle forming discussed below, which is the (A)(B)(C) shown.
📈 Daily RSI has printed bullish divergence from the oversold threshold, which is bullish and a bottoming signal.
👉 Continued downside has a next target of $150.
Safe trading

Coinbase wave C underway NASDAQ:COIN Price appears to be completing wave C of IV, a corrective pattern to the downside expected to be shallow.
Wave IV are often shallow ending no further than the 0.5 Fibonacci retracement. This is just below the S2 pivot and High Volume Node support. 0.382 is the higher probability target for the end of the downwards move aligning with a swing below the daily 200EMA and S1 pivot.
Daily RSI has room to fall.
Breaking wave B would suggest a new bull move is underway.

COIN Bullish Continuation: Breakout Above 361 Toward 390–400COIN on the 1D chart is pressing near recent highs after breaking a multi-month range in early October and flagging through most of the month. Momentum stays constructive with price above the 20/60/120-day cluster and Bollinger Bands expanding. The prior range top has flipped to support, keeping the structure bullish.
The immediate hurdle is resistance at 355, with the recent swing high at 361.40 acting as the confirmation line. A daily close above 361.40 would validate the bull-flag continuation and opens room toward the 390–400 zone, with interim interest around 375. If momentum pauses first, a controlled pullback into 330—aligned with the breakout retest and the MA60—would be a constructive demand zone; 320 is the key higher-timeframe floor that anchors the trend.
Primary path: look for a break-and-hold above 355/361.40 to extend into 375 and then 390–400 as the next resistance band. Alternative path: if price fails to reclaim 355 and loses 330, expect a drive toward 320; a daily close below 320 would invalidate the bullish thesis and shift risk to a deeper correction.
This is a study, not financial advice. Manage risk and invalidations.

COIN Much higher to comeCoinbase had a shallow pullback in wave (II) after running 10x in wave (I). Wave (II) was expected to reach the 0.618 Fibonacci retracement but was front run above the 0.5 demonstrating long term strength.
R5 weekly pivot target is now $841 which is expected to be hit if we get tailwind momentum in wave (III). Price appears to be finding a bottom locally and preparing for the next leg up into price discovery.
RSI has plenty of room for months of overextension in price.
🎯 Terminal target for the business cycle could see prices as high as $800 based on the weekly pivots
📈 Weekly RSI is oversold with no divergence and can remain here for months as price keeps increasing.
👉 Analysis is invalidated below wave (II), $148

COINBASE (COIN) – Watching for Pullback Entry Around $343Coinbase NASDAQ:COIN has surged nearly +20% since our previous update, powered by strength in the broader crypto sector. With price action now extended, we’re watching for a pullback opportunity around the $343 area — a previous zone of interest where buyers may step back in.
💡 Trade Setup:
Entry Zone: $343 (on pullback confirmation)
Take Profit Targets:
TP1: $360–$390
TP2: $415–$440
Stop Loss: $303 (below key support)

COIN | 200 SMA Confluence + Bullish Doji = High-Value Setup🎯 COIN: The 200 MA Heist — Dip Buyers Stacking Bags While Others Panic 💼🔥
📊 Asset Intelligence
Coinbase Global Inc (COIN) — NASDAQ
Strategy Classification: Swing/Day Trade Hybrid
Market Bias: Bullish Pullback Confirmation
Risk Profile: Calculated Aggression
🧠 Technical Thesis — Why This Setup Slaps
Listen up, Thief OG's 👀
COIN just pulled back to the 200 Simple Moving Average and did exactly what professional setups do — it respected support and reversed. We got a textbook Heikin Ashi reversal doji candle forming right at the MA, signaling buyer exhaustion turned into buyer dominance.
Translation for the streets: Big money stepped in. Retail panicked. We capitalize.
📈 What We're Seeing:
200 SMA holding like a vault door 🔐
Heikin Ashi doji = indecision flipped to bullish conviction
Volume profile showing accumulation, not distribution
Buyers got the juice to push this higher
This isn't hopium. This is structure meeting momentum at a critical support zone.
💰 The "Thief Strategy" Entry Playbook
We don't chase. We layer. We scale. We steal profits from emotional traders.
Instead of slapping market buy like a degen, we're using layered limit orders to build our position as price moves in our favor. Think of it like planting money traps on the way down.
🎯 Entry Layers (Limit Orders):
Layer 1: $330 💵
Layer 2: $340 💵
Layer 3: $350 💵
Layer 4: $360 💵
You can add more layers if you're feeling spicy 🌶️. The goal is to dollar-cost average into strength, not weakness. Let the market come to YOU.
Pro Tip: Not all layers need to fill. Sometimes you only catch 2-3. That's fine. Better to miss some entry than to get caught in a fake-out.
🛡️ Risk Management — Protect Ya Neck
Stop Loss: $310 🚨
Real talk, Thief OG's: This is MY stop based on MY risk tolerance. You are NOT me. You don't have my account size, my strategy, or my psychology.
Set your own stop based on:
How much you're willing to lose per trade
Your position size
Your personal pain threshold
If COIN breaks below $310, the thesis is invalidated. The 200 MA failed. Buyers lost control. We exit, regroup, and find the next heist. No ego. No revenge trading. Just discipline.
🎯 Target Acquisition — Where We Take the Bag
Primary Target: $430 💎
⚡⚠️ WARNING: Resistance Fortress Ahead
At $430, we're walking into a battlefield:
Historical resistance = sellers have limit orders stacked
Overbought territory = indicators flashing red
Trap zone activated = late buyers will get liquidated here
What smart money does: Lock profits. Don't marry the trade. Don't get greedy.
Potential scenarios:
🟢 Strong momentum? Trail your stop and let winners run
🟡 Consolidation at $420? Take 50-75% off the table
🔴 Rejection at $430? Exit immediately, don't hope
(Thief OG's — again, this is MY target. You might want to exit at $400 for quick profits. You might want to hold for $450. Your rules. Your capital. Your consequences.)
🔗 Correlated Assets — The Bigger Picture
Don't trade COIN blind. Context is king.
Watch These Tickers:
BITSTAMP:BTCUSD & BITSTAMP:ETHUSD
Correlation: STRONG
COIN is basically a leveraged play on crypto sentiment. Bitcoin pumps = COIN pumps harder. Bitcoin dumps = COIN dumps harder. Always check the crypto market before entering.
⛏️ NASDAQ:MARA & NASDAQ:RIOT
Correlation: HIGH
Fellow crypto-exposed stocks. If they're ripping, COIN usually follows. If they're bleeding, stay cautious.
💳 SET:SQ (Block Inc.)
Correlation: MODERATE
Fintech + crypto exposure. Similar institutional money flows. Good confirmation indicator.
💵 TVC:DXY (US Dollar Index)
Correlation: INVERSE
Strong dollar = crypto weakness = COIN weakness
Weak dollar = crypto strength = COIN strength
Simple math. Don't ignore macro.
🔑 Key Insight: If Bitcoin is fighting resistance at $70K while COIN is trying to break out, one of them is lying. Read the room.
📌 Technical Breakdown — The Charts Don't Lie
✅ 200 SMA Support: Holding firm — institutional support level
✅ Heikin Ashi Reversal: Doji + bullish follow-through = momentum shift confirmed
✅ Volume Analysis: Accumulation on dips, not capitulation
✅ Risk/Reward Ratio: Solid if stops are honored and targets are realistic
⚠️ Resistance at $430: Real, tested, and dangerous — respect it
⚠️ Crypto Market Dependency: If BTC drops 10%, COIN drops 15%. Stay alert.
📢 Thief OG Community Rules
Never risk more than you can afford to lose — period.
Position sizing > entry price — manage your risk first, profits second.
Stick to YOUR plan — my plan is mine. Yours is yours.
Take profits — unrealized gains aren't real until you close the trade.
No FOMO, no revenge trades — discipline beats emotion every time.
✨ If you find value in my analysis, a 👍 and 🚀 boost is much appreciated — it helps me share more setups with the community!
#COIN #Coinbase #SwingTrading #DayTrading #ThiefStrategy #CryptoStocks #TechnicalAnalysis #PullbackSetup #HeikinAshi #200MA #NASDAQ #BullishSetup #LayeredEntry #RiskManagement #SmartMoney #PriceAction #TradingView #StockMarket #SwingTrader

XRP at major resistanceCRYPTOCAP:XRP is tapping major resistance and the previous channel lower boundary just above the daily 200EMA
If we break through the daily pivot offers resistance followed by the channel upper boundary trend-line. There is work to be done.
RSI hit oversold but no divergence.
Safe trading

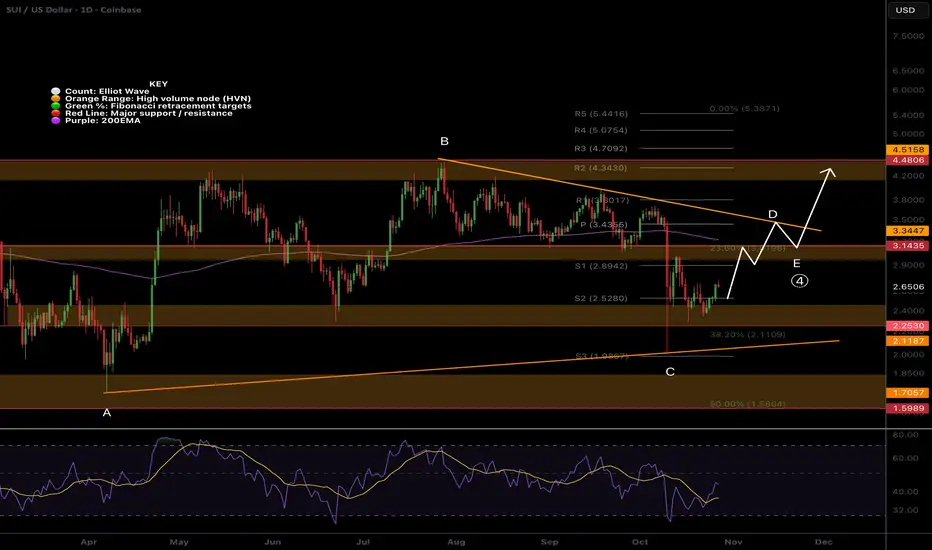
SUI remains in macro triangleNothing changed form last update, plan is playing out. Wave (c) of D is underway and should test the triangle upper boundary and find resistance at the High Volume Node along the way- $3.14.
Daily RSI hit oversold with no divergence. wave E is expected to be shallow
Safe trading
SOL at resistance, has work to doCRYPTOCAP:SOL is at major resistance High Volume Node just below the daily pivot.
The local trend has flipped bullish but a strong move may not be on the cards until we climb the wall of worry through resistance. Price is riding the daily 200EMA.
Daily RSI did not print bullish divergence or reach oversold.
Safe trading

ONDO beaten down, resistance aheadLSE:ONDO has work to do but I am a forward looking narrative trader and believe we have a major RWA (Real World Asset tokenisation) narrative ahead to pump these coins.
Ahead lies High Volume Node resistance, previous channel lower boundary, descending daily 200EMA and the daily pivot to overcome... not easy but this is crypto and can be all taken out in 5 seconds.
Price terminated with a front run of the golden pocket showing strength over other alts.
Daily RSI hit oversold, no divergence
Safe trading
HBAR Heavy resistance aheadCRYPTOCAP:HBAR is about to hit resistance - daily 200EMA and S1 pivot, but has re-entered the channel after a deep swing below with daily RSI hitting oversold.
I am expecting price to climb the wall of worry generated by all the fear from the Friday flash crash + macro-economic environment and 'cycle top' narrative that is all driving market FEAR
WaveC of 2 completed at the golden pocket Fibonacci retracement.
Safe trading

ETH back above resistanceCRYPTOCAP:ETH megaphone channel is being respected as we approach the upper boundary after overcoming resistance High Volume Node now support.
The daily pivot will also proof tough to overcome and there should be no clean breakout to all time high as we climb the wall of worry from all of the cycle top nonsense... FEAR
Price tested the daily 200EMA as support, normal behaviour and printed bullish divergence from oversold W to Y.
Safe trading

BNB respecting the trend-lineCRYPTOCAP:BNB tested the lower boundary support line and caught a bid flipping bullish market structure.
Daily RSI printed bullish divergence from the EQ where price continues to find a bottom
Even during the flash crash price only tested the 0.382 Fibonacci retracement demonstrating the power of the macro uptrend and token reliability
Analysis is only invalidated below the trend-line. Elliot wave count is particularly difficult on BNB but it appears a macro wave 5 is underway which can extend for months.
Safe trading

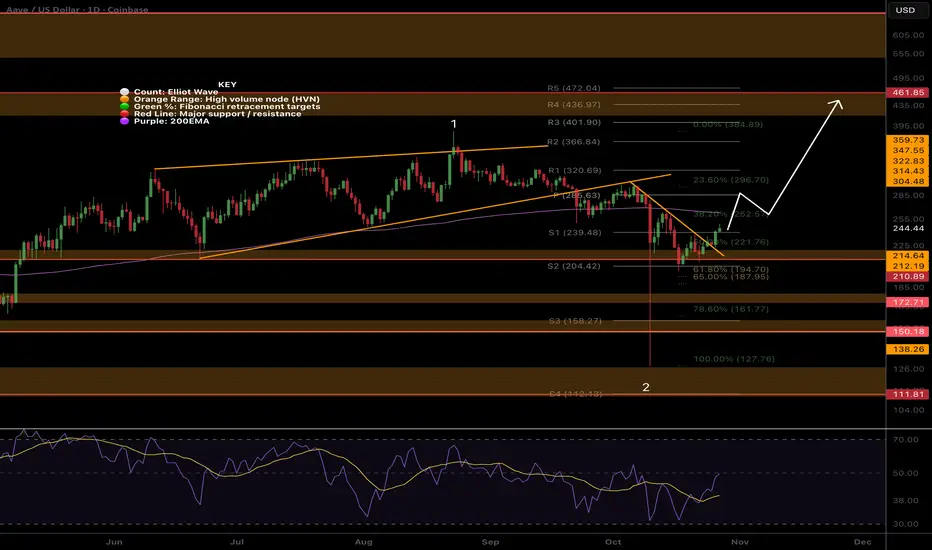
AAVE Bullish structure from supportEURONEXT:AAVE has printed bullish structure from support but the daily 200EMA looms ahead, once cracked AAVe should move well. Price tested the golden pocket Fibonacci retracement.
AAVE did not pullback as much as most alt-coins and is expected to be one of the first to break into all time high / price discovery. First target is $460 High Volume Node.
Daily RSI almost hit oversold twice in what looks like a double bottom
Analysis is invalidated if we drop below $187
Safe trading